Back to Journals » Clinical Ophthalmology » Volume 15
Factors Determining the Morphology of Peripapillary Retinoschisis
Authors Nishijima R ![]() , Ogawa S
, Ogawa S ![]() , Nishijima E, Itoh Y, Yoshikawa K
, Nishijima E, Itoh Y, Yoshikawa K ![]() , Nakano T
, Nakano T ![]()
Received 9 January 2021
Accepted for publication 23 February 2021
Published 25 March 2021 Volume 2021:15 Pages 1293—1300
DOI https://doi.org/10.2147/OPTH.S301196
Checked for plagiarism Yes
Review by Single anonymous peer review
Peer reviewer comments 2
Editor who approved publication: Dr Scott Fraser
Reimi Nishijima,1,2 Shumpei Ogawa,1 Euido Nishijima,1 Yoshinori Itoh,1 Keiji Yoshikawa,1,3 Tadashi Nakano1
1Department of Ophthalmology, The Jikei University School of Medicine, Tokyo, Japan; 2Department of Ophthalmology, The Jikei University Katsushika Medical Center, Tokyo, Japan; 3Yoshikawa Eye Clinic, Machida-city, Tokyo, Japan
Correspondence: Shumpei Ogawa
Department of Ophthalmology, The Jikei University School of Medicine, 3-19-18 Nishi-Shinbashi, Minato-ku, Tokyo, 105-8471, Japan
Tel +813 3433 1111
Fax +813 3433 1936
Email [email protected]
Purpose: We conducted cross-sectional examinations to determine the frequency of peripapillary retinoschisis (PRS) in eyes with glaucoma and suspected glaucoma and analyzed the pathogenesis of PRS by using spectral-domain optical coherence tomography (SD-OCT).
Patients and Methods: In 1516 cases involving glaucoma and suspected glaucoma, we retrospectively reviewed the disc and macular volume scans obtained by SD-OCT and categorized PRS into two groups based on whether the retinoschisis was closer to the optic nerve over the Bruch’s membrane opening (BMO) (ahead group) or did not go past the BMO (behind group) and then compared the characteristics between both groups.
Results: The total frequency of PRS was 1.49% (20/1342 eyes) in primary open-angle glaucoma (POAG) eyes and 0.59% (10/1687 eyes) in glaucoma suspects. In the behind group, PRS was mostly detected in the inner layers of the retina (retinal nerve fiber layer: 30.9%, ganglion cell layer: 21.8%, inner plexiform layer: 7.3%). However, in the ahead group, PRS was detected in the outer layers (inner nuclear layer: 10%, outer plexiform layer: 20%, outer nuclear layer: 50%). In addition, the eyes in the ahead group had significantly greater axial lengths and significantly smaller spherical equivalent values. These two differences suggest that the pulling force of the vitreous traction may play an important role in PRS only in the behind group and that the scleral stretching force may play a role in the development of PRS in the ahead group.
Conclusion: The frequency of PRS in patients with POAG is higher than that in patients with suspected glaucoma. Both forms of PRS are affected by posterior vitreous detachment and axial length elongation. Careful follow-up is required to assess the development of PRS in glaucoma suspects. The pathogenesis of PRS has been elucidated to some degree by classifying the morphological condition of the PRS and BMO.
Keywords: peripapillary retinoschisis, optical coherent tomography, glaucoma, myopia
Introduction
Optical coherent tomography (OCT) has enabled us to observe the minute changes in the retina following diseases by providing high resolution images.1 Conventionally, glaucoma was diagnosed and its progression was detected by quantitatively measuring the change in the thickness of each retinal layer, such as the peripapillary retinal nerve fiber layer (RNFL) and macular inner retinal layers, with visual field assessments. However, recently, additional retinal structural abnormalities associated with glaucoma have been reported.2,3
Before the OCT era, it was considered that peripapillary retinoschisis (PRS) occurred in congenital optic disc abnormalities which include optic pit, coloboma, tilted disc syndrome, and Morning Glory syndrome.4–10 In the OCT era, PRS is characterized by the splitting of the peripapillary RNFL, ganglion cell layer (GCL), inner plexiform layer (IPL), inner nuclear layer (INL), outer plexiform layer (OPL), and outer nuclear layer (ONL) without any optic disc abnormalities other than glaucomatous optic neuropathy. In this paper, PRS represents the aforementioned OCT findings. An association between PRS and glaucoma has been recently reported. Glaucoma presents in various forms, including primary open-angle glaucoma (POAG),11–13 normal-tension glaucoma (NTG), narrow angle-closure glaucoma,14,15 and pseudoexfoliation glaucoma.16 Although PRS is occasionally detected in normal eyes, it is more likely to occur in POAG or glaucoma suspects (GS). The estimated prevalence of PRS in POAG and GS varies from 1% to 6% and it is reported that the prevalence in POAG is higher than in GS.12,13,17–20 This difference indicates the relationship between glaucoma and PRS.
The pathogenesis of PRS has not been fully elucidated, but some reports have speculated that vitreoretinal traction in association with posterior vitreous detachment (PVD) may play a role in PRS development.18,21 PRS was detected in retinal nerve fibers adjoining the optic disc margin and extended toward the fovea.17 Recent technological advancements in spectral-domain optical coherence tomography (SD-OCT) have enabled precise analysis of each retinal layer as well as the interface of the anterior surface of the retina and vitreous.1,22 SD-OCT also clarified the morphological condition of Bruch’s membrane, which is postulated to be an anatomical boundary around the optic nerve head (ONH).23
In this study, we investigated the prevalence of PRS in a large number of patients with POAG and GS. We then utilized SD-OCT images of the retinal layers and the vitreoretinal interface around the optic disc margin and perifoveal area in relation to the morphological condition of PRS, employing the Bruch’s membrane opening (BMO) as a landmark to elucidate the pathogenesis of PRS.
Patients and Methods
This project was approved by the Jikei university clinical research review board (No. 26–373 (7879)) and followed the Declaration of Helsinki and the Japanese ethical guidelines for medical and health research involving human participants. Informed consent from patients was obtained through an opt-out method. Those who rejected could be excluded. No patients were excluded.
Materials
We retrospectively reviewed the medical records of consecutive patients from January 2017 to December 2018 at the Jikei University School of Medicine. A total of 3029 eyes of 1516 patients with POAG (1342 eyes) and GS (1687 eyes) underwent cross-sectional evaluations. Glaucoma or GS diagnoses were made by glaucoma specialists.
All patients underwent a comprehensive ophthalmologic examination, including measurements of best-corrected visual acuity with the Landolt C chart, intraocular pressure (IOP) measurements by Goldmann applanation tonometry, slit-lamp biomicroscopy, gonioscopy, measurements of central corneal thickness by corneal pachymetry, dilated ophthalmoscopy, and fundus photography, axial length measurement (IOLMaster, Carl Zeiss Meditec AG, Jena, Germany), visual field measurements with Humphrey Visual Field Analyzer (HFA, Carl Zeiss Meditec, Dublin, CA) or a head-mounted perimetry system (imo, CREWT Medical Systems, Tokyo, Japan), and measurements of RNFL thickness using Spectralis HRA-OCT (Version 4; Heidelberg Engineering, Heidelberg, Germany). Glaucomatous optic neuropathy and visual field defects consistent with optic changes were evaluated. Glaucomatous optic neuropathy was diagnosed when (1) the vertical cup-to-disc ratio of the ONH was 0.7 or greater, (2) the rim-to-disc ratio at the superior portion (11–1 o’clock positions) or inferior portion (5–7 o’clock positions) was 0.1 or less, (3) the difference in the vertical cup-to-disc ratio between eyes was 0.2 or greater, or (4) an RNFL defect was found. Visual field sensitivity was measured using the HFA 24–2 or 30–2 SITA Standard program (HFA) or 24–2 plus (imo).24 Based on Anderson-Patella’s criteria,25 glaucomatous visual field defects were diagnosed under the following conditions: (1) the glaucoma hemifield test results were outside normal limits, (2) pattern deviation probability plots, in the upper or lower hemifield, showed a cluster of three or more non-edge contiguous points showing sensitivity with a probability of less than 5%, of which at least one point had a probability less than 1%, or (3) a pattern with standard deviation outside the 95% normal confidence limits.
Structural Assessment with Spectral-Domain OCT
SD-OCT (Spectralis HRA-OCT version 4; Heidelberg Engineering, Heidelberg, Germany) was used for structural assessment of the retina and ONH. ONH scans in SD-OCT were performed for all glaucoma patients and GS. Twenty-four radial scans (scan pattern size: length, 15°; distance between adjacent B-scans, 7.5°) and three circular scans (scan pattern: diameter, 12°) were performed (Figure 1). OCT image quality was identified from the quality bar (range, 0–40 decibels). OCT data were exported from the imaging instruments, and the radial scans and three circle scans were reviewed by eye.
 |
Figure 1 An OCT image showing PRS. (A) Infrared image of the optic nerve showing the location of the B-scan and extent of the PRS (left). OCT demonstrates PRS in the RNFL, GCL, and OPL (white arrowhead) (right). (B) Infrared image of the optic nerve showing the location of circle scan analysis. Two-dimensional analysis of the area 3.5 mm from the ONH. PRS is present in the RNFL, GCL, and OPL (arrowhead). Abbreviations: OCT, optical coherent tomography; PRS, peripapillary retinoschisis; RNFL, retinal nerve fiber layer; GCL, ganglion cell layer; OPL, outer plexiform layer. |
Definition of PRS
PRS was characterized by splitting of the peripapillary RNFL, GCL, IPL, INL, OPL, and ONL without any optic disc abnormalities other than glaucomatous optic neuropathy. We defined PRS as a retinal cystoid or a bundle-shaped splitting detected by SD-OCT without an optic pit or other anomalies. The inclusion criteria were (1) the existence of retinal splitting, (2) splitting form of the cystoid and nerve fiber bundle, and (3) splitting between two layers, including those where the layers themselves were separated. Eyes with an intraocular lens were also included. The exclusion criteria were the presence of staphyloma, optic nerve pits, pseudo-pits, coloboma, optic nerve disease other than glaucoma, and media opacity affecting OCT scan quality: scans with image quality less than 20 were excluded.
Classification of PRS
The end of Bruch’s membrane at the ONH is defined as the BMO. Within 24 scan lines, the Glaucoma Module Premium Edition (GMPE) of the Spectralis version 6.0 SD-OCT software (Heidelberg Engineering, Inc) automatically detects 48 BMO 160 positions along the ONH to determine the BMO-based disc margin. PRS, which is detected by OCT and is associated with glaucoma, is characterized by the splitting of the peripapillary RNFL, GCL, IPL, INL, OPL, and ONL without any optic disc abnormalities other than glaucomatous optic neuropathy.
We classified PRS based on the morphological relationship between the edge of the PRS and the edge of BMO into two groups: “behind group” (proximal edge of the PRS did not exceed the BMO to the optic nerve) and “ahead group” (proximal edge exceeded the BMO to the optic nerve) (Figure 2). Thus, PRS that did not exceed or reach up to the BMO was categorized as “behind PRS,” while PRS that exceeded the BMO was defined as “ahead PRS.” A continuous schisis which exceeded the BMO was categorized as “ahead”. The OCT images of the PRS were independently assessed by three evaluators (RN, SO, and KY), and the categorization of PRS as ahead or behind was based on a consensus among the three evaluators.
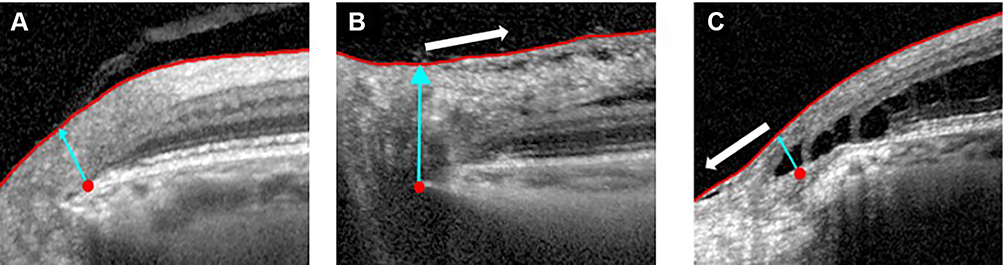 |
Figure 2 The classification of PRS. Red point and blue arrow represent BMO in three pictures. (A) Normal case: No PRS is present. (B) Behind group: The proximal edge of the PRS does not exceed the BMO and heads for the macular (white arrow). (C) Ahead group: PRS extends toward the optic disc beyond the BMO (white arrow). Abbreviations: PRS, peripapillary retinoschisis; BMO, Bruch’s membrane opening. |
Vitreous Traction
The presence of posterior vitreous adhesions before the detachment from the surface of the peripapillary retina was assessed by reviewing the vitreoretinal interface on SD-OCT images. We defined vitreous traction (+) when the vitreous surface adjacent to the RNFL and/or internal limiting membrane by the 4.7 mm diameter of the ONH was found. The GMPE software of SD-OCT provides peripapillary circle scans with a diameter of 4.7 mm. The absence of a space between the vitreous and retinal surfaces or the absence of a visible vitreous surface was classified as vitreous traction (-).
Statistical Analysis
Clinical characteristics were compared between the groups by using the Student’s t-test, Fisher exact test. Analyses were performed using EZR Version 1.40 software (Saitama Medical Center, Jichi Medical University, Saitama, Japan) and a graphical user interface for R (The R Foundation for Statistical Computing, Vienna, Austria). The level of significance was set at 5% (two-sided).
Results
Clinical Characteristics
We performed a cross-sectional study of 1516 patients (3029 eyes, 3 eyes did not undergo OCT examination) with glaucoma (1342 eyes) or suspected glaucoma (1687 eyes). Finally, PRS was found in 30/3029 eyes (1.1%; females: 19 eyes in 17 patients, males: 11 eyes in 11 patients). Twenty POAG eyes (1.49%) and 10 GS eyes (0.59%) had PRS (P-value=0.013). PRS prevalence was significantly higher in POAG eyes than in GS. The characteristics of patients with PRS are summarized in Table 1.
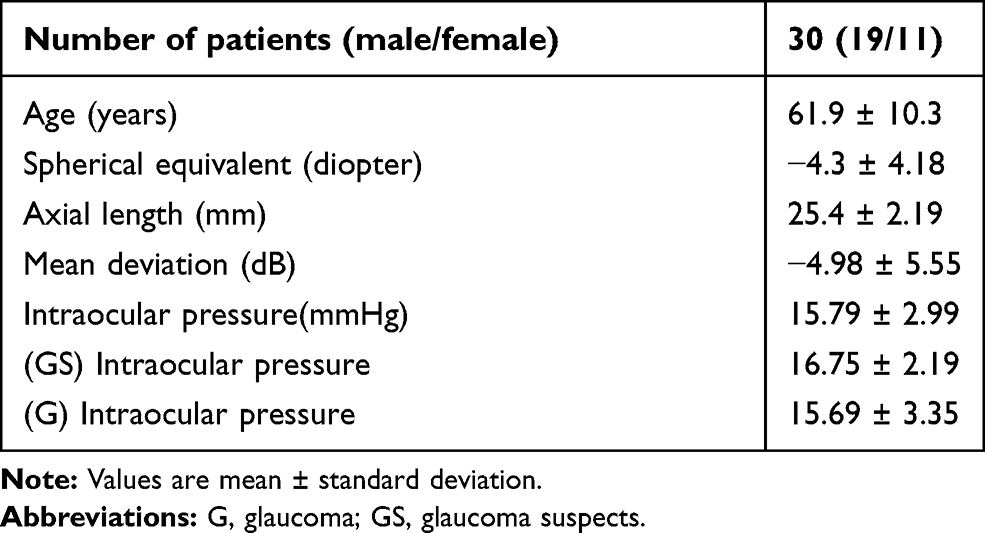 |
Table 1 Characteristics of Patients with PRS |
Comparison of Behind and Ahead Groups
The 30 eyes with PRS were divided into two groups based on the extent of retinal layer splitting. All eyes in both behind and ahead groups were myopic. The eyes in the ahead group had significantly longer axial lengths and smaller spherical equivalent values than those in the behind group. PVD was observed in 11/24 cases in the behind group and in 0/6 cases in the ahead group. There were no significant intergroup differences in age, and mean deviation (Table 2).
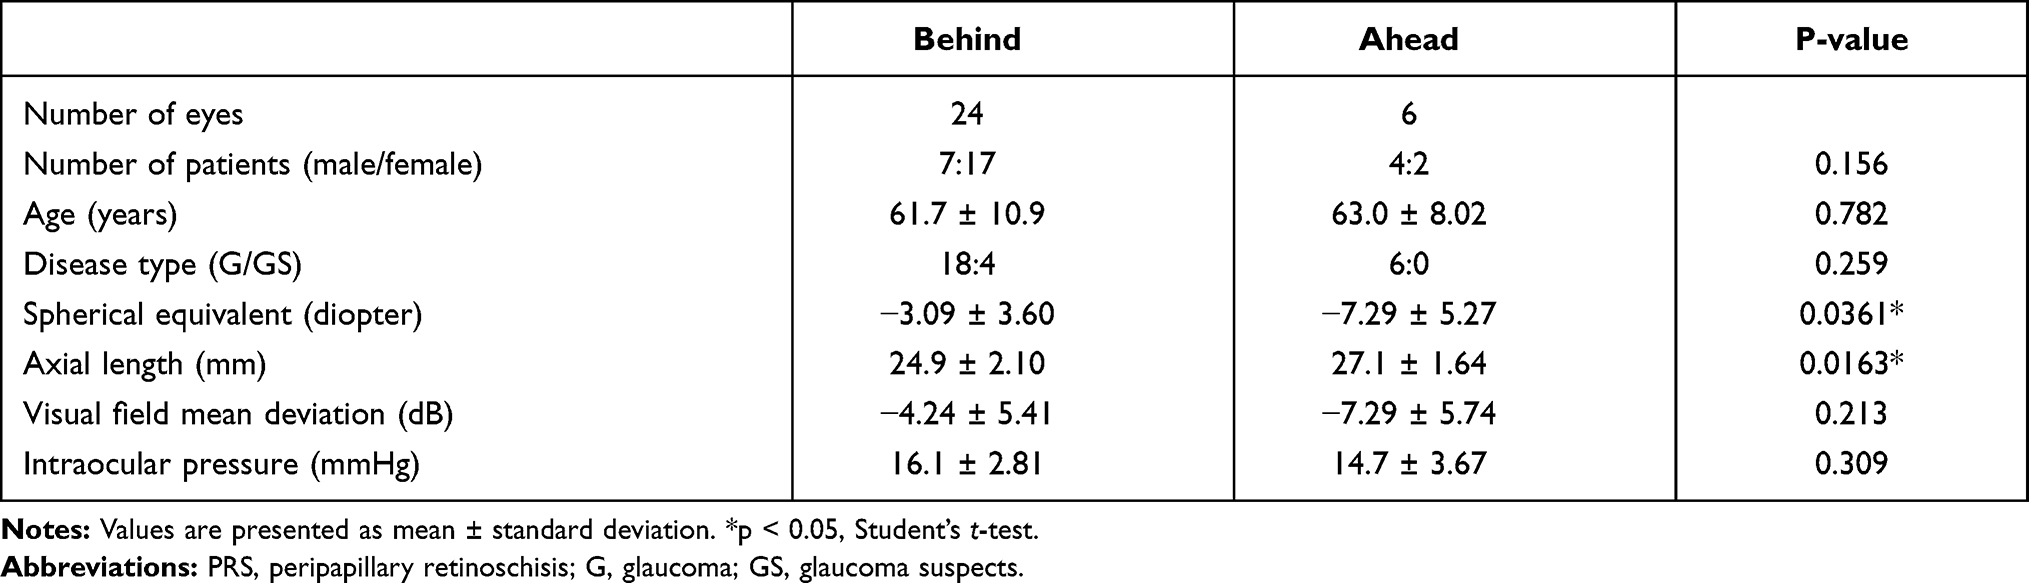 |
Table 2 Characteristics of Each PRS Group |
Location of PRS in the Retinal Layers
In the behind group, PRS was observed in 55 of 144 retinal layers (six layers each in 24 eyes). In the ahead group, PRS was observed in 10 of 36 retinal layers (six layers each in six eyes) (Table 3). We then classified the RNFL, GCL, and IPL as inner layers and the INL, OPL, and ONL as outer layers. In a comparison of PRS locations, the behind group showed a significantly greater abundance in the inner layers, while the ahead group showed a significantly greater abundance in the outer layers (Table 4). We examined the presence of vitreous traction (+) in the RNFL and/or internal limiting membrane of the PRS eyes in the two groups. In the behind group, vitreous traction was found in 13 of 24 eyes, while in the ahead group, no vitreous traction was found in the six eyes (Figure 3).
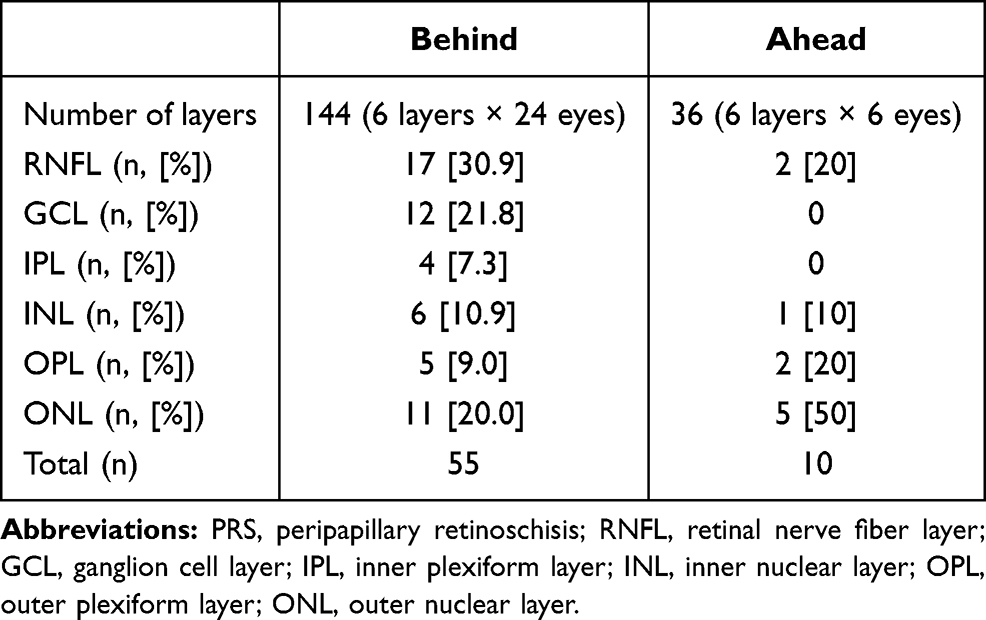 |
Table 3 The Location of PRS of Each Group |
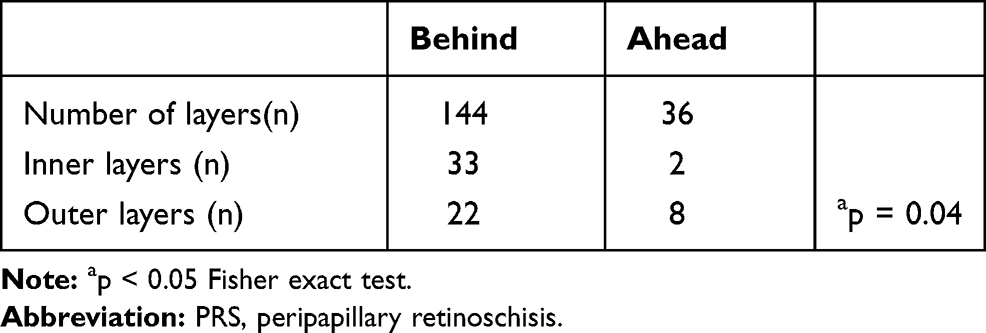 |
Table 4 Comparison of PRS Positions of Each Group in the Inner and Outer Layers |
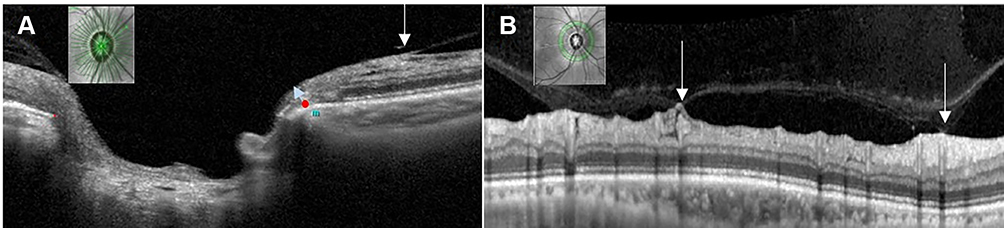 |
Figure 3 The presence of vitreous traction. (A) ONH analysis by SD-OCT demonstrates PRS of the behind group in the RNFL (white arrow). PRS occurs in the area adhering the vitreous traction. Red points and blue arrow represents Bruch’s membrane opening. (B) Two-dimensional analysis of the area 4.7 mm from ONH demonstrates PRS in the RNFL. The area where vitreous traction pulls shows “tenting” (white arrow). Abbreviations: ONH, optic nerve head; SD-OCT, spectral-domain optical coherence tomography; PRS, peripapillary retinoschisis; RNFL, retinal nerve fiber layer. |
Discussion
Among 1342 eyes with POAG and 1687 GS, PRS was detected in 20 eyes with POAG (1.49%) and 10 GS eyes (0.59%). The frequency of PRS detection in the present study was relatively smaller than that in previous reports (1–3%).12,18 The diagnostic reliability for assessment of PRS in this study was ensured by the use of SD-OCT, which has the highest resolution in detecting abnormalities in the juxta-papillary to perifoveal tissue and retina. Thus, we believe that the frequency of PRS in glaucoma eyes is 1–3%. On the other hand, the frequency of PRS in GS in our study (0.59%) was not apparently different from that in previous reports.
All participants in our study were Japanese people, and the majority of POAG cases in Japan involved NTG,26 which is characterized by primary vulnerability in the optic disc and a variety of risk factors, such as elevated IOP, disc hemorrhage, myopia, and aging, contributing to the development of glaucomatous changes. Therefore, we believe that the prodromal findings of PRS appeared in GS with no apparent visual field defects but with a certain glaucomatous ONH structure. The present results indicate the necessity of a careful follow-up for the assessment of the development of PRS in GS.
Ophthalmoscopic examination proved that PRS is present between the optic disc and the macula, and SD-OCT depicts PRS most frequently in the RNFL among 10 retinal layers.17,20 In this study, similar to previous reports, PRS was most frequently found in the RNFL but was detected in each retinal layer. The results suggest that a variety of factors may be related to the pathogenesis of PRS.
Therefore, we used the edge of Bruch’s membrane as a reference mark to classify the condition of PRS in relation to the pathogenesis, since BMO corresponds to the landmark of the anatomical disc margin.23
On the basis of the morphological condition between the edge of the PRS and the edge of the BMO, PRS was classified as being present near the optic disc (ahead group: PRS extended past the BMO towards the optic disc) and at a distance from the optic disc (behind group: PRS did not exceed the BMO and headed for the macula). The present system classified 24 (80.0%) of 30 PRS eyes in the behind group, while the remaining 6 eyes (20.0%) were categorized into the ahead group. In the eyes in the behind group, PRS was observed in the GCL (12/24), IPL (4/24), and RNFL, which were categorized as the inner layers of the retina. The retina was pulled toward the vitreous in association with the occurrence of vitreous traction before PVD. The inner layers of the retina are thought to be more directly affected by the vertical direction against the retinal surface in the pulling force of the vitreous traction. This result indicated a close relationship between the pathogenesis of PRS and the development of vitreous traction. A previous report stated that the average peripapillary RNFL thickness of eyes with PVD was significantly greater than that of eyes without PVD.27 The area of vitreous adhering to RNFL showed a “tenting” like shape and succeeded in RNFL thickening in GS (Figure 3: tenting), indicating the continuous pulling power of the inner retinal layers toward the vitreous.27 PVD initially developed in the paramacular region as incomplete PVD, forming the remaining attachments to the ONH and the macula and extending slowly to form complete PVD.28,29 This may be a reason why vitreous traction occurs over time and PRS occurs between the macula and the ONH. Therefore, we speculated that the pathogenesis of PRS in the behind group was attributable to mechanical vitreous traction to the retinal inner layer. The gradual increase in the frequency of the PRS from the NFL to the GCL and IPL in our study may support this speculation.
In the eyes of the ahead group, PRS was detected in the outer layers, such as in the INL (1/10 layers), OPL (2/10 layers), ONL (5/10 layers), and a significantly greater axial length and significantly smaller equivalent spherical power were evident in comparison with those in the behind group. After scleral expansion to the back in association with the increasing axial length, the differences in the integrity of the Bruch’s membrane and the surrounding retinal tissue may have led to the development of a crack between the Bruch’s membrane and the surrounding retinal tissue.30 Invasion of the liquefied vitreous through the crack into the retinal tissue is thought to underlie the pathogenesis of PRS development. More frequent assessment of PRS in the ONL and OPL may provide clues to the pathogenesis of the scleral stretching force of the PRS in the eyes of the ahead group. One of the factors determining the morphology of PRS is the axial length and equivalent spherical power.
These findings raise the question as to whether vitreous traction before PVD can be solely attributed to the pathogenesis of PRS, since PVD can occur in almost every eye over 50 years of age. In glaucomatous eyes, the presence of microholes, in which vitreous fluid invades the RNFL area to the retina because of abnormalities in the extracellular matrix of the ONH and its surrounding tissue, may also contribute to the pathogenesis of PRS.31 Decreased support and/or resistance in Muller cells was also evident in glaucomatous eyes, and the presence of a bridging structure of the splitting part in eyes with PRS associated with glaucoma was a morphologic feature reminiscent of Muller cells.13 Therefore, we speculated that vulnerability in RNFL and Muller cells may play a role in decreasing the tensile force of the retina.
This study has several potential limitations. First, this was a cross-sectional study and we focused on subjects with glaucoma and glaucoma suspects. We did not examine data in normal subjects, including prevalence and morphology of PRS. Second, the time course for the change from glaucomatous eyes to glaucoma eyes remains unclear. The duration of PRS existence may be greater in the eyes with glaucoma because, compared to normal eyes, the structure of Muller cells in glaucomatous eyes is considered weaker.13,32 PRS prevalence was significantly higher in POAG eyes than in GS. It is likely that ONH vulnerability varies between POAG eyes and GS. Large scale surveys and longitudinal research are needed to determine the association of these characteristics with disease progression in glaucoma eyes and the onset and progression of PRS for GS. Moreover, although we compared two morphological types of PRS, the ahead group had only 6 eyes, and a larger sample size was needed. Third, we did not evaluate choroidal thickness in this population. Recently peripapillary pachychoroid syndrome (PPS), a novel pachychoroid disease spectrum causing intraretinal and/or subretinal fluid and optic nerve head edema in some eyes, has been reported.33 We excluded patients with intraretinal and/or subretinal fluid in the macular area, although the possibility of contamination of PPS remains.
Conclusion
The frequency of PRS in patients with POAG is higher than that in GS. Both forms of PRS are affected by vitreous traction and axial length elongation. Careful follow-up is needed to assess the development of PRS in GS. The pathogenesis of PRS is to some degree elucidated by classifying the morphological conditions of the PRS and BMO.
Abbreviations
PRS, peripapillary retinoschisis; SD-OCT, spectral-domain optical coherence tomography; BMO, Bruch’s membrane opening; POAG, primary open-angle glaucoma; OCT, Optical coherent tomography; RNFL, retinal nerve fiber layer; PRS, peripapillary retinoschisis; GCL, ganglion cell layer; IPL, inner plexiform layer; INL, inner nuclear layer; OPL, outer plexiform layer; ONL, outer nuclear layer; NTG, normal-tension glaucoma; GS, glaucoma suspects; PVD, posterior vitreous detachment; ONH, optic nerve head; BMO, Bruch’s membrane opening; IOP, intraocular pressure; HFA, Humphrey Visual Field Analyzer.
Acknowledgments
This study was supported by Japan Society for the Promotion of Science (JSPS) KAKENHI (17K18131,20K18396 to S.O) and the Japanese Ministry of Health, Labour, and Welfare (MHLW) (19FA1010 to T.N). We would like to thank Editage for English language editing.
Disclosure
The authors report no conflicts of interest in this work.
References
1. Cense B, Nassif N, Chen T, et al. Ultrahigh-resolution high-speed retinal imaging using spectral-domain optical coherence tomography. Opt Express. 2004;12(11):2435–2447. doi:10.1364/OPEX.12.002435
2. Yeh S-I, Chang W-C, Wu C-H, et al. Characteristics of peripapillary choroidal cavitation detected by optical coherence tomography. Ophthalmology. 2013;120(3):544–552. doi:10.1016/j.ophtha.2012.08.028
3. Sawada Y, Araie M, Shibata H, Ishikawa M, Iwata T, Yoshitomi T. Optic disc margin anatomic features in myopic eyes with glaucoma with spectral-domain OCT. Ophthalmology. 2018;125(12):1886–1897. doi:10.1016/j.ophtha.2018.07.004
4. George ND, Yates JR, Moore AT. Clinical features in affected males with X-linked retinoschisis. Arch Ophthalmol. 1996;114(3):274–280. doi:10.1001/archopht.1996.01100130270007
5. Rosenfeld PJ, Flynn HW, McDonald HR, et al. Outcomes of vitreoretinal surgery in patients with X-linked retinoschisis. Ophthalmic Surg Lasers. 1998;29(3):190–197.
6. Hirakata A, Hida T, Ogasawara A, Iizuka N. Multilayered retinoschisis associated with optic disc pit. Jpn J Ophthalmol. 2005;49(5):414–416. doi:10.1007/s10384-004-0227-z
7. Scott IU. Surgical management of macular retinoschisis associated with high myopia. Arch Ophthalmol. 2006;124(8):1197. doi:10.1001/archopht.124.8.1197
8. Tang J, Rivers MB, Moshfeghi AA, Flynn HW, Chan -C-C. Pathology of macular foveoschisis associated with degenerative myopia. J Ophthalmol. 2010;2010:1–4. doi:10.1155/2010/175613
9. Miura G, Yamamoto S, Tojo N, Mizunoya S. Foveal retinal detachment and retinoschisis without macular hole associated with tilted disc syndrome. Jpn J Ophthalmol. 2006;50(6):566–567. doi:10.1007/s10384-006-0360-y
10. Chang S, Gregory-Roberts E, Chen R. Retinal detachment associated with optic disc colobomas and morning glory syndrome. Eye. 2012;26(4):494–500. doi:10.1038/eye.2011.354
11. Farjad H, Besada E, Frauens BJ. Peripapillary schisis with serous detachment in advanced glaucoma. Optom Vis Sci. 2010;87(3):E205–E217. doi:10.1097/OPX.0b013e3181d1dad5
12. Bayraktar S, Cebeci Z, Kabaalioglu M, Ciloglu S, Kir N, Izgi B. Peripapillary retinoschisis in glaucoma patients. J Ophthalmol. 2016;2016:1612720. doi:10.1155/2016/1612720
13. Fortune B, Ma KN, Gardiner SK, Demirel S, Mansberger SL. Peripapillary retinoschisis in glaucoma: association with progression and OCT signs of müller cell involvement. Invest Ophthalmol Vis Sci. 2018;59(7):2818–2827. doi:10.1167/iovs.18-24160
14. Hollander DA, Barricks ME, Duncan JL, Irvine AR. Macular schisis detachment associated with angle-closure glaucoma. Arch Ophthalmol. 2005;123(2):270–272. doi:10.1001/archopht.123.2.270
15. Kahook MY, Noecker RJ, Ishikawa H, et al. Peripapillary schisis in glaucoma patients with narrow angles and increased intraocular pressure. Am J Ophthalmol. 2007;143(4):697–699. doi:10.1016/j.ajo.2006.10.054
16. Ornek N, Büyüktortop N, Ornek K. Peripapillary and macular retinoschisis in a patient with pseudoexfoliation glaucoma. BMJ Case Rep. 2013;2013:bcr2013009469–bcr2013009469. doi:10.1136/bcr-2013-009469
17. Lee EJ, Kim T-W, Kim M, Choi YJ. Peripapillary retinoschisis in glaucomatous eyes. PLoS One. 2014;9(2):e90129. doi:10.1371/journal.pone.0090129
18. Grewal DS, Merlau DJ, Giri P, et al. Peripapillary retinal splitting visualized on OCT in glaucoma and glaucoma suspect patients. PLoS One. 2017;12(8):e0182816. doi:10.1371/journal.pone.0182816
19. van der Schoot J, Vermeer KA, Lemij HG. Transient peripapillary retinoschisis in glaucomatous eyes. J Ophthalmol. 2017;2017:1536030. doi:10.1155/2017/1536030
20. Dhingra N, Manoharan R, Gill S, Nagar M. Peripapillary schisis in open-angle glaucoma. Eye. 2017;31(3):499–502. doi:10.1038/eye.2016.235
21. Hwang YH, Kim YY, Kim HK, Sohn YH. Effect of peripapillary retinoschisis on retinal nerve fibre layer thickness measurement in glaucomatous eyes. Br J Ophthalmol. 2014;98(5):669–674. doi:10.1136/bjophthalmol-2013-303931
22. Leung CK-S, Yu M, Weinreb RN, Lai G, Xu G, Lam DS-C. Retinal nerve fiber layer imaging with spectral-domain optical coherence tomography: patterns of retinal nerve fiber layer progression. Ophthalmology. 2012;119(9):1858–1866. doi:10.1016/j.ophtha.2012.03.044
23. Chauhan BC, Burgoyne CF. From clinical examination of the optic disc to clinical assessment of the optic nerve head: a paradigm change. Am J Ophthalmol. 2013;156(2):218–227.e2. doi:10.1016/j.ajo.2013.04.016
24. Matsumoto C, Yamao S, Nomoto H, et al. Visual field testing with head-mounted perimeter “imo”. PLoS One. 2016;11(8):e0161974. doi:10.1371/journal.pone.0161974
25. Anderson DR, Patella VM. Automated Static Perimetry: Mosby. St Louis; 1999.
26. Iwase A, Suzuki Y, Araie M, et al. The prevalence of primary open-angle glaucoma in Japanese: the Tajimi Study. Ophthalmology. 2004;111(9):1641–1648. doi:10.1016/j.ophtha.2004.03.029
27. Liu Y, Simavli H, Que CJ, et al. Patient characteristics associated with artifacts in Spectralis optical coherence tomography imaging of the retinal nerve fiber layer in glaucoma. Am J Ophthalmol. 2015;159(3):565–576.e2. doi:10.1016/j.ajo.2014.12.006
28. Uchino E, Uemura A, Ohba N. Initial stages of posterior vitreous detachment in healthy eyes of older persons evaluated by optical coherence tomography. Arch Ophthalmol. 2001;119(10):14751479. doi:10.1001/archopht.119.10.1475
29. Tsukahara M, Mori K, Gehlbach PL, Mori K. Posterior vitreous detachment as observed by wide-angle OCT imaging. Ophthalmology. 2018;125(9):1372–1383. doi:10.1016/j.ophtha.2018.02.039
30. Kim M, Choung H-K, Lee KM, Oh S, Kim SH. Longitudinal changes of optic nerve head and peripapillary structure during childhood myopia progression on OCT: boramae myopia cohort study report 1. Ophthalmology. 2018;125(8):1215–1223. doi:10.1016/j.ophtha.2018.01.026
31. Xin D, Talamini CL, Raza AS, et al. Hypodense regions (holes) in the retinal nerve fiber layer in frequency-domain OCT scans of glaucoma patients and suspects. Invest Ophthalmol Vis Sci. 2011;52(10):7180–7186. doi:10.1167/iovs.11-7716
32. Chong RS, Martin KR. Glial cell interactions and glaucoma. Curr Opin Ophthalmol. 2015;26(2):73–77. doi:10.1097/ICU.0000000000000125
33. Phasukkijwatana N, Freund KB, Dolz-Marco R, et al. Peripapillary pachychoroid syndrome. Retina. 2018;38(9):1652–1667. doi:10.1097/IAE.0000000000001907
 © 2021 The Author(s). This work is published and licensed by Dove Medical Press Limited. The
full terms of this license are available at https://www.dovepress.com/terms
and incorporate the Creative Commons Attribution
- Non Commercial (unported, 3.0) License.
By accessing the work you hereby accept the Terms. Non-commercial uses of the work are permitted
without any further permission from Dove Medical Press Limited, provided the work is properly
attributed. For permission for commercial use of this work, please see paragraphs 4.2 and 5 of our Terms.
© 2021 The Author(s). This work is published and licensed by Dove Medical Press Limited. The
full terms of this license are available at https://www.dovepress.com/terms
and incorporate the Creative Commons Attribution
- Non Commercial (unported, 3.0) License.
By accessing the work you hereby accept the Terms. Non-commercial uses of the work are permitted
without any further permission from Dove Medical Press Limited, provided the work is properly
attributed. For permission for commercial use of this work, please see paragraphs 4.2 and 5 of our Terms.