Back to Journals » Journal of Multidisciplinary Healthcare » Volume 13
Factors Affecting Quality of Laboratory Result During Ordering, Handling, and Testing of the Patient’s Specimen at Hawassa University College of Medicine and Health Science Comprehensive Specialized Hospital
Received 26 May 2020
Accepted for publication 3 August 2020
Published 18 August 2020 Volume 2020:13 Pages 809—821
DOI https://doi.org/10.2147/JMDH.S264671
Checked for plagiarism Yes
Review by Single anonymous peer review
Peer reviewer comments 3
Editor who approved publication: Dr Scott Fraser
Demissie Assegu Fenta, Musa Mohammed Ali
Hawassa University, College of Medicine and Health Science, School of Medical Laboratory Science, Hawassa, Ethiopia
Correspondence: Demissie Assegu Fenta Tel +251 911 02 01 89
Email [email protected]
Background: The increase of medical laboratory test errors represents the increase of all defects within the process. An error can be any defect during the entire process, from ordering to reporting. It may have negative effects on patient care, by contributing to inappropriate treatment, an increase in lengths of hospital stay, and dissatisfaction with healthcare services. Therefore, this study aimed to determine factors affecting the quality of laboratory results through the entire process.
Methods: A cross-sectional study was conducted at Hawassa University hospital from October 2018 to May 2019. Data were collected by using structured questionnaires and checklist and entered and analyzed using SPSS version 21. P-values less than 0.05 were considered statistically significant.
Results: A total of 455 individuals participated in this study. During the actual observational assessment, 72.5% of laboratory professionals identify their patients correctly and 62.5% of them label the sample before collection. In multivariate logistic regression, labeling of sample before collection (AOR=1.357, 95% CI=1.09, 1.58, P- 0.017), use of unmixed (AOR=4.364, 95% CI=1.950, 20.036, P- 0.049) and hemolyzed blood for testing (AOR=1.403, 95% CI=1.096, 1.692 P- 0.021) were associated with laboratory test errors. The clinical service providers who requested the test believed, lack of efficient laboratory service (P=0.005), unable to use manuals (P=0.025), and incorrect interpretation of reference booklets were associated with laboratory errors. Patient residence and frequency of first and second visits of the hospital were statistically associated with laboratory errors.
Conclusion: The occurrence of laboratory errors in our study was demonstrated by the distribution pattern, the preanalytical, analytical, and post-analytical steps. But changes have occurred in the types and frequencies of errors in these phases of testing by laboratory professionals, clinicians, and patients in the current study. Therefore, the hospital administrations, laboratory professionals and clinicians should work harder and closer to solve the identified problems.
Keywords: quality, laboratory result, clinical services providers, patients Hawassa, Ethiopia
Introduction
Recognizing that the diagnostic laboratory plays a very important and significant role in medical decisions and public health, and recognizing the grave implications of the rising threat of multidrug-resistant organisms, and non-communicable diseases in healthcare services.1,2 However, the preanalytical phase of laboratory testing has long been known as the most vulnerable part of the total testing process where the majority of all errors in the laboratory occur, potentially leading to misidentifications, transportation/storage errors or erroneous results due to poor sample quality (hemolysis) or contamination, which could have negative consequences for patient care3,4 which takes place before the sample reaches the laboratory and most of these errors are caused by human mistakes.5
Even though laboratory testing is a highly complex process and service, it is the backbone of the modern health care sector. Despite its rapid advances in laboratory science, it is still susceptible to various manual and systemic errors.6 These errors are classified as pre-analytical, analytical, and post-analytical, depending upon the time of their presentation.7,8
The fact that preanalytical processes primarily take place outside the laboratory makes it challenging to establish and implement quality control measures comparable to those used as standard throughout the analytical processes.9 It also encompasses many different participants such as patients, clinical service providers, management staff, sample transporters, and logistic personnel, who are the possible variables for contributing to the nonconformity of test results.9
Errors occurring starting from the time of test order from the physician until the sample is ready for analysis can account for up to 70% of the total errors.10 Errors at any stage of ordering, collection, testing, and reporting can lead to severe patient misdiagnosis. The total uncertainty in the test result due to pre-analytical reasons can be calculated,11 for example, changes in pre-analytical procedures can explain up to 41% of the variation of the value of hypercholesterolemia.12 Many mistakes in the total testing process are caused due to poor communication between laboratories and others involved in the testing process (eg, physicians, nurses, phlebotomists, and patients themselves), or poorly designed processes.
In a modern approach to total quality to address patient-centered needs and satisfaction, the occurrence of errors in pre-to post-examination steps must be minimized to guarantee the total quality of laboratory services.13 Recently, there was increasing attention to improving the quality of healthcare activities for patients worldwide, focusing on the quality of the laboratory’s results. Despite their importance, laboratories are often under-resourced, resulting in inadequate infrastructure, poorly trained personnel, and lack of standardization.14,15
In Ethiopia, laboratory services are given little attention until recent years. Improved testing technologies were made available to laboratories after the HIV pandemic burdened medical facilities.16 Among these improvements, a task-based, hands-on training program called SLMTA was aimed at effecting tangible laboratory improvements in developing countries17 It includes a series of three workshops that are supplemented by assigned improvement projects and supportive site visits or mentoring.18 This stepwise approach recognizes where a laboratory stands currently and encourages continual improvement through positive reinforcement by rewarding progress at each step.19,20
In peripheral and hospital, laboratories the total testing process depends first on what clinician thinks about the possible diagnosis, test selection, collection of patient’s sample, transportation to the laboratory, second it depends on the analysis and sending the report back to the clinician.21 Many studies indicated many errors in between these steps for example; missed and exchanged results which lead to delay in treatment and improper laboratory diagnosis.22
The causes of errors include inappropriate test requests, order entry, misidentification of patient and specimen, sample collection errors, hemolysis, clotting, insufficient quantity, inappropriate container, handling, storage, and transportation.23 These errors can have numerous consequences, such as an invasive procedure performed on the wrong patient as a result reported for the wrong patient, and missed or delayed diagnoses. Worst-case scenarios include missed cancer, unnecessary, surgical procedure, and hemolytic transfusion reactions.24
Quality laboratory result in the laboratory has a huge impact on diagnosis and patient management as 80–90% of all decision is made based on laboratory tests. Efficient and reliable laboratory services and networks are essential and fundamental components of effective, well-functioning health systems.
Among the sub-Saharan African countries, Ethiopia has the worst health status in the world as could be attested by accepted health indicators such as inefficient utilization of the availability of human material resources, health service management together measuring the efficiency of health care units, patient waiting for time and customer satisfaction and clients’ preference regarding the laboratory service. As a result, the accessibility of quality laboratory test results and the quality of available services remains a serious challenge. In addition to this, there is a complaint of a patient and health care providers on the quality of the laboratory test results.
Therefore, this study was aimed to determine factors affecting the quality of laboratory test results during ordering, handling, and testing patient specimens in Hawassa University College of Medicine and Health Science Comprehensive Specialized Hospital from October, 2018-may, 2019.
Materials and Methods
Study Design Area and Period
This cross-sectional study design was conducted at Hawassa University College of Medicine and Health Science Comprehensive Specialized Hospital in Sothern Ethiopia from October 2018-May 2019. The hospital is located in the capital city of Southern Nations and Nationalities People’s Region (SNNPR), Hawassa which is 275 km from Addis Abeba the capital city Ethiopia. It is the largest hospital in the region which serves about 15–22 million people around the catchment area, to the nearby zones and regions of the country. It also serves as a teaching, training center, and clinical service providing hospital. Different laboratory diagnostic services are given for patient diagnosis, treatment follows up, and monitoring of disease prognosis for both outpatient and inpatient departments.
Population
Source population
The source population of this study was laboratory professionals working in the hospital diagnostic laboratory during data collection, randomly selected patients who get laboratory service at least once in the hospital and clinical service providers who requested laboratory tests and used it for patient management in the hospital were included in the study. However, patients who were at emergency conditions requiring urgent intervention and staff of diagnostic laboratories who were not in place during, data collection and clinical service providers who were not requested laboratory tests were excluded from the study.
Sample Size and Sampling Technique
The sample size was estimated in different groups of the study participants, based on the assumption of single population proportion formula, taking the previous study in eastern Ethiopia25 where patient satisfaction level on the laboratory results was (87.6%) and Clinical service providers (80%). Taking a 5% margin of error and a 95% confidence level. The sample size was
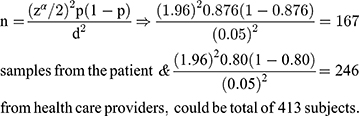
By adding a 10% non-response rate for patients and clinical service providers, the total sample size was 455 (184 patients + 231 clinicians + 40 Laboratory professionals) who participate in sample collection, handling, processing, and performing the test at Hawassa comprehensive specialized hospital were included in the study. A systematic random sampling technique was used to select the clinical service providers based on their qualifications and patients using card numbers and laboratory information system generating numbers in the laboratory. (Where: n = minimum sample size, P = taken from the previous study of clients and clinician satisfaction with laboratory services, d= the margin of error, zα/2= the standard normal variable at 1-α/2 confidence level).
Data Collection Method
After obtaining informed written consent data on sociodemographic, laboratory service, and specimen related factors were collected by using self-administered structured questionnaires for clinical service providers, both (self-administered structured questionnaires and observational checklist) for laboratory professionals and interviews and self-administered questionnaire for randomly selected patients by the trained data collector. The quality, validity, and completeness of data were checked by pre-testing in Adare hospital and the necessary amendment was made and its completeness was checked by the principal investigator daily.
Data Analysis
Data were coded, cleaned, entered, and analyzed using SPSS version 21. A 5 point Likert Scale rating of Poor (1-point), Fair (2-points), good (3-points), very good (4-points), and excellent (5 points) was used. Association between the explanatory variable and the outcome variable was checked by using binary logistic regression. Multivariate logistic regression was employed for adjustment to identify variables that were associated independently with the laboratory errors. A variable with P ≤ 0.26 in the bivariate analysis was included in multivariate analysis. Poor, fair, and good responses were considered as less quality laboratory results, whereas very good and excellent were considered as high-quality laboratory results for patient management. P-value <0.05 was considered as statistically significant.
Responses with neutral ratings were excluded and the percentage of less or high-quality laboratory results was calculated by dividing the number of less or high responses by the total number respondents excluding neutral response ratings, respectively.
The overall rate of satisfaction by Likert scale was calculated as (No. of excellent rating × 5) + (No. of very good rating x 4) + (No. of good rating x 3) + (No. of fair rating x 2) + (No. of poor rating x 1) divided by the total number of ratings (1–5) for the specific laboratory service. While the percentage of the excellent, very good, good, fair, or poor rating was calculated by dividing the number of excellent, very good, good, fair, or poor rating by the total number of ratings (1–5) for specific laboratory service, respectively.
Ethical Consideration
This study was reviewed and approved by the Institutional Review Board (IRB) of Hawassa University College of Medicine and Health Science with Reference No. IRB/034/11 and permission letter was obtained from the hospital clinical and academic director office. The purpose and importance of the study were explained to each study participant. To ensure confidentiality of participant’s information, anonymous typing was applied.
Results
Sociodemographic Characteristics
From a total of 455 participants. One hundred and eighty-four were patients with their accompanying request papers, 40 laboratory professionals, and 231 clinical service providers who requested laboratory tests were enrolled in this study. Among 40 laboratory professionals, 16 (40%) and 24 (60%) were males and females, respectively, with work experience of one to nine years and more.
From a total of 40 laboratory professionals 18 (45%) did not attend any work-related refreshment training, 19 (47.5%) of them believed that their laboratories did not produce quality laboratory results for their patients. According to the laboratory professionals, the major factors affecting the quality of laboratory results in this study were the shortage of supplies and reagents (95%), poor management support (72.5%), high workload 35 (87.5%), missing of laboratory results 28 (70%) and lack of equipment 37 (92.5%) (Table 1). Moreover, bivariate logistic regression analysis showed statistically significant association between the occurrence of laboratory result errors and factors such as result verification (COR=2.464, 95% CI=2.26, 7.480), IQC (COR= 1.439, 95% CI=1.107, 1.801), turnaround time (COR=1.700, 95% CI=1.420, 6.881), shortage of equipment (COR=1.35, 95% CI=1.55, 16.574), communication with clinicians (COR=1.63, 95% CI=1.15, 2.59) and lack of job description (COR=4.50, 95% CI=1.498, 10.22) (Table 1).
 |
Table 1 Sociodemographic Characteristics of Laboratory Professionals and Factors Affecting Laboratory Test Results at Hawassa University Hospital |
In addition to the interview, the observational assessment was also done on laboratory professionals to assess the actual laboratory practice on sample collection, testing, and reporting using a checklist. According to this assessment, 72.5% and 62.5% of them were correctly identified their patient and label patient sample before collection, respectively. Bivariate logistic regression was used to assess the association between the explanatory variable and the outcome variable (laboratory error) was checked by using binary logistic regression. Based on this improper labeling of patient specimen (COR=1.357, 95% CI=1.09, 1.58, P- 0.017), use of unmixed blood for testing (COR=4.364, 95% CI=1.950, 20.036, P- 0.049) and use of hemolyzed blood for testing (COR=1.403, 95% CI=1.096, 1.692, P-0.021) were significantly associated with laboratory errors, respectively. But, statistical association was not observed between patient identification (COR=0.462, 95% CI=0.101–2.100, P-0.317), adherence to SOP (COR=1.120, 95% CI=0.278, 4.508, P- 0.873) and application of tourniquet (COR=1.796, 95% CI=0.403, 8.002) (Table 2).
 |
Table 2 Observational Assessment of the Actual Laboratory Practice at Hawassa University Hospital (n=40) |
A total of 231 clinical service providers who requested laboratory tests were interviewed to assess their contribution to the occurrence of laboratory test errors introduced during ordering, sample collection, and interpreting of laboratory test results in this study. Among these 19 (8.2%), 9(3.9%), 91 (39.4%), 108 (45.9%), and 6(2.6%) of them were specialists, general practitioners, residents, intern students, and other health care professionals, respectively. In bivariate logistic regression, the efficiency of laboratory service provided in the hospital had a significant association between laboratory test errors introduced by clinical service providers (P=0.005) who, are unable to use the available laboratory manuals such as laboratory handbook (P=0.025) and inappropriate use and interpretation of reference booklets with the occurrence of laboratory result errors (Table 3).
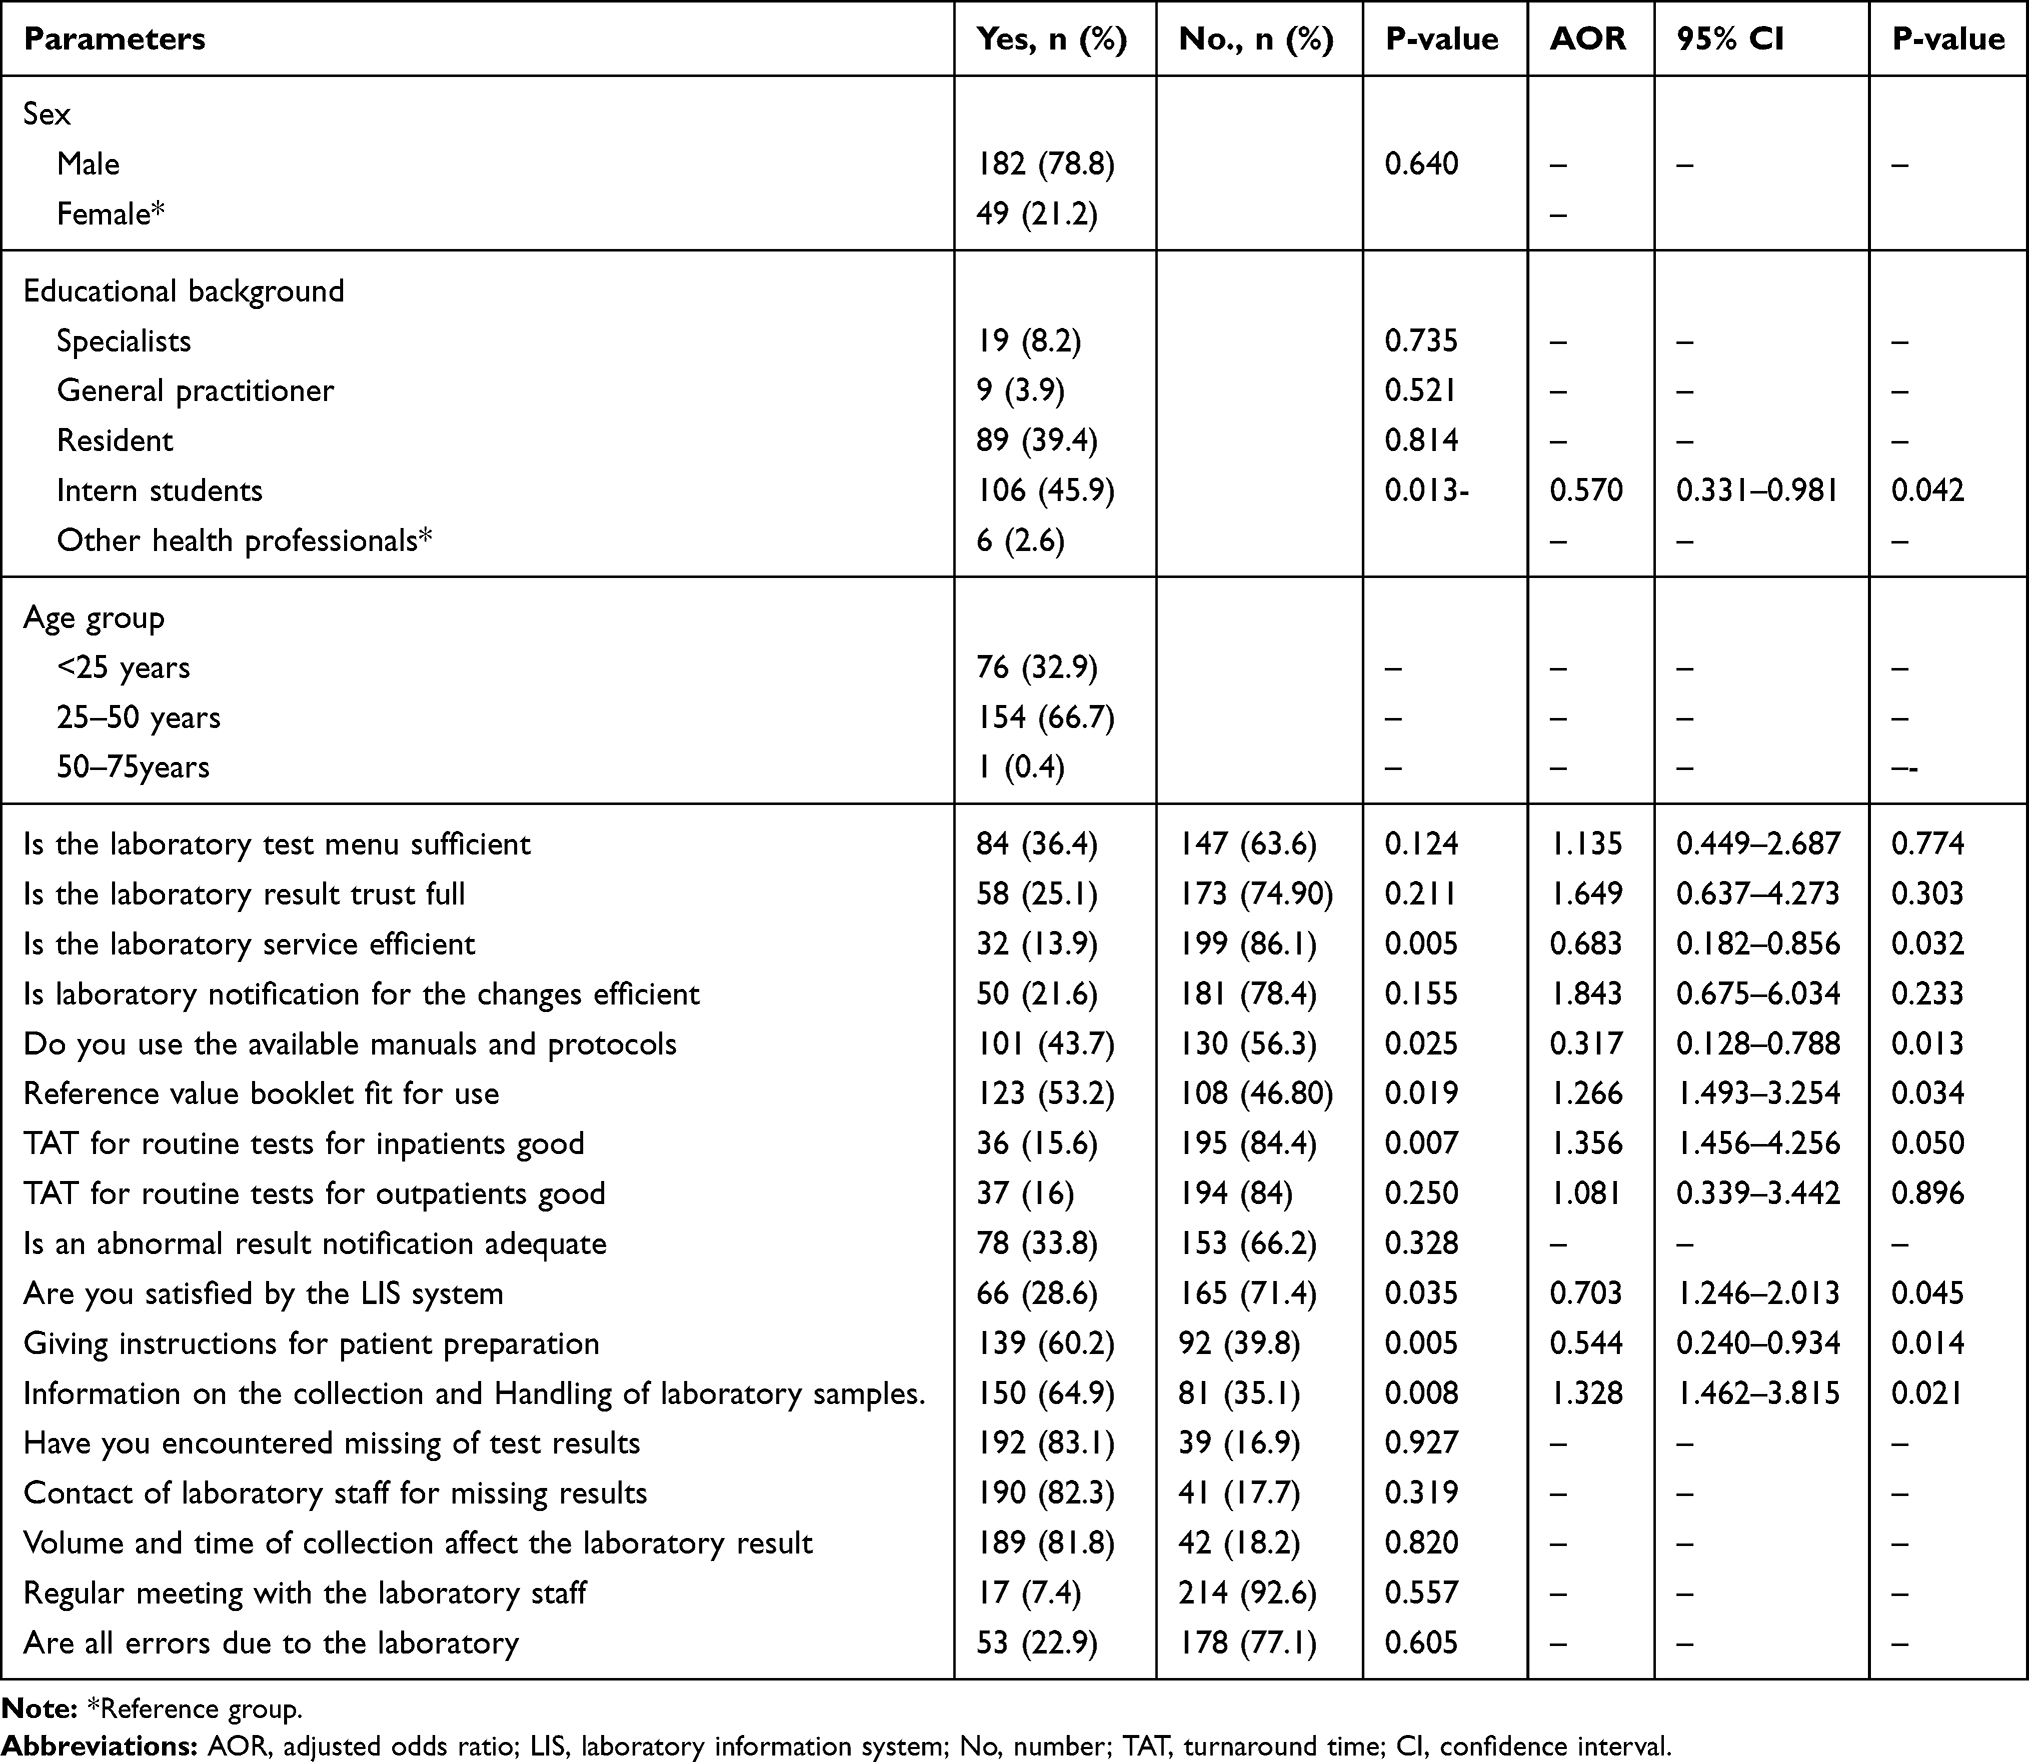 |
Table 3 Sociodemographic Characteristics of Clinical Service Providers and Factors Affecting Laboratory Test Results at Hawassa University Hospital (n=231) |
A total of 184 patients were interviewed to assess their contribution to the errors that occurred in the laboratory during ordering, sample collection, and interpreting laboratory test results. Among these 90 (48.9%) of them were males and 94 (51.1%) were females. By their occupational distribution 37 (20.11%), 36 (19.6%), 45 (24.5%), 22 (12%), 17 (9.2%) 25 (13.6%) and 2(1.1%) were government employee, farmer, merchant, student, daily laborer, housewife and retired, respectively. But, none of these were significantly associated with laboratory test result errors. Of them, 101 (54.9%) and 83 (45.1%) were urban and rural residents, respectively, in this study. Patients from the rural area were significantly associated with the occurrence of laboratory test results errors (AOR=0.724, 95% CI=0.158–0.856, P-0.031).
On the other hand, the frequency of visiting the hospital laboratory was significantly associated with the occurrence of laboratory result errors in the current study. Moreover, patients who were visiting the laboratory once (AOR=0.869, 95% CI=0.315–2.398, P-0.015) and twice (AOR=2.873, 95% CI=1.104–7.454, P-0.030) were significantly associated with the occurrence of laboratory result errors. In the current study, most of the laboratory test errors by patients were believed as 41 (22.3%) were occurred in pre-analytical phase 113 (61.40%) in analytical, and 30 (16.03) were in post-analytical phase (Table 4).
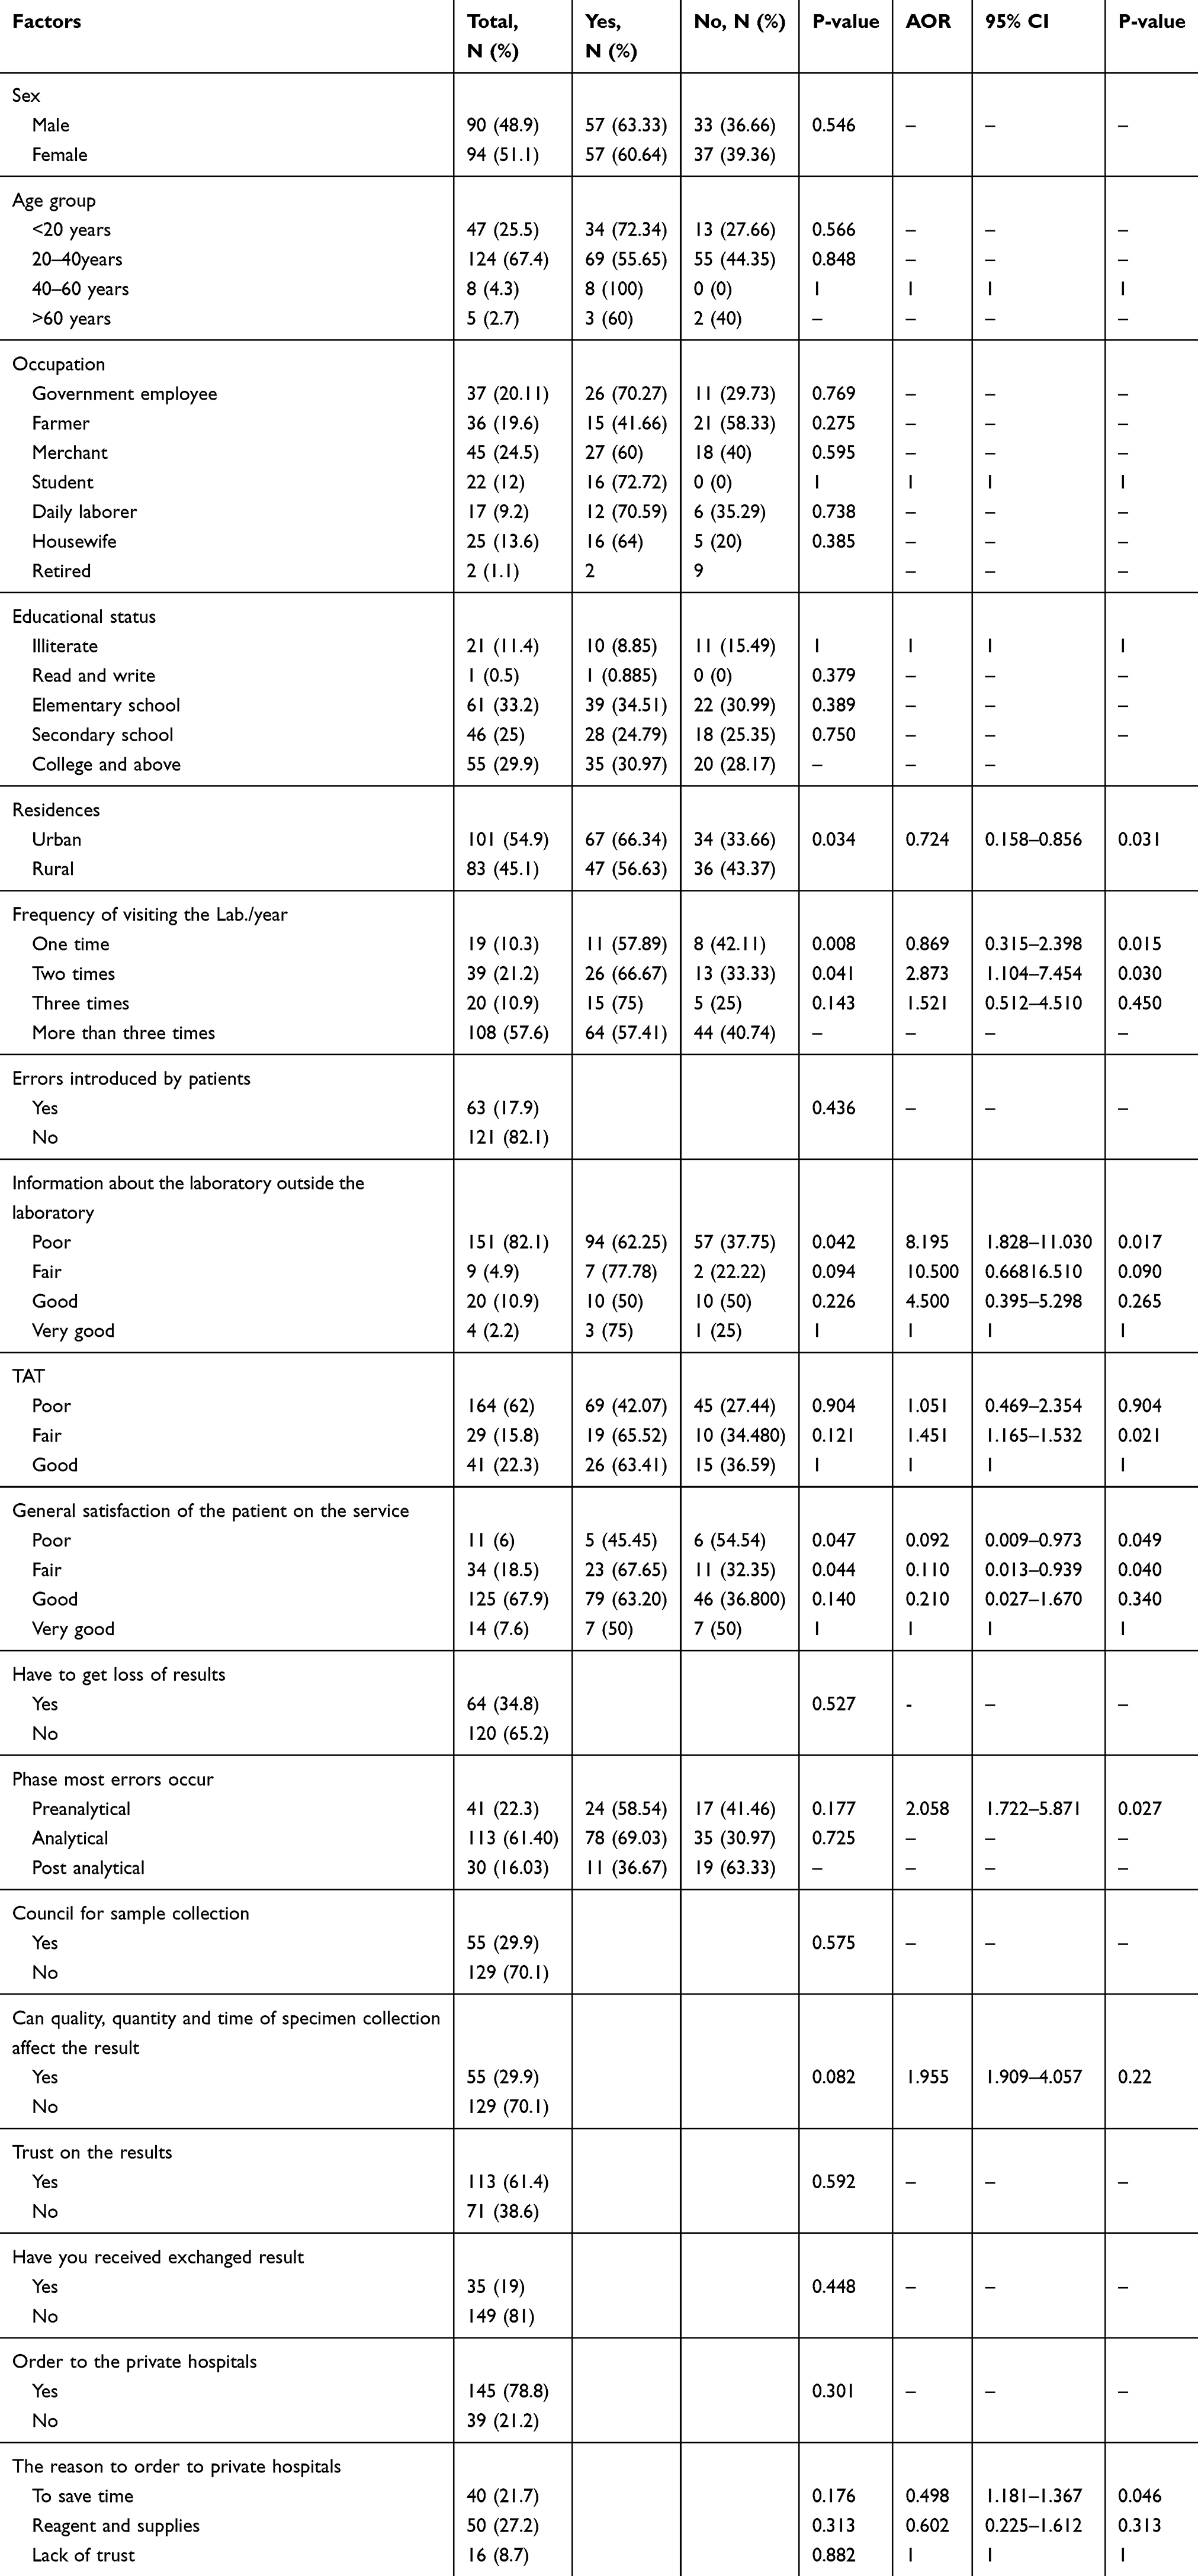 |
Table 4 Sociodemographic Characteristics of Patients and Factors Affecting Laboratory Test Results at Hawassa University Comprehensive Specialized Hospital (n=184) |
Observational assessment on 184 laboratory request papers was done on the completeness of patient information, handling, and sample collection, processing, and reporting using a standard checklist. Of these laboratory requests 161 (87.5%), (12.5 %), (15%) were incomplete with patient clinical diagnosis, gender, and age, respectively (Figure 1).
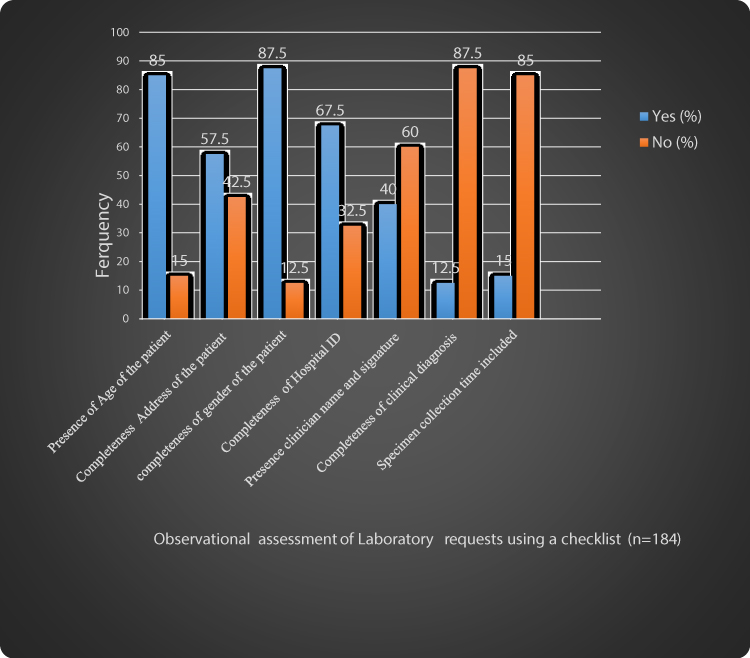 |
Figure 1 Observational assessment of laboratory requests using checklist (n=184). |
But, in bivariate analysis, laboratory requests incomplete with specimen collection time (AOR=3.502, 95% CI=0.602–20.380, P-0.163), name and signature of the physician (AOR=1.196, 95% CI=0.332–4.310, P-0.785) and gender (AOR=2.041, 95% CI=0.184–22.660, P-0.561) of the patient were not statistically associated with the occurrence of laboratory result errors. However, laboratory requests incomplete with address of the patient (AOR =5.917, 95% CI=1.573–25.503, P- 0.017), hospital ID (AOR=0.060, 95% CI=0.011–0.330, P-0.001) and patient clinical diagnosis (AOR=0.151, 95% CI=0.024–0.955, P- 0.045) were significantly associated with the occurrence of laboratory errors in this study (Figure 1).
Discussion
The healthcare structure is increasingly dependent on reliable laboratory results, as part of other healthcare systems, which are prone to errors. Even though numerous studies have been conducted to enhance total laboratory quality, the literature on errors in laboratory results during ordering, handling and testing is scarce and presents several limitations.26 Some important achievements have been made, however; in the last 40 years, there has been a remarkable decrease in error rates, particularly for analytical errors.23 Furthermore, evidence from recent studies demonstrates that a large percentage of laboratory errors occur in the pre- and post-analytical steps.27 Therefore, this study was aimed to assess the laboratory errors and associated factors during ordering, handling, testing, and reporting.
In this study, a total of 455 participants (184 patients with their accompanying request papers, 40 laboratory professionals, and 231 clinical service providers) were included. From a total of 40 laboratory professionals 21 (52.5%) were not satisfied by the result they produce in their laboratory. This finding was higher than the study conducted in Addis Abeba where 75 (35.2%)28 of laboratory professionals believed that their laboratories did not provide quality laboratory results. This could be due to the difference in sample size and the sampling technique of each study.
Most laboratory professionals 32 (80%) believe that TAT was not followed for most laboratory tests performed in the hospital indicating a statistical association with the occurrence of laboratory test errors (AOR=1.844, 95% CI=1.311–2.290, P- 0.037). Lower than this finding was reported from Addis Abeba 70 (32.9%)28 of laboratory results were claimed not to be released within predefined turnaround time. This difference may be due to the difference in sample size, study design, workload, and workflow arrangement difference in the study institutions.
In our study 34 (85%) of laboratory, professionals believed that the purchasing system was one of the contributing factors for the occurrence of laboratory test errors (AOR= 1.246, 95% CI =1.119–6.560, P- 0.001). But, lower than this result was reported from a study conducted in Addis Abeba.28 Thirty-eight (95%) of laboratory professionals point out that lack of sufficient supplies and reagents were factors for the occurrence of laboratory error and a significant association was observed when multinomial logistic regression was used for confounders (AOR=1.174, 95% CI=1.199–6.350, P-0.026). This finding was higher than the study reported in Addis Abeba28 which was indicated to be 64.3% lack of supplies and reagents contributes to the occurrence of laboratory errors.
During the actual observational assessment of laboratory practice by using a checklist, lack of labeling before sample collection (AOR=2.031, 95% CI=1.114–3.636, P −0.017) and use of unmixed blood for testing (AOR=16.340, 95% CI=2.340–17.482, P- 0.049) were significantly associated with the occurrence of laboratory test errors. Comparable results were reported from the study conducted in India29 which showed mislabeling of sample and use of unmixed blood were associated and the most fatal type of laboratory test errors.
In the current study, 21 (52.5%) of laboratory professionals used hemolyzed blood for testing (AOR=1.446, 95% CI=1.073–2.728, P- 0.021) this finding was significantly associated with laboratory test errors. Higher than this finding was reported from Croatia 65%30 and Iran 74.1%.31 Lower than this finding was reported from Iraqi Kurdistan 26%32 of hemolyzed samples were used for analysis.
A total of 231 clinical service providers who requested the laboratory test indicated a lack of efficient laboratory service, unable to use available laboratory manuals, and improper use and interpretation of reference booklets (Table 3) were statistically associated with the occurrence of laboratory result errors. A similar finding was reported from Spain33 that states requesting physicians have to know the basic concepts of testing, that would significantly reduce inefficient test requests and errors in interpretation of laboratory test results.
Intern students were 5.7 times higher than other clinical service providers to introduce laboratory test errors (Table 3). This finding was consistent with the study reported from the United States that indicated “a medical student often leaves the walls of his objectives with a false conception use of the laboratory results”.33 Currently, this problem not only continues but is even becoming more serious. These could be due to the degree of knowledge shown by Intern students regarding the importance of the biological and analytical variability, the reference value theory and the clinical sensitivity and specificity of laboratory test results for an appropriate data interpretation to clinical decision making.34
In our study, the LIS system of the hospital was considered as sources of laboratory result error by clinical service providers (Table 3), Inconsistent, result to our finding was reported from England35 which indicated that using LIMS system was significantly associated with the decrease of the occurrence laboratory test errors.
Clinical service providers believed 178 (77.1%) of laboratory test errors occurred outside the laboratory (preanalytical), whereas only 53 (22.9%) occur inside the laboratory either in (analytical or post-analytical) phases. This finding was in line with the finding from India which accounts for 49.2% pre-analytical, 17.4% analytical, and 33.4% post-analytical.36 But, the inconsistent finding was reported from the United States 78 (60%) of errors occurred inside the laboratory (analytical and post-analytical) and 27 (21%) in pre-analytical phases.37 This difference might be due to the presence of a well-structured laboratory system and the difference in the knowledge status of the study population.
One hundred and ninety-two (83.1%) of clinical service providers were encountered missing laboratory test results, but not statistically associated with the laboratory result errors (Table 3). This report was higher than the finding from the United Kingdom (39%)35 and Northwest Ethiopia 42 (10.7%).38
From a total of 184 patients interviewed to assess their contribution to the errors that occurred in the laboratory during ordering, sample collection, and interpreting, the residence was significantly associated with the occurrence of errors (AOR=0.724, 95% CI=0.158–0.856, P-0.031). Comparable report to our finding was reported from a study at Debre Markos referral hospital, Northwest Ethiopia.38
Frequency of visiting the hospital laboratory once or twice was significantly associated but, those who visited three or more times were not associated with laboratory test errors (Table 4). Consistent results to this finding were reported from Debre Markos referral hospital, Northwest Ethiopia.38 According to the patient, 113 (61.4%) of error has occurred in the analytical phase followed by 41 (22.3%) pre-analytical and 30 (16.03) post-analytical phases. Different findings to this study were reported from India 7.9% analytical, 77.1% preanalytical, and 15% post-analytical errors.39 This difference might be due to the difference in sample size, study design, and health service system structure of the study areas.
A total of 184 laboratory requests were assessed for the completeness of patient-related factors, sample related, and clinical service provider information. Of these requests, 161 (87.5%) were incomplete with patient clinical diagnosis and 12.5% with the gender of the patient (Figure 1). One hundred and fifty-six (85%) of these requests were incomplete with a specimen collection time. Similar findings were reported from Croatia30 in which request forms with missing information about sample collection, patient diagnosis, sample type, and patient unique identification (ID) number could introduce error. But, incomplete requests with address of the patient (AOR =5.917, 95% CI=1.573–25.503, P 0.017), hospital ID (AOR=0.060, 95% CI=0.011–0.330, P- 0.001) and patient clinical diagnosis (AOR=0.151, 95% CI=0.024–0.955, P- 0.045) were significantly associated with laboratory test errors. Findings in line with this result were reported from Croatian study where incomplete with patient diagnosis (33.64%), hospital ID (0.23%), and patient ID (23.54%) (P-0.0001)30 were significantly associated. This study has the following limitations: the evidence of the study would have been enriched if it was supported by the qualitative method. Face-to-face interviews of respondents at the hospital might have exposed the study for social desirability bias.
Conclusion
The prevalence of the occurrence of laboratory test errors in our study is demonstrated by the distribution pattern of the preanalytical, analytical, and post-analytical steps. But changes have occurred in the types and frequencies of errors in these phases of testing by laboratory professionals, clinicians, and patients. Moreover, the high frequency of laboratory errors (77.1%) was suggested to come from the preanalytical phase of the laboratory by clinical service providers, 52.5% of laboratory errors was suggested by laboratory professionals to come from the analytical and preanalytical phase of the laboratory and (61.4%) laboratory error was suggested by patients to come from the analytical phase of the laboratory in this study. Therefore, as laboratory results are an essential component of the health care system, avoiding the gap observed in the above finding by laboratory capacity building and quality management system implementation should be in place to provide quality and reliable laboratory results for disease treatment and prevention.
Furthermore, for clinical health care providers and laboratory professionals training on laboratory guidelines and protocols that include changes in laboratory repertoire, obsolete tests, recommended repetition intervals, or potential interventions and the design of the request form, either in paper or electronic format, has been used as a strategy to manage the occurrence of laboratory errors.
To make patients’ interests are safeguarded and well addressed, there must be a departure from the conventional view of the laboratory, which focuses on the quality activities within the laboratory by thinking out of the box by providing information for the patient on the sample collection procedure (type, time, volume, TAT) and develop the positive communication skill with the patient about the whole process of laboratory testing procedure.
Further studies should be performed on a greater number of cases and in more than one health facility using more-effective methods for detecting errors and trends that contribute additional information on the true frequency, sources, and factors of laboratory errors, thus keeping laboratory service in pace with changes in the new technology, procedures, tests, and effective information.
Abbreviations
SPSS, Statistical Package for Social Sciences; CI, confidence interval; COR, crude odds ratio; AOR, adjusted odds ratio; SOP, standard operational procedure; WHO, World Health Organization; OPD, outpatient department.
Data Sharing Statement
The data that support the findings of this study are available from the corresponding author upon reasonable request with the permission of the University and the corresponding author but not publicly available.
Ethics Approval and Consent to Participate
The study was approved by the Institutional Review Board of Hawassa University, College of Medicine and Health Science (Reference No. IRB/034/11), Date 16/04/2019 signed with Dr. Ayalew Astatkie IRB Chairperson. A permission letter was obtained from the Hospital. The participants enrolled in the study were informed about the study objectives, expected outcomes, benefits, and the risks associated with it. Written consent was taken from the participants before the interview.
Acknowledgments
Authors would like to thank Hawassa University College of Medicine and Health Science for supporting for doing this research, Hawassa University Compressive and Specialized Hospital for permitting to conduct the research, supervisors, data collectors, and study participants.
Author Contributions
All authors made a significant contribution to the work reported, whether that is in the conception, study design, execution, acquisition of data, analysis, and interpretation, or in all these areas; took part in drafting, revising or critically reviewing the article; gave final approval of the version to be published; have agreed on the journal to which the article has been submitted; and agree to be accountable for all aspects of the work.
Disclosure
All authors declare that they have read and approved the manuscript and ensure no competing interests.
References
1. Roberto Verna Adriana BV, Laposata M. Reducing diagnostic errors worldwide through diagnostic management teams. AnnLabMed. 2019;39:121–124.
2. WASPaLM. World Association Of Societies Of Pathology and Laboratory Medicine 63rd Session of the WHO Regional Committee for Europe, Turkey, 16–19 September. 2013. Report.
3. Lippi G, Banfi G, Church S, et al. Preanalytical quality improvement. In pursuit of harmony, on behalf of the European Federation for Clinical Chemistry and Laboratory Medicine (EFLM) working group for preanalytical phase (WG-PRE). Clin Chem Lab Med. 2015;53(3):357–370. doi:10.1515/cclm-2014-1051
4. Lippi G, Becan-McBride K, Behúlová D, et al. Preanalytical quality improvement: in the quality we trust. Clin Chem Lab Med. 2013;51(1):229–241. doi:10.1515/cclm-2012-0597
5. Lippi G, Bassi A, Brocco G, Montagnana M, Salvagno GL, Guidi GC. Preanalytic error tracking in a laboratory medicine department: results of a 1-year experience. Clin Chem. 2006;52:1442–1443. doi:10.1373/clinchem.2006.069534
6. Ducatman BS, Ducatman AM, Crawford JM, Laposata M, Sanfilippo F. The value proposition for pathologists: a population health approach. SAGE. 7;2019.
7. Plebani M, Carraro P. Mistakes in a stat laboratory: types and frequency. Clin Chem. 1997;43(8):1348–1351. doi:10.1093/clinchem/43.8.1348
8. Rana SVS, Boluarte TA, Niessen L. No preanalytical errors in laboratory testing, A beneficial aspect for patients. BMC Public Health. 2012;12:2–7. doi:10.1186/1471-2458-12-2
9. Cadamuro J, Lippi G, Von Meyer A, et al. European survey on preanalytical sample handling–part 1: how do European laboratories monitor the preanalytical phase? On behalf of the European Federation of Clinical Chemistry and Laboratory Medicine (EFLM) working group for the preanalytical phase (WG-PRE). Biochemia Medica. 2019;29:322–333.
10. Lippi G, Chance JJ, Church S, et al. Preanalytical quality improvement: from dream to reality. Clin Chem Lab Med. 2011;49:1113–1126. doi:10.1515/CCLM.2011.600
11. Rynning M, Wentzel-Larsen T, Bolann BJ. A model for an uncertainty budget for preanalytical variables in clinical chemistry analyses. Clin Chem. 2007;53:1343–1348. doi:10.1373/clinchem.2007.086371
12. Tolonen H, Ferrario M, Kuulasmaa K, Project WM. Standardization of total cholesterol measurement in population surveys—pre-analytic sources of variation and their effect on the prevalence of hypercholesterolemia.. Eur J Cardiovasc Prev Rehab. 2005;12:257–267.
13. Wians FH. Clinical laboratory tests: which, why, and what do the results mean? Lab Med. 2009;40:105–113. doi:10.1309/LM404L0HHUTWWUDD
14. Vitoria M, Granich R, Gilks CF, et al. The global fight against HIV/AIDS, tuberculosis, and malaria current status and future perspectives. Am J Clin Pathol. 2009;131:844–848. doi:10.1309/AJCP5XHDB1PNAEYT
15. Nkengasong JN, Nsubuga P, Nwanyanwu O, et al. Laboratory systems, and services are critical in global health: time to end the neglect? Am J Clin Pathol. 2010;134:368–373. doi:10.1309/AJCPMPSINQ9BRMU6
16. Abay Sisay AG, Liknew W. Factors affecting implementation of laboratory quality management system in Addis Ababa public health laboratories, Addis Ababa, Ethiopia. J Trop Dis Public Health. 2019;8(1):343.
17. Yao K, Mckinney B, Murphy A, et al. Improving quality management systems of laboratories in developing countries: an innovative training approach to accelerate laboratory accreditation. Am J Clin Pathol. 2010;134:401–409. doi:10.1309/AJCPNBBL53FWUIQJ
18. Yao K, Maruta T, Luman ET, Nkengasong JN. The SLMTA program: transforming the laboratory landscape in developing countries. Afr J Lab Med. 2014;3. doi:10.4102/ajlm.v3i2.194
19. Nkengasong JN. A Shifting Paradigm in Strengthening Laboratory Health Systems for Global Health: Acting Now, Acting Collectively, but Acting Differently. Oxford, UK: Oxford University Press; 2010.
20. Gershy-Damet G-M, Rotz P, Cross D, et al. The World Health Organization African region laboratory accreditation process: improving the quality of laboratory systems in the African region. Am J Clin Pathol. 2010;134:393–400. doi:10.1309/AJCPTUUC2V1WJQBM
21. Laposata MD, Dighe A. Pre-pre” and “post-post” analytical error: high-incidence patient safety hazards involving the clinical laboratory. Clin Chem Lab Med. 2007;45:712–719. doi:10.1515/CCLM.2007.173
22. Wahls TLC, Cram PM. The frequency of missed test results and associated treatment delays in a highly computerized health system. BMC Fam Pract. 2007;8:32. doi:10.1186/1471-2296-8-32
23. Plebani M. The detection and prevention of errors in laboratory medicine. Ann Clin Biochem. 2010;47(2):101–110. doi:10.1258/acb.2009.009222
24. Wagar EA, Stankovic AK, Raab S, Nakhleh RE, Walsh MK. Specimen labeling errors: a Q-probes analysis of 147 clinical laboratories. Archives of pathology & laboratory medicine. Arch Pathol Lab Med. 2008;132:1617–1622.
25. Zelalem Teklemariam AM, Kedir H, Kabew G, Kabew G. Clients and clinician satisfaction with laboratory services at selected government hospitals in eastern Ethiopia. BMC Res Notes. 2013;6:15. doi:10.1186/1756-0500-6-15
26. Bell DMN, Jones M, Jones M. Improving health care through a redesign. BMJ. 2006;332:
27. Roque R, Henrique H, Aguiar P. Preanalytic errors in anatomic pathology: a study of 10,574 cases from five Portuguese hospitals. Diagnosis. 2015;2(3):181–188. doi:10.1515/dx-2015-0005
28. Eyob Abera Mesfin BT, Belay G, Ashenafi A, Girma V. Factors affecting the quality of laboratory services in health facilities in Addis Ababa, Ethiopia. J Int Fed Clin Chem. 2017;28(3):205–223.
29. Rachna A. Quality-improvement measures as effective ways of preventing laboratory errors. Lab Med Spring. 2014;45:2.
30. Ana-Maria Simundic NN, Vrkic I, Vukasovic I, Vrkic N. The prevalence of preanalytical errors in a Croatian ISO 15189 accredited laboratory. Clin Chem Lab Med. 2010;48(7):1009–1014. doi:10.1515/CCLM.2010.221
31. Cakirca G. The evaluation of error types and turnaround time of preanalytical phase in biochemistry and hematology laboratories. Iran J Pathol. 2018;13(2):173–178. doi:10.30699/ijp.13.2.173
32. Najat D, Szecsi PB. Prevalence of pre-analytical errors in clinical chemistry diagnostic labs in Sulaimani City of Iraqi Kurdistan. PLoS One. 2017;12(1):e0170211. doi:10.1371/journal.pone.0170211
33. Salinas MFE, López-Garrigós M, López-Garrigós M, Leiva-Salinas C. Laboratory test inappropriateness: lessons revisited and clarified in seven questions. J Lab Precis Med. 2018;3:34. doi:10.21037/jlpm.2018.03.10
34. Flores ELM, Leiva-Salinas C, Leiva-Salinas C, et al. The degree of knowledge shown by physicians in relation to the variability of laboratory test results. Clin Chem Lab Med. 2009;47:381–382. doi:10.1515/CCLM.2009.081
35. Michael P, Cornes JA, Pourmahram G, Hazel Borthwick BK, West J, Costelloe SJ. Monitoring and reporting of preanalytical errors in laboratory medicine: the UK situation. Ann Clin Biochem. 2016;53(2):279–284. doi:10.1177/0004563215599561
36. Suprava Patel RN, Sahoo S, Mohapatra E, Mohapatra E. Congruity in quality indicators and laboratory performance. Ind J Clin Biochem. 2018;33(3):341–347. doi:10.1007/s12291-017-0687-9
37. Michael L, Astion M, Kaveh G, et al. Classifying laboratory incident reports to identify problems that jeopardize patient safety. Am Soc Clin Pathol. 2003;120:18–26. doi:10.1309/8U5D0MA6MFH2FG19
38. Belay A, Belay YA. Patient satisfaction with clinical laboratory services and associated factors among adult patients attending outpatient departments at Debre Markos referral hospital, Northwest Ethiopia. BMC Res Notes. 2019;12:517. doi:10.1186/s13104-019-4558-8
39. Binita Goswamia BS, Chawla R, Mallika AV. Evaluation of errors in a clinical laboratory: a one-year experience. Clin Chem Lab Med. 2010;48(1):63–66. doi:10.1515/CCLM.2010.006
 © 2020 The Author(s). This work is published and licensed by Dove Medical Press Limited. The
full terms of this license are available at https://www.dovepress.com/terms
and incorporate the Creative Commons Attribution
- Non Commercial (unported, 3.0) License.
By accessing the work you hereby accept the Terms. Non-commercial uses of the work are permitted
without any further permission from Dove Medical Press Limited, provided the work is properly
attributed. For permission for commercial use of this work, please see paragraphs 4.2 and 5 of our Terms.
© 2020 The Author(s). This work is published and licensed by Dove Medical Press Limited. The
full terms of this license are available at https://www.dovepress.com/terms
and incorporate the Creative Commons Attribution
- Non Commercial (unported, 3.0) License.
By accessing the work you hereby accept the Terms. Non-commercial uses of the work are permitted
without any further permission from Dove Medical Press Limited, provided the work is properly
attributed. For permission for commercial use of this work, please see paragraphs 4.2 and 5 of our Terms.