Back to Journals » OncoTargets and Therapy » Volume 11
Expression of activating transcription factor 5 (ATF5) is increased in astrocytomas of different WHO grades and correlates with survival of glioblastoma patients
Authors Feldheim J ![]() , Kessler AF, Schmitt D, Wilczek L, Linsenmann T, Dahlmann M
, Kessler AF, Schmitt D, Wilczek L, Linsenmann T, Dahlmann M ![]() , Monoranu CM
, Monoranu CM ![]() , Ernestus RI, Hagemann C, Löhr M
, Ernestus RI, Hagemann C, Löhr M
Received 8 June 2018
Accepted for publication 18 October 2018
Published 4 December 2018 Volume 2018:11 Pages 8673—8684
DOI https://doi.org/10.2147/OTT.S176549
Checked for plagiarism Yes
Review by Single anonymous peer review
Peer reviewer comments 2
Editor who approved publication: Dr Arseniy Yuzhalin
Video abstract presented by Jonas Feldheim
Views: 203
Jonas Feldheim,1 Almuth F Kessler,1 Dominik Schmitt,1 Lara Wilczek,1 Thomas Linsenmann,1 Mathias Dahlmann,2,3 Camelia M Monoranu,4 Ralf-Ingo Ernestus,1 Carsten Hagemann,1,* Mario Löhr1,*
1Department of Neurosurgery, Tumorbiology Laboratory, University of Würzburg, Würzburg, Germany; 2Experimental and Clinical Research Center, Charité Universitätsmedizin Berlin and Max-Delbrück-Center for Molecular Medicine in the Helmholtz Association, Berlin, Germany; 3German Cancer Consortium (DKTK), Heidelberg, Germany; 4Department of Neuropathology, Institute of Pathology, University of Würzburg, Würzburg, Germany
*These authors contributed equally to this work
Background: ATF5 suppresses differentiation of neuroprogenitor cells and is overexpressed in glioblastoma (GBM). A reduction of its expression leads to apoptotic GBM cell death. Data on ATF5 expression in astrocytoma WHO grade II (low-grade astrocytoma [LGA]) are scarce and lacking on recurrent GBM.
Patients and methods: ATF5 mRNA was extracted from frozen samples of patients’ GBM (n=79), LGA (n=40), and normal brain (NB, n=10), quantified by duplex qPCR and correlated with retrospectively collected clinical data. ATF5 protein expression was evaluated by measuring staining intensity on immunohistochemistry.
Results: ATF5 mRNA was overexpressed in LGA (sevenfold, P<0.001) and GBM (tenfold, P<0.001) compared to NB, which was confirmed on protein level. Although ATF5 mRNA expression in GBM showed a considerable fluctuation range, groups of varying biological behavior, that is, local/multifocal growth or primary tumor/relapse and the tumor localization at diagnosis, were not significantly different. ATF5 mRNA correlated with the patients’ age (r=0.339, P=0.028) and inversely with Ki67-staining (r=-0.421, P=0.007). GBM patients were allocated to a low and a high ATF5 expression group by the median ATF5 overexpression compared to NB. Kaplan–Meier analysis and Cox regression indicated that ATF5 mRNA expression significantly correlated with short-term survival (t<12 months, median survival 18 vs 13 months, P=0.022, HR 2.827) and progression-free survival (PFS) (12 vs 6 months, P=0.024). This advantage vanished after 24 months (P=0.084).
Conclusion: ATF5 mRNA expression could be identified as an additional, though not independent factor correlating with overall survival and PFS. Since its inhibition might lead to the selective death of glioma cells, it might serve as a potential ubiquitous therapeutic target in astrocytic tumors.
Keywords: glioblastoma multiforme, recurrence, growth pattern, protein and mRNA expression
Introduction
The WHO classifies diffuse astrocytic and oligodendroglial tumors into the following subgroups that can be further divided by their molecular profile: diffuse astrocytoma, anaplastic astrocytoma, glioblastoma (GBM), diffuse midline glioma, oligodendroglioma, and anaplastic oligodendroglioma.1,2 Among these, isocitrate dehydrogenase (IDH) mutant diffuse astrocytoma WHO grade II (low-grade astrocytoma, LGA) are well-differentiated tumors with a comparatively good prognosis.3 However, as the characteristic mutation of IDH1/IDH2 leads to genome-wide changes in DNA methylation, it might represent the initial event in the development of these tumors.4,5 In contrast, GBM with wild-type IDH is representing the most common and aggressive form.3 Approximately 50% of gliomas in adulthood are classified as GBM.6 Their recurrence tends to be the rule, with the relapse even increasing in aggressiveness and resistance to therapy.7 Although recently Osswald et al shed light on molecular mechanisms of local tumor recurrence,8 not much is known about the mechanisms leading to multifocal growth of astrocytic tumors. As astrocytic tumor cells spread wide in the brain of patients with unifocal tumor growth,9 the question of which mechanisms prevent or trigger growth of these single tumor cells arises.
Recently, tumor treating fields have been shown to be a promising new approach to improve GBM therapy.10–12 Nevertheless, the prognosis of GBM patients remains rather unfavorable. With the current standard treatment, consisting of tumor resection, irradiation, concomitant temozolomide (TMZ) chemotherapy, and adjuvant TMZ-treatment, the median patient survival is only 14.6 months.13 Multifocal growth is even more limiting the therapeutical options and thereby the patients’ prognosis.14 Therefore, the identification of new therapeutic targets is highly relevant.
ATF5 is a widely expressed basic leucine zipper protein that has been classified as a member of the activating transcription factor/cAMP response element binding protein family.15,16 At the current state of knowledge, the major physiological role of ATF5 is to suppress the differentiation of neuronal progenitor cells into glia or neurons in the normal brain (NB).17–19 As it has been reported to be overexpressed in several different tumor entities including GBM,16,20 ATF5 could be a potential therapeutic target for a variety of treatment-resistant cancers with highly selective effects.21,22 In GBM cell lines, a reduction of ATF5 activity by application of a dominant negative peptide leads to p53-independent apoptotic cell death in cell culture and in mouse models. However, such interference did not cause any visible effects on NB or cultured astrocytes.21,23,24 Although data concerning ATF5 expression in GBM are available,23,25 data on ATF5 expression in LGA are scarce.26 ATF5 has been shown to be significantly upregulated especially in invasive ductal and invasive lobular breast carcinomas,27 and its overexpression enhances the migratory and invasive behavior of A549 lung carcinoma cells.28 GBM cells are highly migratory and invasive. However, to our knowledge, whether ATF5 might influence the development, time, duration, or localization of local or multifocal relapses of GBM has not been shown. Therefore, we aimed to examine the ATF5 expression in patients’ samples of LGA, GBM, and NB on mRNA and protein level and retrospectively collected clinical data to investigate putative effects of ATF5 expression on tumor growth patterns and the clinical course of the patients.
Materials and methods
Tissue samples and clinical data
Tumor samples were procured from patients treated in the Department of Neurosurgery of the University Hospital Würzburg, Germany. Written informed consent was obtained from the patients for the acquisition of tissue specimens as approved by the Institutional Review Board of the University of Würzburg. NB tissue specimens (n=10) for reference were acquired from patients diagnosed with epilepsy (n=4) and from autopsies of neurologically healthy patients (n=6). In addition, we collected IDH mutant diffuse astrocytomas WHO grade II (LGA, n=40) and GBM (n=79) with different growth patterns at first diagnosis and at relapse. We collected clinical data from 51 patients treated between January 2011 and December 2013 retrospectively (Table 1). The brain tumors were classified by routine histology based on WHO criteria.2 Immediately after removal, half of the respective tissue sample was frozen at −80°C for RNA and DNA analysis and the other half was formalin fixed and paraffin embedded for immunohistochemistry (IHC). Tissue specimens showing an estimated tumor cell content of <80% were excluded. Kaplan–Meier analysis was performed on 42 patients, whose clinical course was fully reconstructable. Six patients diagnosed with multifocal primary tumors that did not match the diagnostic criteria for tumor progress were excluded from the analysis of progression-free survival (PFS). The extent of surgical resection was determined by comparing MRI images obtained before surgery with those obtained within 72 hours after surgery by an experienced neuroradiologist. Complete resection was defined as the absence of residual contrast enhancement on postsurgical MRI. Incomplete resection was specified as residual contrast enhancement of the size of at least one voxel on the T1-weighted image after microsurgical tumor excision.
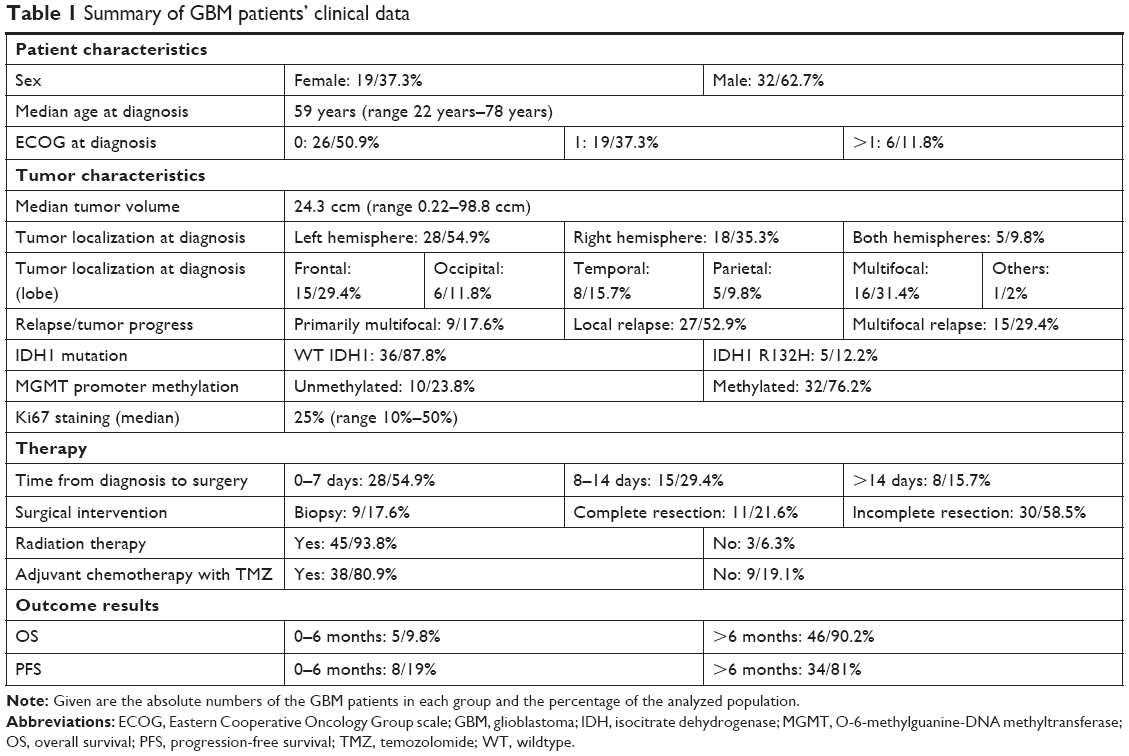 | Table 1 Summary of GBM patients’ clinical data |
The tumor volumes at primary diagnosis were measured using T1-weighted MPRage postcontrast MRIs (MAGNETOM Trio; Siemens, Erlangen, Germany) with DISPImage.29 Regions of interest (ROIs) were created manually on every Digital Imaging and Communications in Medicine (DICOM) image slide to calculate the volume of interest based on ROIs and slice thickness.
RNA and DNA extraction
Total mRNA and genomic DNA from frozen tissue samples were extracted using the TRIzol® Reagent (Thermo Fisher Scientific, Waltham, MA, USA) according to the manufacturer’s instruction. DNA was stored at −80°C for further usage, whereas RNA was subsequently reverse transcribed by using the High Capacity RNA-to-cDNA Kit (Thermo Fisher Scientific). cDNA concentrations were adjusted with distilled water to 5 ng/μL and then stored at −80°C.
Quantitative RT-PCR
About 4 μL cDNA of each sample was analyzed with the StepOnePlus Real-time PCR System by using TaqMan Universal PCR Master Mix, GAPDH_VIC_PL (Hs99999905_m1) as internal control and ATF5_FAM (Hs01119208_m1) (all from Thermo Fisher Scientific) to evaluate the relative ATF5 expression in a duplex setting. PCR was performed for 2 minutes at 50°C, followed by 10 minutes at 95°C and 50 cycles of 15 seconds at 95°C and 1 minute at 60°C. All samples were run in triplicate. In case a standard deviation of 0.5 Ct was exceeded, the PCR was repeated.
Since biopsy- and autopsy-obtained NB tissues displayed a similar mRNA expression, the specimens were analyzed as a combined group.
IHC
IHC was performed to evaluate the IDH1 R132H mutation status, as well as the Ki67 and the ATF5 protein expression of tumor samples. Tumor sections (3 μm) were cut from formalin fixed, paraffin-embedded tissue blocks. Slices were dewaxed twice with xylene and then rehydrated in a graded series of ethanol (100%, 96%, 70%; diluted in distilled water) and in distilled water. Heat-induced epitope retrieval was performed at 120°C in citrate buffer (pH =6.0) for 10 minutes. The slides were treated with 0.7% hydrogen peroxide to eliminate human peroxidase activity, blocked with 10% normal goat serum (Thermo Fisher Scientific) and stained using the mouse anti-IDH1 R132H antibody anti-IDH1 R132H/DIA-H09 (Optistain; Thermo Fisher Scientific) diluted 1:20 in Antibody Diluent (Zytomed Systems, Berlin, Germany), the Ki67 Antibody M7240 (1:800; Dako Denmark A/S, Glostrup, Denmark) and the mouse anti-ATF5 antibody 101-0380 (1:200; Zytomed Systems) using the Envision System HRP DAB (Dako Denmark A/S). The cell nucleus was counterstained using hemalum solution acid according to Mayer (Carl Roth GmbH + Co. KG, Karlsruhe, Germany).
The immunoreaction for IDH1 R132H was scored positive when tumor cells showed a strong cytoplasmic staining. The Ki67 staining was evaluated based on the percentage of cells with a specific positive staining.
For a semiquantitative evaluation of ATF5 protein expression, five representative areas of each sample’s ATF5 immunostaining were photographed using a LEICA DMI 3000 B microscope, LEICA DFC450 camera and LAS V4.5 software (all Leica Microsystems, Wetzlar, Germany) with standardized settings (magnification: 40×; exposure: 25 ms; gain: 1.0×; gamma: 1; otherwise standard settings) and analyzed for staining intensity via the batch processing function of the open source program Fiji.30–32 The macro settings were as follows:
imgName=getTitle();
run(“Colour Deconvolution”, “vectors=[H DAB]”);
selectWindow(imgName+“-(Colour_3)”);
close();
selectWindow(imgName+“-(Colour_1)”);
close();
selectWindow(“Colour Deconvolution”);
close();
selectWindow(imgName+“-(Colour_2)”);
run(“Measure”);
run(“Close All”);
Color deconvolution33 was used to segregate hemalum and 3,3′-diaminobenzidine (DAB) staining. Subsequently, the intensity of the 8-bit DAB pictures was measured, and the mean intensity was converted into OD by the formula OD = log (255/mean intensity).
To minimize the inaccuracy caused by visible areas without tissue or strong background staining, the median OD of each of the five areas was taken for further analysis.
Since DAB does not follow the Beer–Lambert law and therefore there is no linear correlation of the antibody binding and DAB-intensity,34 the specimens were divided into a “high optical density” and a “low optical density” group by the median intensity to minimize the tolerated statistical error.
Methylation-specific high-resolution melting (HRM) analysis
DNA extracted from frozen tumor samples and human controls from the Cell-to-CpG™ Methylated and Unmethylated gDNA Control Kit (Thermo Fisher Scientific) was treated with bisulfite, using the Bisulfite Conversion Kit (Thermo Fisher Scientific), to deaminate unmethylated cytosines into uracil. Then the samples were examined by HRM,35 combining PCR with subsequent melting analyses of the PCR product using the StepOnePlus™ PCR System (Thermo Fisher Scientific) to determine the MGMT promoter methylation status. After bisulfite conversion, the product generated from unmethylated DNA has a relatively lower GC content, compared to the product generated from methylated DNA, and therefore lower melting temperatures. Forward primer 5′-GCGTTTCGGATATGTTGGGATAGT-3′ and reverse primer 5′-CCTACAAAACCACTCGAAACTACCA-3′ were designed based on Adachi et al36 and verified using Methyl Primer Express® software (Thermo Fisher Scientific). Each reaction mixture contained 10 μL Melt Doctor™ HRM Master Mix (Thermo Fisher Scientific), 20 ng DNA template, 5 pM of each primer, filled up with RNase-free water to a total volume of 20 μL. The DNA was amplified under the following conditions: enzyme activation for 10 minutes at 95°C, followed by 45 cycles of 15 seconds at 95°C and 1 minute at 60°C. The PCR concluded with 10 seconds at 95°C, 1 minute at 60°C and the HRM for 15 seconds at 95°C and 15 seconds at 60°C.
Statistical analysis
qPCR data were statistically evaluated based on the 2−ΔΔCt method,37 using the triplets’ median Ct with IBM SPSS Statistics 23 (IBM Corporation, Armonk, NY, USA) and checked for accordance to statistical evaluation considering the mean Ct by the help of ExpressionSuite Software v1.0.3 (Thermo Fisher Scientific). Groups were compared by ANOVA (post hoc: Scheffé Procedure). Primary tumors and subsequent relapses were compared by paired two-sided t-tests. To analyze PFS and overall survival, the patient population was divided by the median ATF5 overexpression (sixfold) into a high expression and a low expression group. Kaplan–Meier analysis (Breslow) was used to identify differences in the long-term survival, whereas short-time survival was analyzed by means of Cox regression. Uni- and multivariate analyses of survival data were performed by applying the Cox proportional hazards model.
Melting curves were analyzed using High-Resolution Melting Software (Thermo Fisher Scientific) and compared with the control samples by calculating the “line of best fit.”
The anti-ATF5-stained specimens’ average optical density of NB (n=8), LGA (n=31), and GBM (n=21) were compared by two-sided unpaired t-tests. Due to the small sample number, subgroup analysis was not performed.
Known prognostic factors were compared regarding their relation to the PFS and the overall survival correlation analysis. To rule out any possible bias, the low-expression and high-expression groups were checked for unequal distribution (all non-parametric tests).
Results
Patient cohort
Tumor specimens of a total of 40 patients with a confirmed LGA WHO grade II and of 79 patients with a confirmed GBM were assessed for ATF5 mRNA expression. Clinical data were collected retrospectively for 51 of the GBM patients treated between January 2011 and December 2013. These patients’ characteristics, details about therapy, and outcome results are summarized in Table 1. Nine of these patients had a primarily multifocal GBM, 27 patients a local primary GBM and local relapse, and 15 patients a local primary GBM and multifocal relapse. We were able to collect tissues from five patients from the local relapses and from one patient from a second relapse; we were even able to analyze tissues from one of the multifocal relapses. Some patients were partially or completely treated in external institutions. In addition, some analyses could not be performed due to a shortage of tumor specimen. Therefore, information about these patients’ chemotherapy (n=4), irradiation (n=3), MGMT promoter methylation status (n=9), IDH mutation (n=10), Ki67 staining (n=3), or extent of tumor resection (n=1) were missing.
Expression of ATF5 in glioma specimen
In comparison with NB, quantitative RT-PCR revealed a sevenfold overexpression of ATF5 mRNA in LGA (P<0.001) and a tenfold overexpression in GBM (P<0.001) (Figure 1A). However, the ATF5 expressions in LGA and GBM were not significantly different.
 | Figure 1 Expression of ATF5 in glioma specimen. |
Since the ATF5 expression in GBM was not only increased but also showed a considerable fluctuation range, it was examined whether GBM with different growth patterns at first diagnosis and relapse showed varying ATF5 expressions (Figure 1B). Yet, this subgroup analysis of GBM primary tumors that lead to local relapse, primary tumors that lead to multifocal relapse and multifocal primary tumors revealed a similar ATF5 expression (P=0.620). The same holds true for primary tumors and their local (P=0.928) or multifocal relapses (P=0.985) (Figure 1B) and for tumors of different localizations (left, right, or both hemispheres: P=0.524; frontal, occipital, temporal, parietal lobe, or multifocal growth: P=0.829). There was no significant correlation between ATF5 expression and Eastern Cooperative Oncology Group (ECOG) scale, tumor volume, or sex (P>0.05), whereas the patients’ age at primary diagnosis and ATF5 mRNA expression showed a non-parametric correlation (r=0.339, P=0.028). Interestingly, the proliferation index as determined by Ki67 staining and ATF5 mRNA expression significantly correlated inversely with each other (r=−0.421, P=0.007) (Table 2).
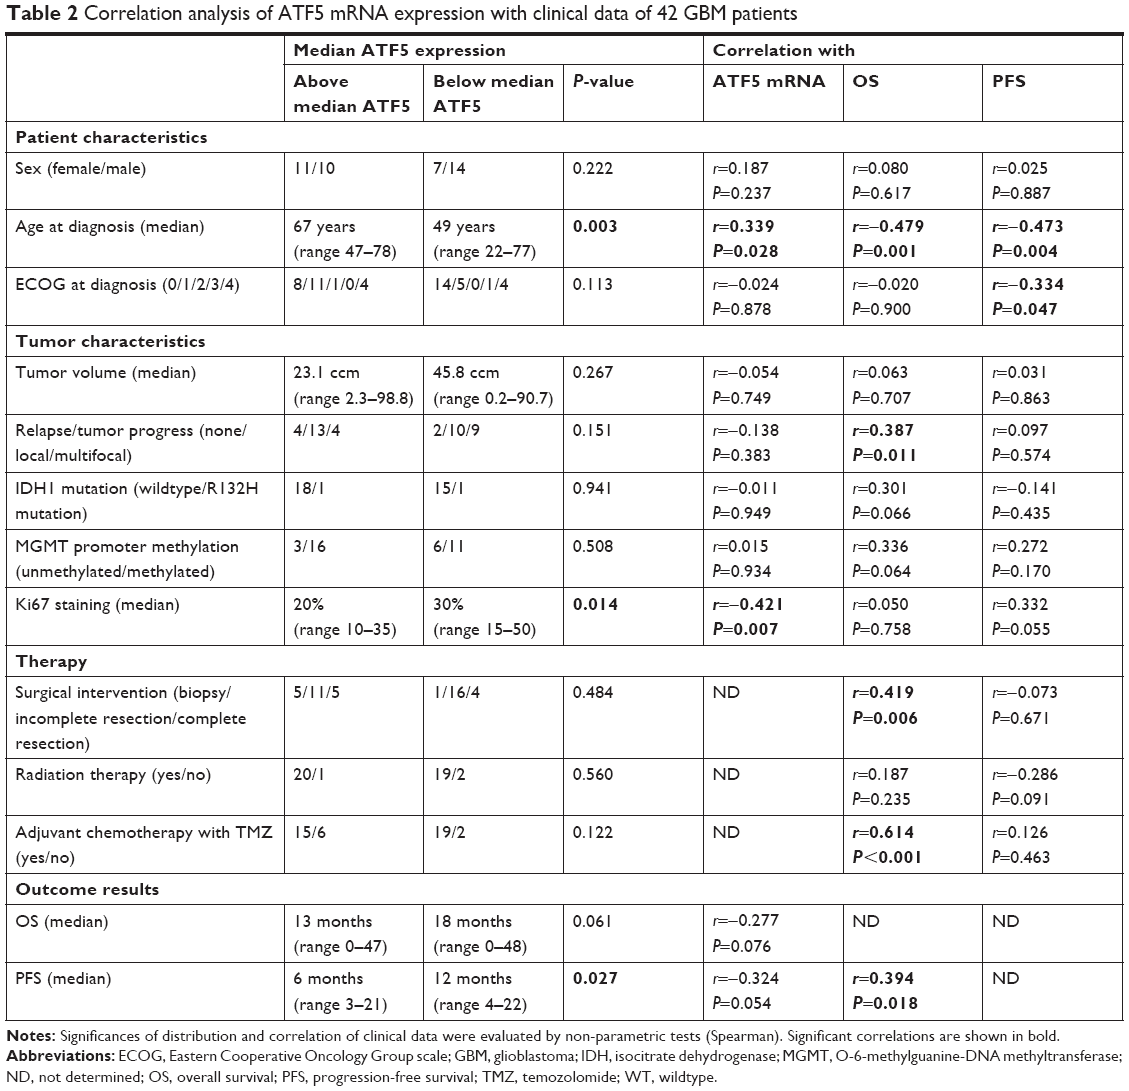 | Table 2 Correlation analysis of ATF5 mRNA expression with clinical data of 42 GBM patients |
To evaluate whether the observed ATF5 mRNA overexpression by GBM compared to NB could also be confirmed on protein level, ATF5 IHC staining has been performed on 8 NB, 31 LGA, and 21 GBM samples (Figure 1C). In NB tissues, solely the neurons, but not the astrocytes, were weakly stained predominantly in the cytoplasm. In contrast, tumor cells displayed strong nuclear staining, that was most pronounced in GBM cells localized in peri-necrotic palisades (Figure 1C). For semiquantitative estimation of protein levels, the OD was measured (Figure 1D). Compared to NB specimens (mean OD 37%), the staining intensity of LGA (mean OD 58%, P<0.001) and GBM (mean OD 57%, P=0.001) was significantly increased, demonstrating ATF5 overexpression in glioma tissue specimens of different WHO grades on protein level. ATF5 protein expression in LGA and GBM was not significantly different (P=0.666).
Kaplan–Meier analysis of GBM patients with high and low ATF5 mRNA expressions at primary surgery
For an assessment of the putative prognostic significance of the ATF5 expression level on the clinical course of the 42 GBM patients with complete clinical data, we divided our patient cohort into two groups (each n=21) based on the median ATF5 mRNA expression at primary surgery. In the first year after diagnosis, a clear division of both survival curves was visible with a significant advantage for the lower expression group (median OS 18 vs 13 months in the high expression group, P=0.022). However, this 6 months gap diminished during the further course and finally vanished after 24 months (P=0.084) (Figure 2A, Tables 3 and 4). A similar result was obtained for the PFS. In the low expression group, the median PFS was 12 months, while the PFS of the high expression group was 6 months (P=0.024; Figure 2B, Table 5).
 | Figure 2 Kaplan–Meier analysis of GBM patients with high and low ATF5 mRNA expressions at primary surgery. |
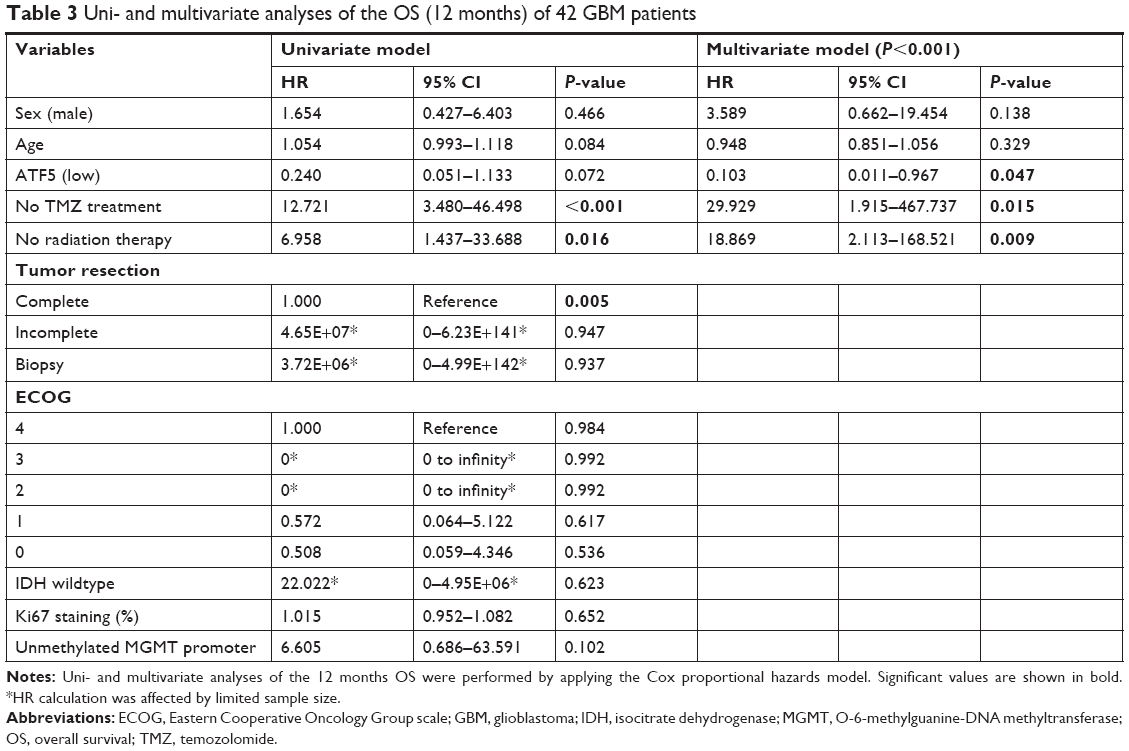 | Table 3 Uni- and multivariate analyses of the OS (12 months) of 42 GBM patients |
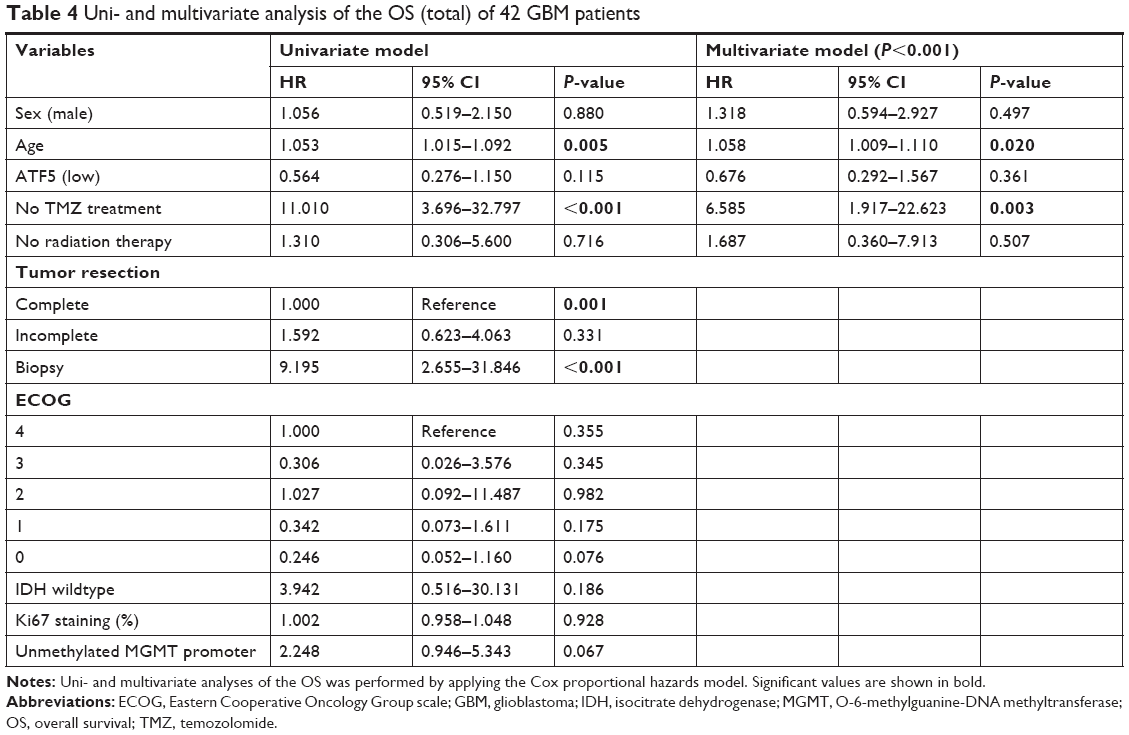 | Table 4 Uni- and multivariate analysis of the OS (total) of 42 GBM patients |
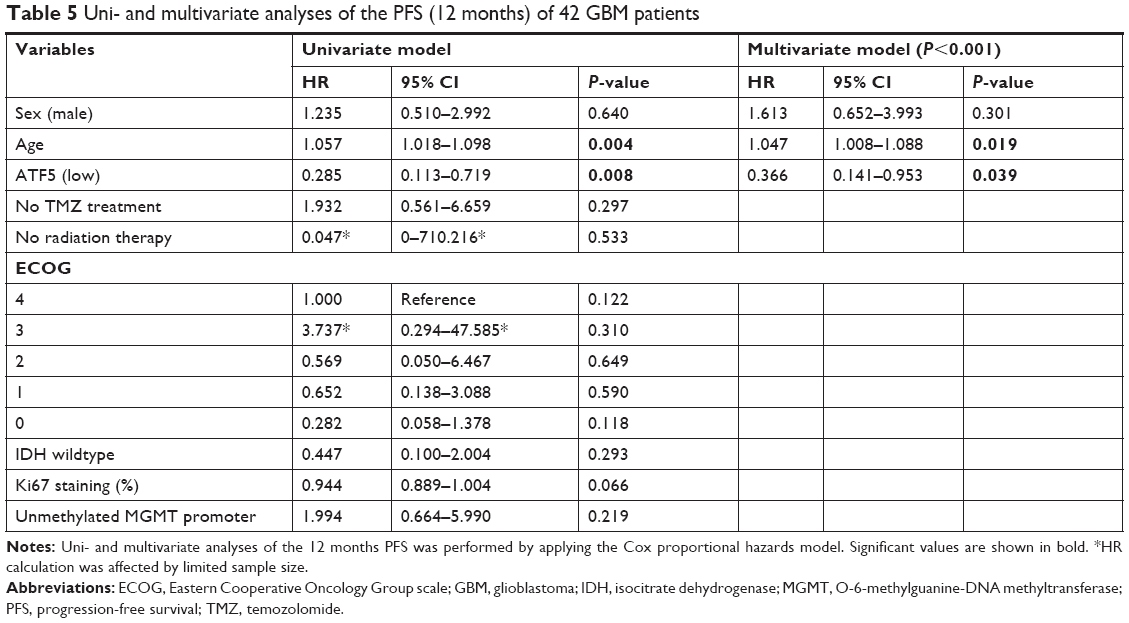 | Table 5 Uni- and multivariate analyses of the PFS (12 months) of 42 GBM patients |
To rule out any bias caused by previously described prognostic factors, correlation analyses were performed for the 42 patients included in the Kaplan–Meier analysis. Not surprisingly, the patients’ age at primary diagnosis correlated significantly with both OS (r=−0.479, P=0.001) and PFS (r=−0.473, P=0.004). The ECOG correlated with PFS (r=−0.334, P=0.047). Furthermore, the extent of resection (r=0.419, P=0.006) and the application of TMZ chemotherapy (r=0.614, P<0.001) correlated with OS (Table 2). However, whereas the ECOG, extent of tumor resection, and treatment with TMZ chemotherapy were almost equally distributed between the high and low ATF5 expression groups, patients in the high expression group were significantly older (P=0.003) and showed a lower Ki67 proliferation index (P=0.014) (Table 2).
Uni- and multivariate analyses of survival data confirmed the ATF5 expression level in the tumors as prognostic, but not independent factor for short-term OS (t<12 months, HR 0.103, 95% CI 0.011–0.967, P=0.047) (Table 3) and PFS (12 months, HR 1.047, 95% CI 1.008–1.088, P=0.019; Table 5).
Discussion
ATF5 is overexpressed in a variety of tumor entities, such as breast, prostate, endometrium, rectal, colon, gastric, lung, pancreas and ovary cancer, thyroid tumors, B-cell chronic lymphocytic leukemia, as well as gliomas.23–25,27,38–40 However, the cohorts underlying the assessment of ATF5 expression in GBM were too small to define clinical subgroups.23,25 Furthermore, reports on LGA are scarce, comprising only few specimens and merging different WHO grades and tumor entities into the same group for further analysis,26 which limits the scientific significance. Therefore, we extended these observations by examining a large panel of 79 GBM, 40 LGA, and 10 NB for ATF5 expression.
Compared to NB, we detected ATF5 protein overexpression in all LGA and GBM analyzed. ATF5 staining was localized to the nuclei of the tumor cells, confirming data published by others.23,24 It was strongest in the peri-necrotic palisades of GBM, which represent the most aggressive parts of malignant gliomas.25 Dong et al microdissected such areas from histological GBM slides to isolate RNA and also found ATF5 to be overexpressed in a microarray screening.25 In our cohort, ATF5 mRNA and protein were clearly overexpressed in astrocytic tumors compared to NB, but there was no statistically significant difference between LGA and GBM. Likewise, the clinical subgroups of primary tumors and relapses with different growth patterns showed similar expression levels. Therefore, we concluded that ATF5 might be ubiquitously overexpressed in astrocytic tumors, independently of their WHO grading. Nevertheless, a striking fluctuation range of ATF5 mRNA expression was detectable in GBM. Thus, we decided to further examine the putative effect of ATF5 mRNA expression strength on the patients’ PFS and OS.
Some reports provide evidence that high ATF5 expression correlates with a poor prognosis in systemic cancer as well as in malignant glioma. In a retrospective analysis of 23 patients with GBM, those with high ATF5 levels in their tumors had a substantially shorter survival than those with low or undetectable ATF5.24 Similar results were found in a microarray expression analysis of 28 GBM patients for differentially regulated genes in peri-necrotic palisades.25 In contrast to these data, we could find a significant difference only in the short-term, but not in the long-term survival of patients categorized into ATF5 mRNA high and low expression groups. However, the above-mentioned studies analyzed only small cohorts of patients and in the latter 18% of the patients were still alive at final analysis. Unfortunately, the authors do not provide Kaplan–Meier plots in their publication.25 Our data suggest that low ATF5 expression is only of temporary advantage for the patients, most probably due to a slower tumor growth. Indeed, high ATF5 expression was significantly correlated with a shorter PFS in our analysis.
ATF5 is discussed to be a prognostic marker for malignant gliomas,23–25,27 and our data support this assumption as well. However, to rule out any bias caused by an unequal distribution of confounding variables, we examined multiple factors that are known to influence GBM prognosis and progress. Whereas ATF5 expression was negatively associated with OS and PFS, ECOG, the extent of tumor resection, and the application of adjuvant chemo- and/or radiation therapy were positively, while the age at primary diagnosis was negatively correlated with OS and PFS (Table 2).
Interestingly, ATF5 expression and the staining intensity of the proliferation marker Ki67 correlated inversely. High ATF5 expression is known to improve cell survival by suppressing apoptotic mechanisms.41 As such expression is also found in neural progenitor cells,17,18 this may indicate that tumor cells with high ATF5 expression might support tumor growth by promoting cell survival and avoiding apoptosis24,42,43 rather than leading to a high proliferation. Nevertheless, Ki67 staining was elevated in GBM samples, although not evenly distributed throughout the slide, thus reflecting the high molecular intratumor heterogeneity of GBM tissues.44
High ATF5 expression correlated with an unfavorable prognosis of GBM patients and a higher age. Since age is known to influence the OS of GBM patients,45 this could mean that ATF5 might not be an independent prognostic marker. This assumption was supported by uni- and multivariate Cox analyses. Nevertheless, its general expression independently of WHO grading or growth pattern of the malignant gliomas and its clear co-correlation with a better PFS and short-term OS in case of low ATF5 expression might make it valuable as a therapeutic target.
The standard therapy of GBM consists of three major parts: tumor excision to decrease the tumor volume,46 radiation for local and chemotherapy for systemic control of tumor growth.47 However, the spectrum of new innovative therapeutic options is quite broad, comprising, among others, various immunotherapeutic approaches,48 targeted therapies,49,50 and alternating electric fields.12,50 The effects of such treatment strategies could probably be augmented by facilitating the susceptibility of tumor cells to apoptotic cell death.
Inhibition of ATF5 activity by a dominant negative ATF5 protein lacking the N-terminal acidic activation and DNA-binding domains, but containing an enhanced bZip-domain, or knockdown of its expression by specific siRNAs, caused marked apoptotic cell death of GBM cell cultures.23,51 In subcutaneous and orthotopic mouse models, such constructs prevent or even eradicate experimental gliomas.23,51 ATF5 expression causes radioresistance of lung cancer cells, and its inhibition might lead to an augmented sensitivity of such cells for irradiation.28 The effect of ABT263 (Navitoclax), a BH3-mimetic, inhibiting Bcl-2/Bcl-xL,52 is also synergistically facilitated by ATF5 inhibition.22 Therefore, a synthetic cell-penetrating dominant negative ATF5 peptide CP-d/n-ATF5-S1 has been developed which proved activity against triple receptor negative breast cancer, prostatic carcinoma, pancreatic cancer, melanoma, non-small-cell lung carcinoma, hematological malignancies, colorectal cancer, and GBM in vitro and in six different animal models.21,22 It can be administered intraperitoneally or subcutaneously, passes the blood–brain barrier at least in mice, has cross-species efficacy, and is stable in human serum.21,22,53 This peptide significantly attenuates tumor growth in vivo by promoting apoptotic cell death of cancer cells but not of astrocytes or other cell types, thereby maintaining NB and tissue integrity.21–23
Conclusion
Thus, ATF5 might be a promising new therapeutic target not only for GBM in addition to the standard therapy, but for malignant gliomas in general, and first clinical trials could be readily available in the near future.
Acknowledgments
We are very grateful to Elisabeth Karl and Siglinde Kühnel (Department of Neurosurgery, University of Würzburg, Würzburg, Germany) for technical assistance. Jonas Feldheim has been supported by the Graduate School of Life Sciences, Würzburg and the Studienstiftung des Deutschen Volkes. This publication was funded by the German Research Foundation (DFG) and the University of Würzburg in the funding program “Open Access Publishing”. The abstract of this paper was presented at the 67. Jahrestagung der Deutschen Gesellschaft für Neurochirurgie (DGNC) 2016 and the 89. Kongress der Deutschen Gesellschaft für Neurologie (DGN) 2016 as conference talks in addition to the 12th Congress of the European Association of Neuro-Oncology (EANO) 2016 and the Brain Tumor Meeting Berlin 2017 as poster presentations, all with interim findings. The presented abstracts were published in the respective abstract books (DGNC: German Medical Science GMS Publishing House, 2016, DocMI.02.08, DOI: 10.3205/16dgnc241; DGN: Abstract book; EANO: Neuro Oncol. 18(Suppl 4), 2016, iv28, DOI: doi.org/10.1093/neuonc/now188.097; Brain Tumor Berlin: Abstract Book). Carsten Hagemann and Mario Löhr share the senior authorship.
Author contributions
All authors contributed to data analysis, drafting or revising the article, gave final approval of the version to be published, and agree to be accountable for all aspects of the work.
Disclosure
The authors report no conflicts of interest in this work.
References
Louis DN, Perry A, Burger P, et al. International Society Of Neuropathology – Haarlem consensus guidelines for nervous system tumor classification and grading. Brain Pathol. 2014;24(5):429–435. | ||
Louis DN, Perry A, Reifenberger G, et al. The 2016 world health organization classification of tumors of the central nervous system: a summary. Acta Neuropathol. 2016;131(6):803–820. | ||
Reifenberger G, Collins VP. Pathology and molecular genetics of astrocytic gliomas. J Mol Med. 2004;82(10):656–670. | ||
Noushmehr H, Weisenberger DJ, Diefes K, et al. Identification of a CpG island methylator phenotype that defines a distinct subgroup of glioma. Cancer Cell. 2010;17(5):510–522. | ||
Xu W, Yang H, Liu Y, et al. Oncometabolite 2-hydroxyglutarate is a competitive inhibitor of α-ketoglutarate-dependent dioxygenases. Cancer Cell. 2011;19(1):17–30. | ||
Schneider T, Mawrin C, Scherlach C, Skalej M, Firsching R. Gliomas in adults. Dtsch Arztebl Int. 2010;107(45):799–807. | ||
Weller M, Cloughesy T, Perry JR, Wick W. Standards of care for treatment of recurrent glioblastoma – are we there yet? Neuro Oncol. 2013;15(1):4–27. | ||
Osswald M, Jung E, Sahm F, et al. Brain tumour cells interconnect to a functional and resistant network. Nature. 2015;528(7580):93–98. | ||
Sahm F, Capper D, Jeibmann A, et al. Addressing diffuse glioma as a systemic brain disease with single-cell analysis. Arch Neurol. 2012;69(4):523–526. | ||
Stupp R, Taillibert S, Kanner AA, et al. Maintenance therapy with tumor-treating fields plus temozolomide vs temozolomide alone for glioblastoma: a randomized clinical trial. JAMA. 2015;314(23):2535–2543. | ||
Hottinger AF, Pacheco P, Stupp R. Tumor treating fields: a novel treatment modality and its use in brain tumors. Neuro Oncol. 2016;18(10):1338–1349. | ||
Mehta M, Wen P, Nishikawa R, Reardon D, Peters K. Critical review of the addition of tumor treating fields (TT Fields) to the existing standard of care for newly diagnosed glioblastoma patients. Crit Rev Oncol Hematol. 2017;111:60–65. | ||
Stupp R, Mason WP, van den Bent MJ, et al. Radiotherapy plus concomitant and adjuvant temozolomide for glioblastoma. N Engl J Med. 2005;352(10):987–996. | ||
Patil CG, Yi A, Elramsisy A, et al. Prognosis of patients with multifocal glioblastoma: a case-control study. J Neurosurg. 2012;117(4):705–711. | ||
Vinson C, Myakishev M, Acharya A, Mir AA, Moll JR, Bonovich M. Classification of human B-ZIP proteins based on dimerization properties. Mol Cell Biol. 2002;22(18):6321–6335. | ||
Greene LA, Lee HY, Angelastro JM. The transcription factor ATF5: role in neurodevelopment and neural tumors. J Neurochem. 2009;108(1):11–22. | ||
Angelastro JM, Ignatova TN, Kukekov VG, et al. Regulated expression of ATF5 is required for the progression of neural progenitor cells to neurons. J Neurosci. 2003;23(11):4590–4600. | ||
Angelastro JM, Mason JL, Ignatova TN, et al. Downregulation of activating transcription factor 5 is required for differentiation of neural progenitor cells into astrocytes. J Neurosci. 2005;25(15):3889–3899. | ||
Mason JL, Angelastro JM, Ignatova TN, et al. ATF5 regulates the proliferation and differentiation of oligodendrocytes. Mol Cell Neurosci. 2005;29(3):372–380. | ||
Sheng Z, Evans SK, Green MR. An activating transcription factor 5-mediated survival pathway as a target for cancer therapy? Oncotarget. 2010;1(6):457–460. | ||
Cates CC, Arias AD, Nakayama Wong LS, et al. Regression/eradication of gliomas in mice by a systemically-deliverable ATF5 dominant-negative peptide. Oncotarget. 2016;7(11):12718–12730. | ||
Karpel-Massler G, Horst BA, Shu C, et al. A synthetic cell-penetrating dominant-negative ATF5 peptide exerts anticancer activity against a broad spectrum of treatment-resistant cancers. Clin Cancer Res. 2016;22(18):4698–4711. | ||
Angelastro JM, Canoll PD, Kuo J, et al. Selective destruction of glioblastoma cells by interference with the activity or expression of ATF5. Oncogene. 2006;25(6):907–916. | ||
Sheng Z, Li L, Zhu LJ, et al. A genome-wide RNA interference screen reveals an essential CREB3L2-ATF5-MCL1 survival pathway in malignant glioma with therapeutic implications. Nat Med. 2010;16(6):671–677. | ||
Dong S, Nutt CL, Betensky RA, et al. Histology-based expression profiling yields novel prognostic markers in human glioblastoma. J Neuropathol Exp Neurol. 2005;64(11):948–955. | ||
Hua XM, Wang J, Qian DM, et al. DNA methylation level of promoter region of activating transcription factor 5 in glioma. J Zhejiang Univ Sci B. 2015;16(9):757–762. | ||
Monaco SE, Angelastro JM, Szabolcs M, Greene LA. The transcription factor ATF5 is widely expressed in carcinomas, and interference with its function selectively kills neoplastic, but not nontransformed, breast cell lines. Int J Cancer. 2007;120(9):1883–1890. | ||
Ishihara S, Yasuda M, Ishizu A, Ishikawa M, Shirato H, Haga H. Activating transcription factor 5 enhances radioresistance and malignancy in cancer cells. Oncotarget. 2015;6(7):4602–4614. | ||
Plummer DL. DispImage: A display and analysis tool for medical images. Rivasta di Neurorad. 1992;5:489–495. | ||
Schindelin J, Arganda-Carreras I, Frise E, et al. Fiji: an open-source platform for biological-image analysis. Nat Methods. 2012;9(7):676–682. | ||
Schindelin J, Rueden CT, Hiner MC, Eliceiri KW. The ImageJ ecosystem: An open platform for biomedical image analysis. Mol Reprod Dev. 2015;82(7–8):518–529. | ||
Schneider CA, Rasband WS, Eliceiri KW. NIH Image to ImageJ: 25 years of image analysis. Nat Methods. 2012;9(7):671–675. | ||
Ruifrok AC, Johnston DA. Quantification of histochemical staining by color deconvolution. Anal Quant Cytol Histol. 2001;23(4):291–299. | ||
van der Loos CM. Multiple immunoenzyme staining: methods and visualizations for the observation with spectral imaging. J Histochem Cytochem. 2008;56(4):313–328. | ||
Gundry CN, Vandersteen JG, Reed GH, Pryor RJ, Chen J, Wittwer CT. Amplicon melting analysis with labeled primers: a closed-tube method for differentiating homozygotes and heterozygotes. Clin Chem. 2003;49(3):396–406. | ||
Adachi J, Mishima K, Wakiya K, et al. O6-methylguanine-DNA methyltransferase promoter methylation in 45 primary central nervous system lymphomas: quantitative assessment of methylation and response to temozolomide treatment. J Neurooncol. 2012;107(1):147–153. | ||
Livak KJ, Schmittgen TD. Analysis of relative gene expression data using real-time quantitative PCR and the 2(-Delta Delta C(T)) Method. Methods. 2001;25(4):402–408. | ||
Barden CB, Shister KW, Zhu B, et al. Classification of follicular thyroid tumors by molecular signature: results of gene profiling. Clin Cancer Res. 2003;9(5):1792–1800. | ||
Mittal AK, Hegde GV, Aoun P, et al. Molecular basis of aggressive disease in chronic lymphocytic leukemia patients with 11q deletion and trisomy 12 chromosomal abnormalities. Int J Mol Med. 2007;20(4):461–469. | ||
Kong X, Meng W, Zhou Z, et al. Overexpression of activating transcription factor 5 in human rectal cancer. Exp Ther Med. 2011;2(5):827–831. | ||
Persengiev SP, Green MR. The role of ATF/CREB family members in cell growth, survival and apoptosis. Apoptosis. 2003;8(3):225–228. | ||
Dluzen D, Li G, Tacelosky D, Moreau M, Liu DX. BCL-2 is a downstream target of ATF5 that mediates the prosurvival function of ATF5 in a cell type-dependent manner. J Biol Chem. 2011;286(9):7705–7713. | ||
Liu DX, Qian D, Wang B, Yang JM, Lu Z. p300-Dependent ATF5 acetylation is essential for Egr-1 gene activation and cell proliferation and survival. Mol Cell Biol. 2011;31(18):3906–3916. | ||
Friedmann-Morvinski D. Glioblastoma heterogeneity and cancer cell plasticity. Crit Rev Oncog. 2014;19(5):327–336. | ||
Stewart LA. Chemotherapy in adult high-grade glioma: a systematic review and meta-analysis of individual patient data from 12 randomised trials. Lancet. 2002;359(9311):1011–1018. | ||
Stummer W, Meinel T, Ewelt C, et al. Prospective cohort study of radiotherapy with concomitant and adjuvant temozolomide chemotherapy for glioblastoma patients with no or minimal residual enhancing tumor load after surgery. J Neurooncol. 2012;108(1):89–97. | ||
Hart MG, Garside R, Rogers G, Stein K, Grant R. Temozolomide for high grade glioma. Cochrane Database Syst Rev. 2013;4:CD007415. | ||
Weller M, Roth P, Preusser M, et al. Vaccine-based immunotherapeutic approaches to gliomas and beyond. Nat Rev Neurol. 2017;13(6):363–374. | ||
Carlsson SK, Brothers SP, Wahlestedt C. Emerging treatment strategies for glioblastoma multiforme. EMBO Mol Med. 2014;6(11):1359–1370. | ||
Domingo-Musibay E, Galanis E. What next for newly diagnosed glioblastoma? Future Oncol. 2015;11(24):3273–3283. | ||
Arias A, Lamé MW, Santarelli L, Hen R, Greene LA, Angelastro JM. Regulated ATF5 loss-of-function in adult mice blocks formation and causes regression/eradication of gliomas. Oncogene. 2012;31(6):739–751. | ||
Tse C, Shoemaker AR, Adickes J, et al. ABT-263: a potent and orally bioavailable Bcl-2 family inhibitor. Cancer Res. 2008;68(9):3421–3428. | ||
York D, Sproul CD, Chikere N, Dickinson PJ, Angelastro JM. Expression and targeting of transcription factor ATF5 in dog gliomas. Vet Comp Oncol. 2018;16(1):102–107. |
 © 2018 The Author(s). This work is published and licensed by Dove Medical Press Limited. The
full terms of this license are available at https://www.dovepress.com/terms
and incorporate the Creative Commons Attribution
- Non Commercial (unported, 3.0) License.
By accessing the work you hereby accept the Terms. Non-commercial uses of the work are permitted
without any further permission from Dove Medical Press Limited, provided the work is properly
attributed. For permission for commercial use of this work, please see paragraphs 4.2 and 5 of our Terms.
© 2018 The Author(s). This work is published and licensed by Dove Medical Press Limited. The
full terms of this license are available at https://www.dovepress.com/terms
and incorporate the Creative Commons Attribution
- Non Commercial (unported, 3.0) License.
By accessing the work you hereby accept the Terms. Non-commercial uses of the work are permitted
without any further permission from Dove Medical Press Limited, provided the work is properly
attributed. For permission for commercial use of this work, please see paragraphs 4.2 and 5 of our Terms.