Back to Journals » Drug Design, Development and Therapy » Volume 9
Exposure–outcome analysis in depressed patients treated with paroxetine using population pharmacokinetics
Authors Kim J ![]() , Woo H, Chun M, Lim S, Kim HD, Na HS, Chung MW, Myung W, Lee S
, Woo H, Chun M, Lim S, Kim HD, Na HS, Chung MW, Myung W, Lee S ![]() , Kim DK
, Kim DK
Received 16 March 2015
Accepted for publication 16 June 2015
Published 16 September 2015 Volume 2015:9 Pages 5247—5254
DOI https://doi.org/10.2147/DDDT.S84718
Checked for plagiarism Yes
Review by Single anonymous peer review
Peer reviewer comments 3
Editor who approved publication: Professor Shu-Feng Zhou
Jung-Ryul Kim,1 Hye In Woo,2 Mi-Ryung Chun,3 Shinn-Won Lim,4 Hae Deun Kim,5 Han Sung Na,5 Myeon Woo Chung,5 Woojae Myung,6 Soo-Youn Lee,1,3 Doh Kwan Kim6
1Department of Clinical Pharmacology and Therapeutics, Samsung Medical Center, Seoul, 2Department of Laboratory Medicine, Samsung Changwon Hospital, Sungkyunkwan University School of Medicine, Changwon, 3Department of Laboratory Medicine and Genetics, Samsung Medical Center, Sungkyunkwan University School of Medicine, Seoul, 4Samsung Advanced Institute for Health Sciences and Technology (SAIHST), Sungkyunkwan University, Seoul, 5Clinical Research Division, Toxicological Evaluation and Research Department, National Institute of Food and Drug Safety Evaluation, Ministry of Food and Drug Safety, Osong, Chungcheongbuk-do, 6Department of Psychiatry, Samsung Medical Center, Sungkyunkwan University School of Medicine, Seoul, Republic of Korea
Purpose: This study investigated population pharmacokinetics of paroxetine, and then performed an integrated analysis of exposure and clinical outcome using population pharmacokinetic parameter estimates in depressed patients treated with paroxetine.
Patients and methods: A total of 271 therapeutic drug monitoring (TDM) data were retrospectively collected from 127 psychiatric outpatients. A population nonlinear mixed-effects modeling approach was used to describe serum concentrations of paroxetine. For 83 patients with major depressive disorder, the treatment response rate and the incidence of adverse drug reaction (ADR) were characterized by logistic regression using daily dose or area under the concentration–time curve (AUC) estimated from the final model as a potential exposure predictor.
Results: One compartment model was developed. The apparent clearance of paroxetine was affected by age as well as daily dose administered at steady-state. Overall treatment response rate was 72%, and the incidence of ADR was 30%. The logistic regression showed that exposure predictors were not associated with treatment response or ADR in the range of dose commonly used in routine practice. However, the incidence of ADR increased with the increase of daily dose or AUC for the patients with multiple concentrations.
Conclusion: In depressed patients treated with paroxetine, TDM may be of limited value for individualization of treatment.
Keywords: exposure–outcome relationship, paroxetine, therapeutic drug monitoring, population pharmacokinetics, NONMEM
Introduction
Paroxetine is a selective serotonin receptor inhibitor (SSRI) for the treatment of patients with psychiatric disorders including major depressive disorder (MDD).1 It is the most potent inhibitor in terms of serotonin transporter binding profile,2,3 and its pharmacokinetic variability was known to be related to the nonlinear hepatic metabolism and genetic polymorphism.4
For MDD patients treated with paroxetine, therapeutic drug monitoring (TDM) was empirically performed to access compliance and achieve better treatment outcome. Some studies suggested the therapeutic reference range of 30–120 μg/L or 20–60 μg/L.5,6 However, TDM of paroxetine, unlike tricyclic antidepressant drugs, is not strongly recommended because of insufficient evidence on expose–outcome relationship.5 Although the relationship between systemic exposure and clinical outcomes of paroxetine was investigated in the last 20 years, consistent results have not been reported. Some studies revealed the relationship between serum concentration and treatment response,7,8 whereas others did not find any obvious correlation.9,10 There were several cases where even a high concentration of paroxetine was associated with a poor response.8,11
While many studies have utilized an intensive sampling strategy to describe the pharmacokinetics of paroxetine, there are few studies that used sparse concentration samples. Only one study has closely investigated the population pharmacokinetics of paroxetine in elderly patients.12 Moreover, a model-based approach has not been used so far to evaluate the relationship between antidepressant exposure and clinical outcome. Most of the studies simply compared paroxetine concentrations between responder and nonresponder instead of developing a model for exposure–response relationship. Population pharmacokinetic/pharmacodynamic modeling can enhance the power to detect potential covariate effects and precisely depict the concentration–response relationship even with sparse concentration data for individuals.13 Therefore, a model-based approach for exposure–response analysis is being widely used in other therapeutic areas.14,15
The objective of this study was to develop a population pharmacokinetic model for paroxetine, and then to perform an integrated analysis of exposure and clinical outcome using parameters estimated in the model in MDD patients treated with paroxetine.
Materials and methods
Subjects
A retrospective study was performed on the TDM data of psychiatric outpatients treated with paroxetine (Handok, Seoul, Republic of Korea) in Samsung Medical Center from 2005 to 2011. Patients were included if they met the DSM-IV diagnostic criteria for MDD or anxiety disorder. This study was approved by the institutional review board of Samsung Medical Center. Data including baseline characteristics, dosage regimen, serum paroxetine concentration, and concomitant medication were collected from medical record. Serum paroxetine concentrations below lower quantification limit were excluded for further analysis. A total of 271 steady-state concentration data were analyzed from 127 Korean subjects. Baseline subject characteristics are summarized in Table 1. Dosage regimens of paroxetine were given once a day in all but one subject, where it was given twice a day. There were no subjects taking any drug known to significantly affect the pharmacokinetics of paroxetine, and no subjects with MDD treated with adjunctive psychotherapy.
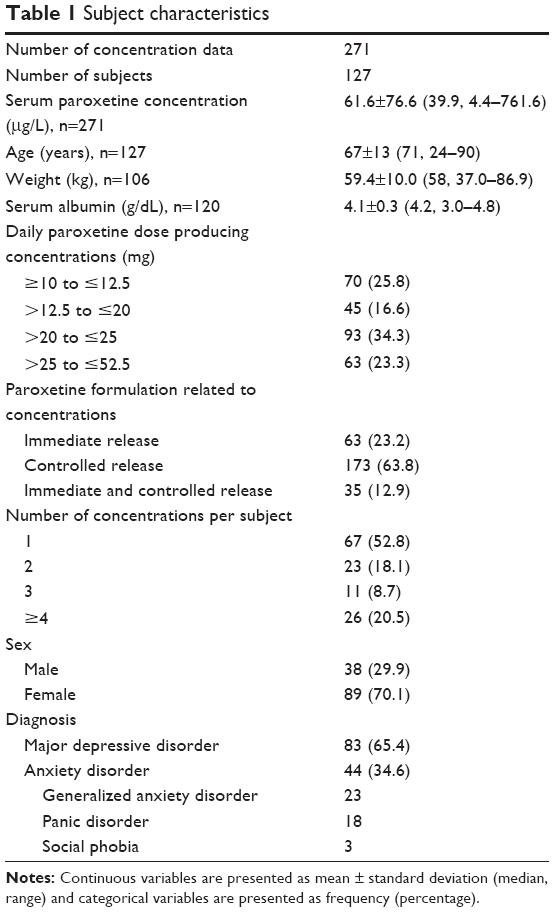 | Table 1 Subject characteristics |
Determination of paroxetine concentration
Serum paroxetine concentrations were measured by high performance liquid chromatography (HPLC)-tandem mass spectrometry. Analyses were performed on an API 4000 tandem mass spectrometer (Applied Biosystems, Foster City, CA, USA) equipped with an Agilent Technologies Series 1200 HPLC system (Agilent Technologies, Santa Clara, CA, USA). The column used was a Cadenza (2.1×150 mm, 5 μm). The mobile phases A and B were water with 2 mM ammonium acetate and acetonitrile, respectively, both containing 0.1% formic acid. After simple protein precipitation with ZnSO4, the serum samples were mixed with an internal standard, bromperidol, and centrifuged for 4 minutes at 15,000 rpm. Quantitative analysis was performed in multiple reaction monitoring mode (m/z 330.0→192.2 for paroxetine; 422.0→165.1 for bromperidol) with a total running time of 180 seconds for each sample. The linear assay range was 5–300 μg/L (r2>0.99). Intra-day and inter-day coefficients of variation were less than 10%.
Population pharmacokinetic model
The serum concentration data for paroxetine were described by a one-compartment model with first-order absorption kinetics, using the nonlinear mixed-effects modeling (NONMEM) program.16 The first-order conditional estimation method with interaction option was used. The model was developed based on the following assumptions: paroxetine was absorbed without a lag time and was eliminated only from the central compartment; paroxetine was administered at regular intervals of 12 or 24 hours; a blood sample for the paroxetine concentration was drawn just before paroxetine administration; pharmacokinetic parameters were held constant over time; the absorption rate constant of controlled release formulation of paroxetine is the same as immediate release formulation, but its relative bioavailability is 0.67 based on the product monograph of paroxetine.17 Interindividual variability (IIV) was modeled exponentially, and additive error model with log-transformed data was selected for residual error variability. For visual clarity, 24-hour nominal time interval was used instead of actual time measured.
The effect of the following covariates on pharmacokinetic parameters was evaluated: diagnosis, age, body weight, serum albumin concentration, and sex. Continuous covariates were centered at the median values and were included in the model using power function. For instance, the clearance of paroxetine was modeled using CL=θ1*(covariate/median)θ2, where θ1 is the clearance for an individual with the median value for the covariate and θ2 is a coefficient representing the relationship between the covariate and CL. Categorical covariates were incorporated using indicator variables. Parameter was separately estimated in some subjects with missing covariates, and was imputed to population-typical value only in case of insignificant difference.
Assessment of clinical outcome
Clinical outcome in patients with MDD was evaluated based on the treatment response and adverse drug reaction (ADR) collected from medical records. Patients received monotherapy for 6 weeks with paroxetine. Dose titration was completed within 2 weeks. For insomnia at bedtime, lorazepam of 0.5–1 mg was allowed. A minimum baseline 17-item Hamilton Rating Scale for Depression (HAM-D) score of 15 was required. No patient had received psychotropic medication in the current episode. Exclusion criteria were pregnancy, significant medical conditions, abnormal baseline laboratory values, unstable psychiatric features (eg, active suicidal risk – only one patient was excluded for this reason), history of alcohol or drug dependence, seizures, significant head trauma, neurologic illness, or concomitant Axis I psychiatric disorder (schizophrenia, bipolar disorder, primary diagnoses of adjustment disorder, or anxiety disorder). All patients were non-delusional. Treatment response was assessed using the 17-item HAM-D by a single trained rater every 2 weeks as a routine clinical evaluation.18 The rater was blinded to the paroxetine concentration. Responders were defined as at least 50% decrease in the HAM-D score at 6 weeks from baseline.19 For assessment of ADR, the Udvalg for Kliniske Undersogelser scale was measured at weeks 0, 1, 2, 4, and 6.20
Analysis of exposure and clinical outcome
Exposure–clinical outcome analysis was performed in subjects who had paroxetine concentration data and clinically relevant measures available. Subjects were divided into groups based on the daily dose and area under the concentration–time curve (AUC). AUC was calculated as AUC = daily dose/CL, based on each subject’s daily dose, and individual CL estimated from the final population pharmacokinetic model. Comparison of clinical outcome among different exposure groups was performed using a chi-square test. In addition, a logistic model was used to describe the probability of being a responder or experiencing ADR as a function of the paroxetine exposure: logit(P) = θ0 + θ1*log(exposure), where P denotes the probability of interest, logit(P) is the natural logarithm of P/(1-P), and θ0 and θ1 are the coefficients of the logistic regression. The logistic analysis was also performed using NONMEM with first-order estimation method with the likelihood options.
Model selection and evaluation
The goodness of fit for the model comparison was determined by the visual inspection of scatter plots and the objective function value (OFV). The comparison between two nested models was performed based on the likelihood ratio test in which the difference in OFV is approximately chi-square distributed. The change in the OFV more than 6.63 (corresponding to P-value less than 0.01 in chi-square distribution with 1 df) was considered as significant. The logistic model was evaluated through nonparametric bootstrap analysis.21 One thousand bootstrap datasets were generated from the original dataset, resulting in 95% confidence intervals for the probability curve. For visual comparison, the frequencies of clinical outcome data for the groups were superimposed over the estimated probability curve.
Results
Population pharmacokinetics
One compartment model with first-order absorption was developed for serum concentrations of paroxetine. Although there is a tendency where low concentrations were overpredicted and high ones were under-predicted, residuals are evenly distributed approximately zero (Figure 1). As observations per subject were not enough to independently estimate pharmacokinetic parameters, some parameters were fixed to the values reported in previous studies: apparent volume of distribution of 1,020 L corresponding to 17 L/kg for a subject with body weight of 60 kg and absorption rate constant of 0.908 h−1.1,22 IIV was included only on apparent clearance (CL/F), reducing the residual error variability expressed as coefficient of variation by approximately 15%. Inclusion of other IIVs did not further improve model fitness. Daily dose administered at steady-state had a significant effect on CL/F, decreasing OFV by 7.5.
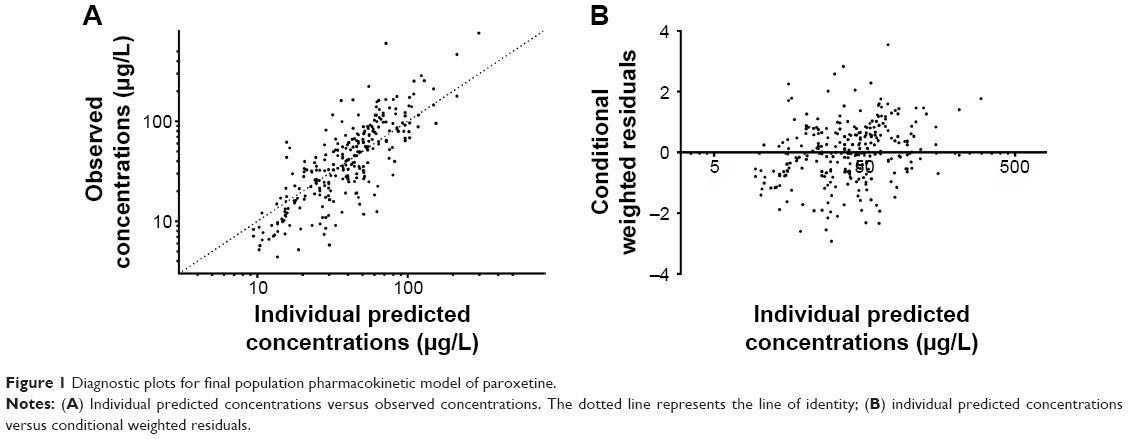 | Figure 1 Diagnostic plots for final population pharmacokinetic model of paroxetine. |
While covariate effect of age on apparent clearance was significant, the difference in OFV for the inclusion of body weight and serum albumin concentration and also exclusion of sex did not reach the predefined significance level (−1.53, −6.35, and 5.13, respectively). Moreover, pharmacokinetic parameters in subjects with MDD were not different from those in subjects with anxiety disorder. The final pharmacokinetic parameter estimates are shown in Table 2.
 | Table 2 Population pharmacokinetic parameter estimates of paroxetine |
Clinical outcome
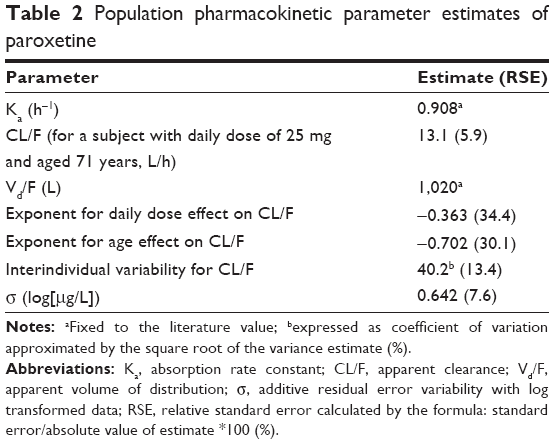
Overall treatment response rate to paroxetine treatment was 72%, and the incidence of ADR was 30%. The proportion of subjects who maintained favorable response to treatment was not different according to exposure groups based on AUC as well as daily dose. Furthermore, the incidence of ADR was not associated with exposure predictors (Table 3). The logistic models for exposure–outcome analysis provided an adequate fit to treatment response data and ADR profile. Figure 2 depicts the predicted median probability curves and its bootstrapped 95% confidence intervals for clinical outcome as a function of exposure. The observed frequency of treatment response or ADR for each group was consistent with the probability curve. The population parameter estimates for exposure–outcome analysis are listed in Table 4. The logistic analysis showed that all the bootstrapped 95% confidence intervals of slope coefficient contain zero, indicating that any exposure predictor was not statistically meaningful for clinical outcome of paroxetine.
 | Table 3 Relationship between exposure (daily dose or AUC calculated using estimate from population pharmacokinetic model) and clinical outcome in patients with major depressive disorder |
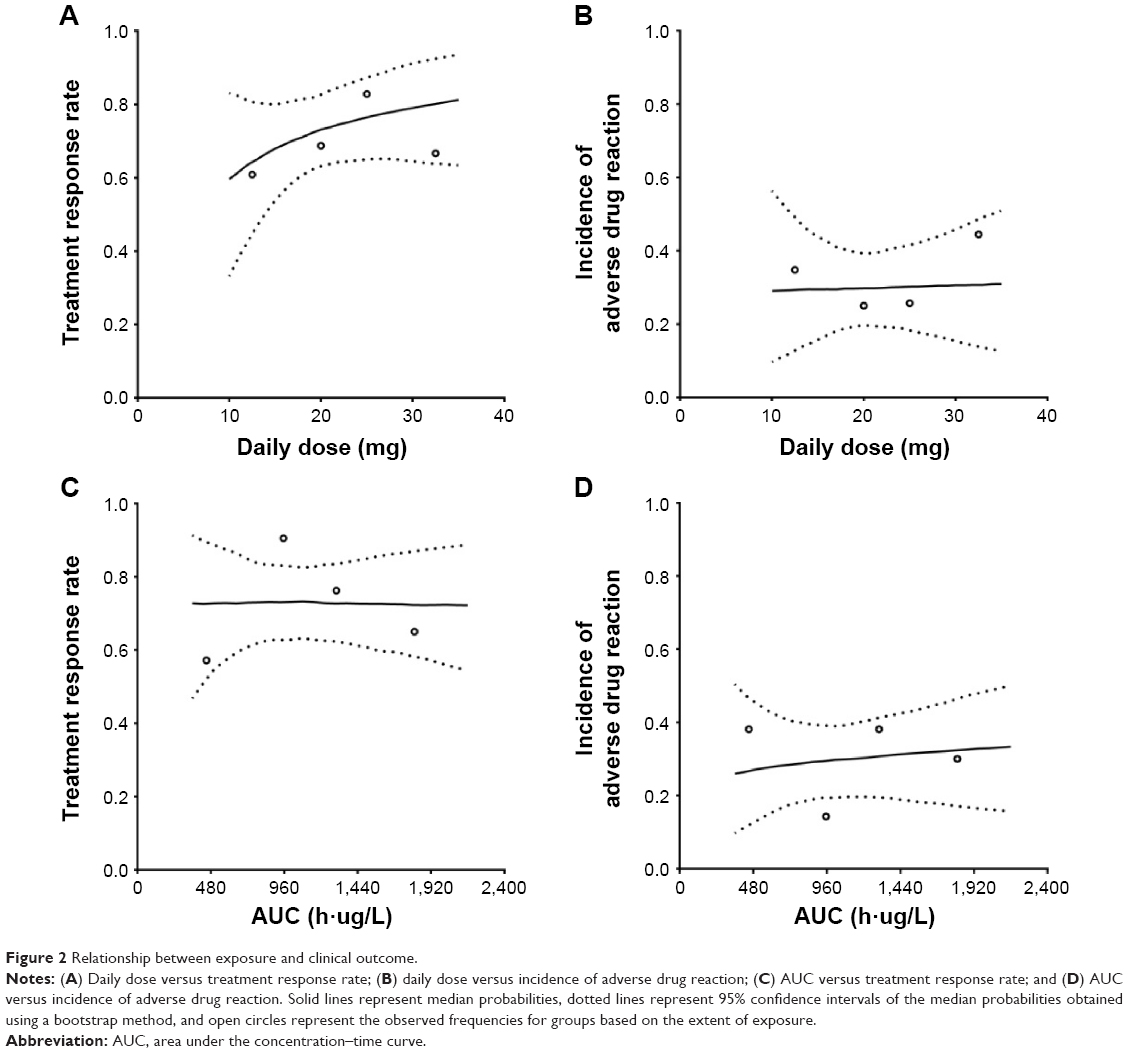 | Figure 2 Relationship between exposure and clinical outcome. |
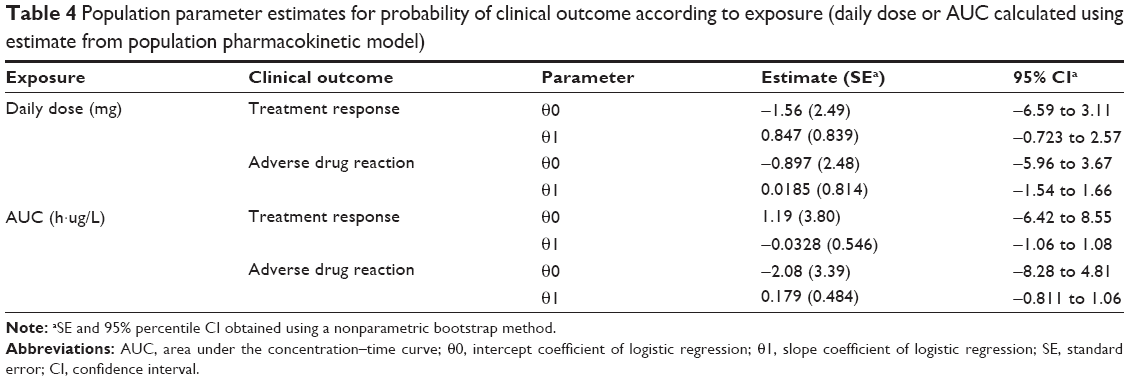 | Table 4 Population parameter estimates for probability of clinical outcome according to exposure (daily dose or AUC calculated using estimate from population pharmacokinetic model) |
We further analyzed the data from subjects who had two or more serum paroxetine concentrations, because more reliable pharmacokinetic parameters can be estimated by using concentration data repeatedly measured in the same subjects. The predicted probability curves distinctly showed that ADR was observed more frequently in the higher exposure group compared with the lower exposure group among those subjects (Figure 3).
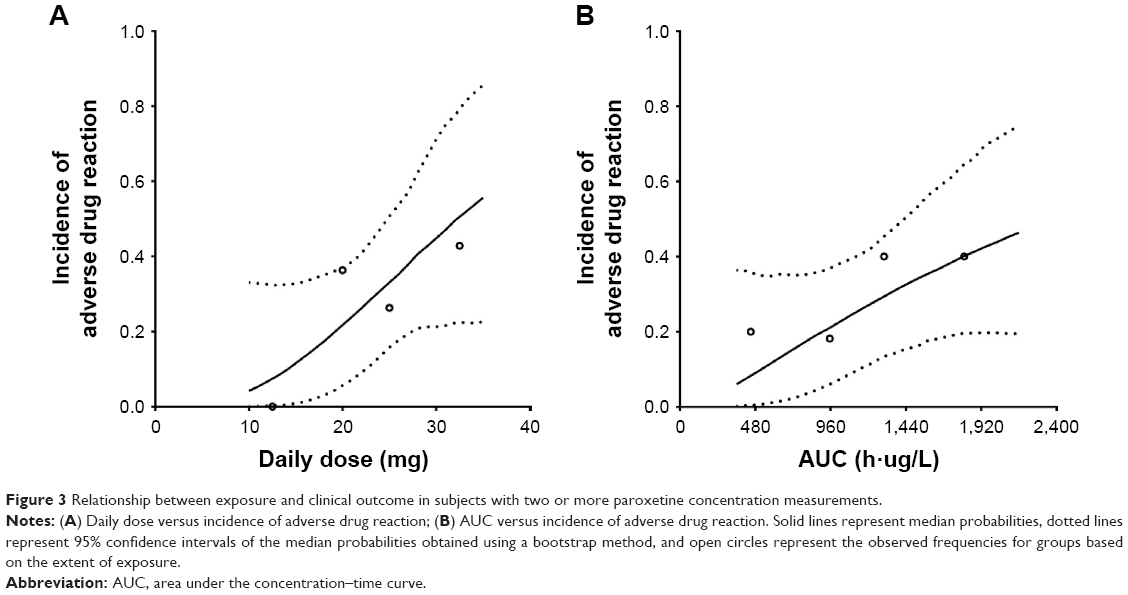 | Figure 3 Relationship between exposure and clinical outcome in subjects with two or more paroxetine concentration measurements. |
Discussion
The population pharmacokinetic model developed here provided a modest fit to serum concentrations of paroxetine at steady-state. This study clearly showed that CL/F of paroxetine was decreased with increasing daily dose. Previous study has developed the population pharmacokinetic model for paroxetine with Michaelis–Menten type elimination.12 The nonlinear kinetics of paroxetine has been well known, which is due to the decrease in intrinsic clearance by saturation of elimination mechanism4,23 and also partly due to time-dependent metabolism by auto-inactivation of cytochrome p450 2D6 enzyme (CYP2D6).22 Although these complex models were not tested because of sparse observations per subject, it was shown in this study that paroxetine was eliminated through dose-dependent process.
Covariate analysis revealed that CL/F was lower in elderly subjects compared with younger subjects. This is in line with the previous study reporting that the median serum paroxetine concentration was higher in elderly patients compared with younger patients.24 Previous population pharmacokinetic analysis showed that age did not affect paroxetine disposition; however, the study population was limited to the elderly whose age range is narrow.12
Collecting information on daily dose or measuring trough serum concentration is commonly used to determine drug exposure. However, daily dose is poorly associated with systemic exposure because of pharmacokinetic variability, and a single concentration is also not sufficient to provide an accurate measure of exposure.13 Therefore, individual-specific parameter, AUC, calculated using estimate from population pharmacokinetic model was used as a predictor of paroxetine exposure in this study.
In this study, no genetic polymorphism related to the pharmacokinetics or the clinical outcome of paroxetine was investigated. CYP2D6 genetic polymorphism is well known for the major determinant of pharmacokinetic variability of paroxetine. Determining this genotype may be helpful to obtain more precise pharmacokinetic parameters and also to verify whether unusual serum concentration was attributed to noncompliance. However, there is a case where phenotype did not answer to genotype because of unidentified genetic polymorphism affecting pharmacokinetics. Additionally, genetic polymorphism in itself did not fully reflect time-dependent change in pharmacokinetics as well as the consequence of drug–drug interaction. Therefore, it is more desirable to measure serum concentration rather than to only collect information on daily dose for prediction of exposure in a situation where CYP2D6 genetic polymorphism was not identified. As for treatment response to paroxetine, significant genetic associations were reported relating to serotonin transporter, serotonin receptor, and ATP-binding cassette transporter.25–27 Lack of such genetic information may lead to situations where one subject is classified as a responder, but the other as a nonresponder, even though their serum paroxetine exposures are similar.
The clinical outcome of paroxetine in MDD was not associated with paroxetine AUC. The previous studies have also failed to observe concentration dependence for SSRIs.9,28,29 This is partly due to the binding property of paroxetine. A single-photon emission-computed tomography study demonstrated that the increase of serotonin transporter occupancy was not observed as escalating paroxetine dose.30 Moreover, there are several possibilities. The individual pharmacokinetic parameters for an exposure predictor may not be estimated precisely in subjects with only one concentration measurement. This is inferred from the result that more paroxetine exposure was distinctly associated with a higher incidence of ADR in subjects with multiple concentration data. Additionally, because a selection bias is usually introduced in the retrospective data collection, some subjects for whom treatment with paroxetine is ineffective, but tolerable in spite of increasing daily dose may be included. It is also reported that only 43% of patients were adherent to antidepressant treatment,31 resulting in the higher rate of noncompliance due to side effects, particularly in the highest group of exposure. The varying degrees of treatment adherence and insufficient information about clinical outcome may lead to a decreased ability to find the evident relationship or to a biased interpretation between exposure and clinical outcome.
Recently, therapeutic reference range of 20–60 μg/L was suggested for plasma concentrations of paroxetine in patients with MDD.6 In this study, its positive predictive value was 78.9% for treatment response, indicating that this suggested range did not provide any meaningful predictive value given overall treatment response of 72%. However, mean AUC higher than 1,800 h·μg/L, corresponding to average concentration of 75 μg/L (1,800 divided by 24, approximately 58 μg/L as trough concentration), was associated with incidence of ADR higher than 40% in subjects with multiple concentration data.
This study has several limitations. Most of all, its retrospective design should be taken into consideration. Both serum paroxetine concentration and clinical outcome were not measured simultaneously, and thus there is a possibility that we did not observe distinct relationship between exposure and outcome. Moreover, the response rate of our data was relatively high compared with a general clinical trial of antidepressants. We included only the patients with serum paroxetine concentration and allowed co-medication. The selection bias and naturalistic design could be a reason for high response rate in this study.
Conclusion
The integrated exposure–outcome analysis with population pharmacokinetics showed that neither daily dose nor AUC was a deterministic predictor of treatment response and ADR in the range of dose commonly used in routine practice for MDD patients treated with paroxetine. TDM may have limited utility for individualization of treatment, while it is helpful in checking noncompliance.
Acknowledgments
This research was supported by a grant (No 11182KFDA657) from Korea Food and Drug Administration in 2011. This study was also supported by a grant of the Korea Health Technology R&D Project, Ministry of Health and Welfare, Republic of Korea (A110339, HI14C1731).
Disclosure
The authors report no conflicts of interest in this work.
References
Wagstaff AJ, Cheer SM, Matheson AJ, Ormrod D, Goa KL. Paroxetine: an update of its use in psychiatric disorders in adults. Drugs. 2002;62(4):655–703. | ||
Owens MJ, Morgan WN, Plott SJ, Nemeroff CB. Neurotransmitter receptor and transporter binding profile of antidepressants and their metabolites. J Pharmacol Exp Ther. 1997;283(3):1305–1322. | ||
Meyer JH, Wilson AA, Sagrati S, et al. Serotonin transporter occupancy of five selective serotonin reuptake inhibitors at different doses: an [11C]DASB positron emission tomography study. Am J Psychiatry. 2004;161(5):826–835. | ||
Sindrup SH, Brosen K, Gram LF. Pharmacokinetics of the selective serotonin reuptake inhibitor paroxetine: nonlinearity and relation to the sparteine oxidation polymorphism. Clin Pharmacol Ther. 1992;51(3):288–295. | ||
Hiemke C, Baumann P, Bergemann N, et al. AGNP consensus guidelines for therapeutic drug monitoring in psychiatry: update 2011. Pharmacopsychiatry. 2011;44(6):195–235. | ||
Tomita T, Yasui-Furukori N, Nakagami T, et al. Therapeutic reference range for plasma concentrations of paroxetine in patients with major depressive disorders. Ther Drug Monit. 2014;36(4):480–485. | ||
Gex-Fabry M, Gervasoni N, Eap CB, Aubry JM, Bondolfi G, Bertschy G. Time course of response to paroxetine: influence of plasma level. Prog Neuropsychopharmacol Biol Psychiatry. 2007;31(4):892–900. | ||
Gilles M, Deuschle M, Kellner S, et al. Paroxetine serum concentrations in depressed patients and response to treatment. Pharmacopsychiatry. 2005;38(3):118–121. | ||
Normann C, Horn M, Hummel B, Grunze H, Walden J. Paroxetine in major depression: correlating plasma concentrations and clinical response. Pharmacopsychiatry. 2004;37(3):123–126. | ||
Sakolsky DJ, Perel JM, Emslie GJ, et al. Antidepressant exposure as a predictor of clinical outcomes in the treatment of resistant depression in adolescents (TORDIA) study. J Clin Psychopharmacol. 2011;31(1):92–97. | ||
Yasui-Furukori N, Nakagami T, Kaneda A, et al. Inverse correlation between clinical response to paroxetine and plasma drug concentration in patients with major depressive disorders. Hum Psychopharmacol. 2011;26(8):602–608. | ||
Feng Y, Pollock BG, Ferrell RE, Kimak MA, Reynolds CF 3rd, Bies RR. Paroxetine: population pharmacokinetic analysis in late-life depression using sparse concentration sampling. Br J Clin Pharmacol. 2006;61(5):558–569. | ||
Lotrich FE, Bies RR, Smith GS, Pollock BG. Relevance of assessing drug concentration exposure in pharmacogenetic and imaging studies. J Psychopharmacol. 2006;20(4 Suppl):33–40. | ||
Hu C. Exposure-response modeling of clinical end points using latent variable indirect response models. CPT Pharmacometrics Syst Pharmacol. 2014;3:e117. | ||
Mould DR, Walz AC, Lave T, Gibbs JP, Frame B. Developing exposure/response models for anticancer drug treatment: special considerations. CPT Pharmacometrics Syst Pharmacol. 2015;4(1):e00016. | ||
Beal S, Sheiner LB, Boeckmann A, Bauer RJ. NONMEM User’s Guides (1989–2009). Ellicott City: Icon Development Solutions; 2009. | ||
Product monograph-PAXIL CR. 2014. Available from: http://www.gsk.ca/english/docs-pdf/product-monographs/Paxil-CR.pdf. Accessed June 10, 2015. | ||
Hamilton M. Development of a rating scale for primary depressive illness. Br J Soc Clin Psychol. 1967;6(4):278–296. | ||
Kato M, Serretti A. Review and meta-analysis of antidepressant pharmacogenetic findings in major depressive disorder. Mol Psychiatry. 2010;15(5):473–500. | ||
Lingjaerde O, Ahlfors UG, Bech P, Dencker SJ, Elgen K. The UKU side effect rating scale. A new comprehensive rating scale for psychotropic drugs and a cross-sectional study of side effects in neuroleptic-treated patients. Acta Psychiatr Scand Suppl. 1987;334:1–100. | ||
Yafune A, Ishiguro M. Bootstrap approach for constructing confidence intervals for population pharmacokinetic parameters. I: a use of bootstrap standard error. Stat Med. 1999;18(5):581–599. | ||
Venkatakrishnan K, Obach RS. In vitro–in vivo extrapolation of CYP2D6 inactivation by paroxetine: prediction of nonstationary pharmacokinetics and drug interaction magnitude. Drug Metab Dispos. 2005;33(6):845–852. | ||
Findling RL, Reed MD, Myers C, et al. Paroxetine pharmacokinetics in depressed children and adolescents. J Am Acad Child Adolesc Psychiatry. 1999;38(8):952–959. | ||
Lundmark J, Scheel Thomsen I, Fjord-Larsen T, et al. Paroxetine: pharmacokinetic and antidepressant effect in the elderly. Acta Psychiatr Scand Suppl. 1989;350:76–80. | ||
Tomita T, Yasui-Furukori N, Nakagami T, et al. The influence of 5-HTTLPR genotype on the association between the plasma concentration and therapeutic effect of paroxetine in patients with major depressive disorder. PLoS ONE. 2014;9(5):e98099. | ||
Wilkie MJ, Smith G, Day RK, et al. Polymorphisms in the SLC6A4 and HTR2A genes influence treatment outcome following antidepressant therapy. Pharmacogenomics J. 2009;9(1):61–70. | ||
Kato M, Fukuda T, Serretti A, et al. ABCB1 (MDR1) gene polymorphisms are associated with the clinical response to paroxetine in patients with major depressive disorder. Prog Neuropsychopharmacol Biol Psychiatry. 2008;32(2):398–404. | ||
Reis M, Aberg-Wistedt A, Agren H, Hoglund P, Akerblad AC, Bengtsson F. Serum disposition of sertraline, N-desmethylsertraline and paroxetine: a pharmacokinetic evaluation of repeated drug concentration measurements during 6 months of treatment for major depression. Hum Psychopharmacol. 2004;19(5):283–291. | ||
Tasker TC, Kaye CM, Zussman BD, Link CG. Paroxetine plasma levels: lack of correlation with efficacy or adverse events. Acta Psychiatr Scand Suppl. 1989;350:152–155. | ||
Ruhe HG, Booij J, v Weert HC, et al. Evidence why paroxetine dose escalation is not effective in major depressive disorder: a randomized controlled trial with assessment of serotonin transporter occupancy. Neuropsychopharmacology. 2009;34(4):999–1010. | ||
Cantrell CR, Eaddy MT, Shah MB, Regan TS, Sokol MC. Methods for evaluating patient adherence to antidepressant therapy: a real-world comparison of adherence and economic outcomes. Med Care. 2006; 44(4):300–303. |
 © 2015 The Author(s). This work is published and licensed by Dove Medical Press Limited. The
full terms of this license are available at https://www.dovepress.com/terms
and incorporate the Creative Commons Attribution
- Non Commercial (unported, 3.0) License.
By accessing the work you hereby accept the Terms. Non-commercial uses of the work are permitted
without any further permission from Dove Medical Press Limited, provided the work is properly
attributed. For permission for commercial use of this work, please see paragraphs 4.2 and 5 of our Terms.
© 2015 The Author(s). This work is published and licensed by Dove Medical Press Limited. The
full terms of this license are available at https://www.dovepress.com/terms
and incorporate the Creative Commons Attribution
- Non Commercial (unported, 3.0) License.
By accessing the work you hereby accept the Terms. Non-commercial uses of the work are permitted
without any further permission from Dove Medical Press Limited, provided the work is properly
attributed. For permission for commercial use of this work, please see paragraphs 4.2 and 5 of our Terms.