Back to Journals » Clinical Pharmacology: Advances and Applications » Volume 8
Exposure-response analysis to assess concentration–QTc relationship of CC-122
Authors Li Y, Carayannopoulos L, Thomas M, Palmisano M, Zhou S
Received 3 May 2016
Accepted for publication 29 June 2016
Published 9 September 2016 Volume 2016:8 Pages 117—125
DOI https://doi.org/10.2147/CPAA.S111867
Checked for plagiarism Yes
Review by Single anonymous peer review
Peer reviewer comments 3
Editor who approved publication: Professor Arthur E. Frankel
Yan Li, Leonidas N Carayannopoulos, Michael Thomas, Maria Palmisano, Simon Zhou
Translational Development and Clinical Pharmacology, Celgene Corporation, Summit, NJ, USA
Abstract: CC-122 hydrochloride is a novel pleiotropic pathway modifier compound that binds cereblon, a substrate receptor of the Cullin 4 RING E3 ubiquitin ligase complex. CC-122 has multiple activities including modulation of immune cells, antiproliferative activity of multiple myeloma and lymphoma cells, and antiangiogenic activity. CC-122 is being developed as an oncology treatment for hematologic malignancies and advanced solid tumors. Cardiovascular and vital sign assessments of CC-122 have been conducted in hERG assays in vitro and in a 28-day good laboratory practice monkey study with negative signals. To assess the potential concentration–QTc relationship in humans and to ascertain or exclude a small QT effect by CC-122, a plasma concentration exposure- and ΔQTcF-response model of CC-122 was developed. Intensive CC-122 concentration and paired triplicate electrocardiogram data from a single ascending dose study were included in the analysis. The parameters included in the final linear exposure-response model are intercept, slope, and treatment effect. The slope estimate of 0.0201 with 90% CI of (0.009, 0.035) indicates a weak relationship between ΔQTcF and CC-122 concentration. The upper bounds of the 90% CI of the model-predicted ΔΔQTcF effect at Cmax from the 4 mg clinical dose and the supratherapeutic dose of 15 mg (1.18 ms and 8.76 ms, respectively) are <10 ms threshold, suggesting that the risk of CC-122 QT prolongation effect at the relevant therapeutic dose range from 1 mg to 4 mg is low.
Keywords: cardiovascular assessment, QT prolongation effect
Introduction
CC-122 hydrochloride (racemate; 3-(5-amino-2-methyl-4-oxoquinazolin-3(4H)-yl) piperidine-2,6-dione hydrochloride) is a novel pleiotropic pathway modifier compound and a chiral molecule that contains an approximately equal mixture of R-enantiomer (CC-17339) and S-enantiomer (CC-17342). In vitro (in buffer, cell culture media, and animal/human plasma), as well as in vivo (rats and monkeys), the CC-122 enantiomers undergo fast interconversion. CC-122 has multiple activities, which include modulation of several immune cells, antiproliferative activity in multiple tumor cell types, and antiangiogenic activity. As a result of these pharmacological effects, CC-122 is being developed as an oncology treatment for hematologic malignancies and advanced solid tumors, including hepatocellular carcinoma (HCC) and non-Hodgkin’s lymphoma, including diffuse large B cell lymphoma (DLBCL), chronic lymphocytic leukemia (CLL), and/or multiple myeloma (MM).1
As per the regulatory guidance and industrial best practice, novel pharmaceutical agents shall undergo rigorous evaluation for their potential to delay cardiac repolarization.2–4 Assessed as prolongation of the QT interval on the electrocardiogram (ECG), a delay in cardiac repolarization creates an electrophysiological environment that is liable for the development of ventricular arrhythmias, most notably torsade de pointes, which may lead to sudden death. To this end, the potential of CC-122 to prolong QT interval has been evaluated in preclinical studies. In vitro inhibition of the human ether-à-go-go-related gene (hERG) ion channel has been measured with CC-122, with only minimal inhibition (9.6%) detected at 10 µM (~35-fold safety margin based on preliminary Day 15 peak plasma concentration [Cmax] values for the 3.0 mg clinical dose in humans). Cardiovascular and vital sign assessments for CC-122 have also been conducted under ketamine sedation between 2 hours and 4 hours postdose in the 28-day good laboratory practice oral monkey study, and no test article-related changes were observed at any dose (data on file, Celgene Corporation, 2016). So far, a clinical thorough QT (TQT)/corrected QT (QTc) interval study has not been performed for CC-122. In TQT studies, lenalidomide and pomalidomide, structural congeners of CC-122, were not found to be associated with QT prolongation.5,6
A collaboration between the Consortium for Innovation and Quality in Pharmaceutical Development and the Cardiac Safety Research Consortium formulated a reasonable proposition based on preliminary findings that the cost- and resource-intensive TQT study did not have better sensitivity or advantage over robust ECG monitoring in first-in-man single ascending dose (SAD) studies and followed by exposure-response (ER) analysis of the ECG data in detecting the potential risk of QT prolongation. A dedicated clinical study in healthy subjects has been designed to demonstrate that the TQT study can be replaced by robust ECG monitoring and ER analysis of data from SAD studies.7 This study succeeded, leading to revision of the ICH E14 guideline and the accompanying ICH E14 “Questions & Answers: The Clinical Evaluation of QT/QTc Interval Prolongation and Proarrhythmic Potential for Non-Antiarrhythmic Drugs”.8 This revision reached Step 4 of the ICH Process in December 2015 and now enters the implementation period (Step 5). In this document, the E14 Q&A on Concentration-Response Modeling (# 5.1) provides harmonized guidance on how concentration-response modeling could be used for regulatory decision making.9
Consistent with the spirit of the revised ICH guideline, Celgene Corporation has conducted an SAD study (“A Phase 1, Randomized, Two-Part Study to Evaluate the Safety, Tolerability, and Pharmacokinetics (PK) of Single Ascending Doses of CC-122 [CC-122-CP-002]” Part 1 and “An Open Label, Randomized, Three Period, Six Sequence, Three Way Single Dose Crossover Study to Evaluate the PK of CC-122 after Administration of Formulated (Test) and Non-Formulated (Reference) CC-122 Capsules in Healthy Adult Subjects” Part 2), in which subjects received a single oral dose of either CC-122 or placebo with robust ECG monitoring. Forty subjects were randomized and enrolled into five planned cohorts (3 mg, 6 mg, 9 mg, 12 mg, and 15 mg of CC-122). Each cohort consisted of eight subjects; six subjects received CC-122 and two subjects received placebo. Triplicate 12-lead ECGs were performed to help monitor safety and tolerability. As per the revised ICH E14 Q&A, ER analyses based on the ECG and PK data of this SAD study were performed to assess a potential concentration–QTc relationship and the associated potential of CC-122 to delay cardiac repolarization at clinically relevant exposures. Results of this analysis show little to no risk of QTc prolongation by CC-122 at relevant clinical dose range.
Methods
Study and ethics
CC-122-CP-002 (Part 1) was a randomized, blinded, placebo-controlled study to evaluate the safety, tolerability, and PK of CC-122 following a single oral dose in healthy adult subjects. The study participants, investigators, and any other clinical site staff directly involved in the conduct of the trial were blinded to treatment throughout the study.
The study was conducted in accordance with the ethical principles of Good Clinical Practice. All subjects gave written informed consent prior to enrollment. The study was approved by the institutional review board (Salus IRB, Austin, TX, US) of the participating center and was conducted according to the Declaration of Helsinki and the ICH Guidelines for Good Clinical Practice.
Study design and treatment
Each subject participated in a screening phase (Days –28 to –2), a baseline phase (Day –1), a treatment phase (Days 1–4), and a safety follow-up telephone call on Day 7 (±1 day window). Subjects were screened for eligibility, and those who met all inclusion criteria and none of the exclusion criteria at screening returned to the clinical site on Day –1 for baseline assessments and were domiciled at the clinical site from Day –1 to Day 4.
Subjects received a single oral dose of investigational product (either CC-122 or placebo) on Day 1, under fasted conditions, according to the randomization schedule. A total of 40 subjects were randomized and enrolled into five planned cohorts, and demographic data are summarized in Table 1. Each cohort consisted of eight subjects; six subjects received CC-122, two subjects received placebo, and each subject participated in only one cohort. Dose escalation was based on the safety and tolerability of CC-122 in each cohort. CC-122 exposure was evaluated for each cohort.
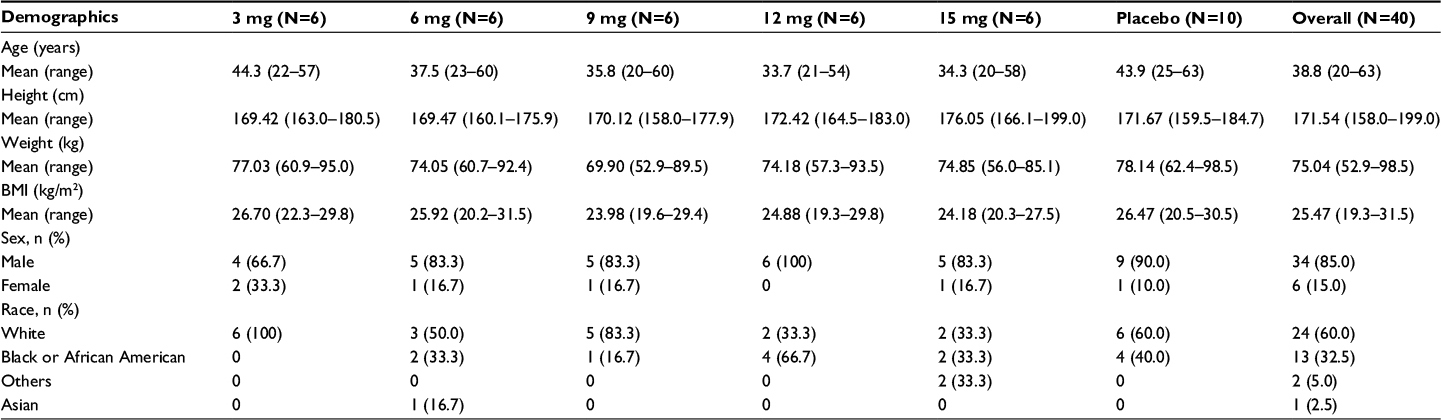 | Table 1 Demographic and other baseline characteristics Note: N, total number of subjects. Abbreviation: BMI, body mass index. |
PK data collection
Plasma was collected from each subject at prespecified PK time points (at predose, 0.25 hour, 0.5 hour, 1 hour, 1.5 hours, 2 hours, 3 hours, 4 hours, 6 hours, 8 hours, 12 hours, 24 hours, 48 hours, and 72 hours post-Day 1 dose). A validated liquid chromatography–tandem mass spectrometry method with lower limit of quantification of 0.5 ng/mL was used to determine CC-122 concentrations. Plasma samples were spiked with stable labeled CC-122 (as an internal standard), processed by liquid–liquid extraction, and analyzed using reversed-phase HPLC with electrospray ionization tandem mass spectrometry detection. Peak separation was achieved using high-performance liquid chromatography with a gradient of organic solvent (90:10 methanol:water with 0.1% formic acid) and aqueous mobile phases.
ECG data collection
Twelve-lead ECGs were obtained and assessed as one of the safety end points to monitor safety and tolerability at predose and 1.5 hours, 2 hours, 3 hours, 4 hours, 8 hours, 20 hours, 30 hours, and 40 hours postdose. Each scheduled 12-lead ECG was performed in triplicate using a Mortara ELI 250c electrocardiograph (Mortara Instrument Inc., Milwaukee, WI) at a paper speed of 25 mm/s within a 30–60-second window after the subject had been supine for at least 5 minutes. If the scheduled time for an ECG coincided with a blood collection, the ECG was performed within 30 minutes prior to the blood collection, which occurred at the nominal times listed above.
The rhythm, ventricular rate, PR interval, QRS complex, QT interval, and QTcF interval and/or QTcB intervals were assessed using the VERITAS(R) Algorithm in device software (Version 1.2.3; Mortara Instrument Inc., Milwaukee, MI) and recorded in the source documents and case report form. In order to reduce the dependence of QT on heart rate, Fridericia’s correction using the preceding RR interval was applied for all analyses. Individual QTcF measurements were summarized with descriptive statistics by cohort and time point. Differences between QTcF at each posttreatment time point and that at baseline (ΔQTcF) were then calculated for every subject. The ΔQTcF for a given time point was recorded as the mean/median of the triplicates.
Exposure (concentration)-response (QT/QTc) relationship
ER analysis was performed using the linear mixed effect modeling program NONMEM (Version 7.2; ICON Development Solutions, Dublin, Ireland). The S-Plus (Version 8.2; TIBCO Software Inc., Somerville, MA, USA) and R-based model building aid Perl-speaks-NONMEM (Version 3.5.3, by Kajsa Harling and Andrew Hooker, Department of Pharmacy, Uppsala University, Uppsala, Sweden) postprocessing software were used for graphic processing. NONMEM was installed on Windows XP with the Intel Visual FORTRAN Compiler (Version 9.1; Intel, Santa Clara, California, US).
The primary analysis was based on a linear mixed-effects model implemented with ΔQTcF as the dependent variable, drug plasma concentration as a continuous covariate, treatment (active or placebo) and reduced time (ie, time with all nonsignificant time points combined into one) as categorical factors, and a random intercept per subject. The reduced time variable, if any, was treated as a categorical factor, representing the time elapsed since first drug administration. From the model, the slope (ie, the regression parameter for the concentration) and the treatment effect were estimated together with two-sided 90% CIs. A “reduced time” variable was determined from the placebo data using a linear mixed-effects model with ΔQTcF as the dependent variable with time as a factor, a random intercept per subject, and the fixed intercept set to zero. Only time points with an effect significant at the two-sided 10% alpha level in this model were retained; all other time points were assigned to a common level “Time 0”.7,8
The concentration–QTcF relationship was explored using linear mixed-effects analyses.10 The dataset consisted of observed drug concentrations and ΔQTcF values collected on Day 1. For patients who received placebo group treatment, concentrations were set to zero. Data points were excluded if either the ECG or concentration data were missing. Prior to model selection for the ER analysis, the absence of hysteresis was established by visual inspection of the shape of the concentration vs ΔQTcF profiles in each individual subject.
The concentration–QTcF relationship was assessed according to the following equation:
|
|

where Y is the response variable (ie, ΔQTcF), the intercept α represents the mean response, the slope β represents the change in mean for a unit change in CC-122 concentration, and the treatment effect (active or placebo) represents as categorical factors.
To assess the appropriateness of the linear model used in the current ER analysis, normal QQ plots for the residuals and plots of weighted residuals vs concentration were performed.
The predicted mean ΔΔQTcF at the observed geometric mean Cmax (ie, the product with the slope estimate + treatment effect [active - placebo]) was calculated. Two-sided 90% CIs of the estimate were calculated using a bias-corrected nonparametric bootstrap 3,000 resamples and subject as the unit of resampling. For each resample, the model was fitted, and the prediction was made at the geometric mean Cmax determined from the resampled data. The CI was determined from the distribution of resampled predicted values.8
Results
PK of CC-122 following ascending single oral doses
Mean plasma concentrations of CC-122 following ascending single oral doses of CC-122 under fasted conditions are presented in Figure 1. Mean CC-122 plasma concentration–time profiles are well characterized over the 72-hour postdose sampling interval. The plasma concentration vs time profiles for all doses of CC-122 under the fasted condition were characterized by a rapid absorption phase. The median Tmax was similar at each dose level, ranging from 0.78 hours to 1.0 hours postdose. Following attainment of Cmax, plasma concentrations of CC-122 appeared to decline in a monophasic manner at all tested dose levels. The mean apparent elimination half-life was generally similar at all tested dose levels, ranging from 7.6 hours to 8.9 hours.
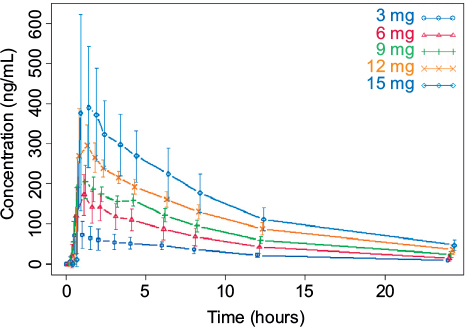 | Figure 1 Observed average plasma concentration (± standard deviation) by time point and dose level. |
QTcF following ascending single oral doses of CC-122
Descriptive statistics of QTcF data by cohort and time point are presented in Table 2. Of note, the median baseline QTcF values, defined as the median of the raw QTcF values at predose time points on Day 1, were 399.5 ms, 396 ms, 411.5 ms, 401.5 ms, 389.0 ms, and 390.0 ms for the placebo, Cohorts A, B, C, D, and E groups, respectively. Absolute QTcF values were within the normal range and below critical thresholds associated with the development of torsade de pointes/sudden death.11 Overall, no patient in the treatment arms showed QTcF values of >450 ms.
 | Table 2 QTcF by cohort and time Notes: Median (min, max) is presented; QTcF, corrected QT by Fridericia correction formula. |
ΔQTcF following ascending single oral doses of CC-122
To further assess the potential effect of study treatment in subjects who received CC-122 relative to those who received placebo, summary statistics of ΔQTcF were calculated (Table 3). Upper ranges of ΔQTcF for the CC-122 groups were <20 ms for all postdose time points. Of note, maximum ΔQTcF values, defined as the upper range of the ΔQTcF values at postdose time points, were 9 ms, 5.33 ms, 7.0 ms, 5.33 ms, 8.67 ms, and 16.67 ms for the placebo, Cohorts A, B, C, D, and E groups, respectively.
 | Table 3 ΔQTcF by cohort and time Note: Median (min, max) is presented. Abbreviations: QTcF, corrected QT by Fridericia correction formula; ΔQTcF, change-from-baseline of QTcF. |
Observed average ΔQTcF (± standard deviation) by time point and dose level appears in Figure 2. The largest mean placebo-adjusted ΔQTcF (ΔΔQTcF) was <10 ms. ΔΔQTcF values were 0.67 ms, 0.37 ms, −0.25 ms, 0.70 ms, and 0.93 ms for 3 mg, 6 mg, 9 mg, 12 mg, and 15 mg dose, respectively. There was no observable dose-dependent manner over the 3–15 mg dose range.
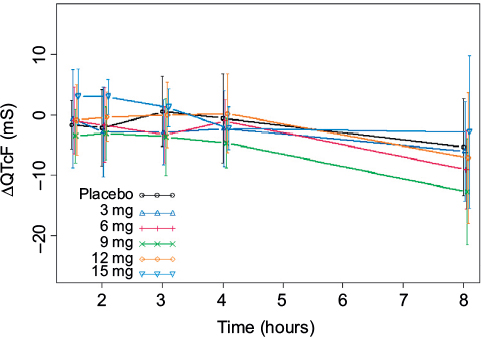 | Figure 2 Observed average ΔQTcF (± standard deviation) by time point and dose level. Abbreviations: QTcF, corrected QT by Fridericia correction formula; ΔQTcF, change-from-baseline of QTcF. |
ER analysis
The absence of hysteresis between the concentration and ΔQTcF relationship has been established by the visual inspection of the concentration vs ΔQTcF profiles from all subjects (Figure 3). In the absence of hysteresis, the primary analysis in the current ER analysis was conducted based on a linear mixed-effects model implemented in NONMEM, Version 7.2 with ΔQTcF as the dependent variable, drug plasma concentration as a continuous covariate, treatment (active or placebo) and reduced time (ie, time with all nonsignificant time points combined into one) as categorical factors, and a random intercept per subject.
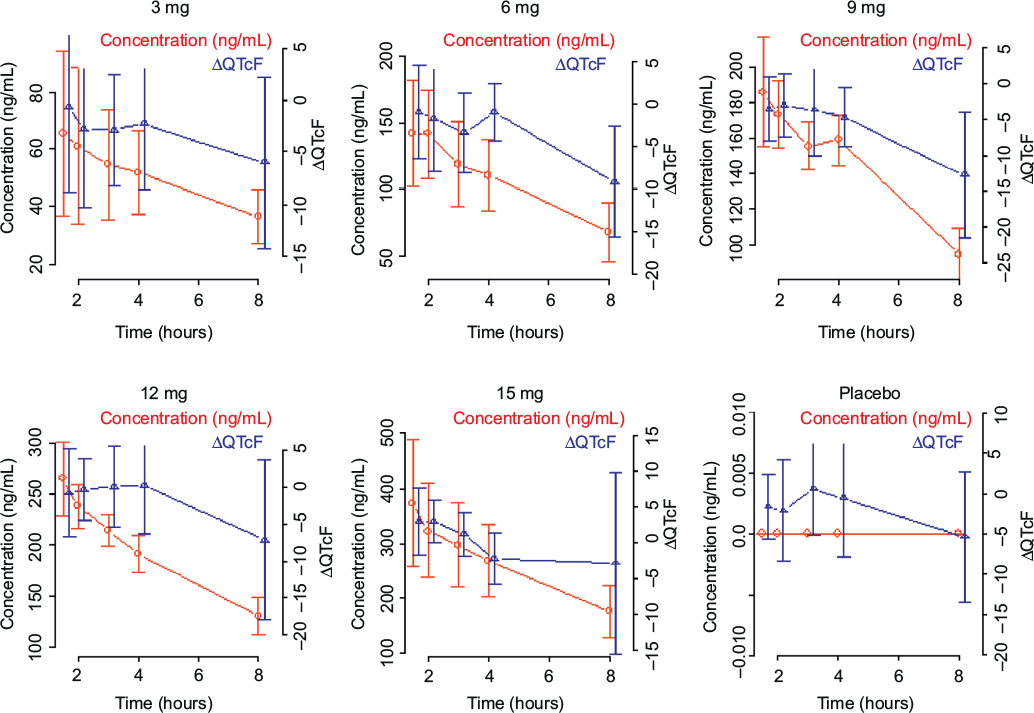 | Figure 3 Observed average plasma concentration and average change from baseline QTcF by time point. Abbreviations: QTcF, corrected QT by Fridericia correction formula; ΔQTcF, change-from-baseline of QTcF. |
A reduced time variable was determined from the placebo data using a linear mixed-effects model with ΔQTcF as the dependent variable with time as a factor, a random intercept per subject, and a fixed intercept set to zero. Only time points with an effect significant at the two-sided 10% alpha level in this model were retained; all other time points were assigned to a common level Time 0. In the current analysis, no time point showed an effect significant at the two-sided 10% alpha level and was retained.
The parameters included in the final ER model are intercept, slope, and treatment effect. The estimated parameters from the ER analysis and their 90% CI from 3,000 nonparametric bootstraps are shown in Table 4. The slope estimate of 0.0201 with the 90% CI of (0.009, 0.035) indicates a weak relationship between ΔQTcF and CC-122 concentration.
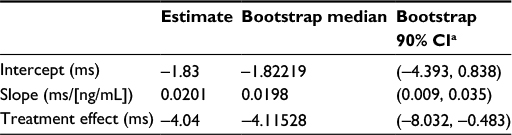 | Table 4 Slope and treatment effect of the ER (QTc vs concentration) analyses Notes: aBootstrap CI values are taken from 3,000 nonparametric bootstrap calculations. Abbreviations: ER, exposure response; QTc, corrected QT interval. |
To assess the appropriateness of the linear model used in the current ER analysis, normal QQ plots for the residuals (data not shown) and plots of weighted residuals vs concentration were produced (Figure 4). Residual of ΔQTcF derived from the final model was homogeneously distributed around 0, suggesting no bias in predicting high and low values of ΔQTcF (Figure 4). Overall, observed concentrations vs ΔQTcF data were well fitted by the linear model.
 | Figure 4 Weighted residuals vs concentration plot. Notes: The black line represents the identity line or zero line. The red line represents the locally weighted scatter plot smoothing line. |
The predicted mean ΔΔQTcF at the observed geometric mean Cmax under clinical dose of 4 mg and supratherapeutic dose of 15 mg (ie, the product with the slope estimate + treatment effect [active - placebo]) was calculated, and two-sided 90% CIs of the estimate were calculated using a bias-corrected nonparametric bootstrap 3,000 resamples and subject as the unit of resampling (Table 5 and Figure 5).
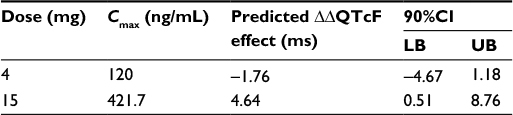 | Table 5 Geometric mean plasma level of CC-122 at 4/15 mg dose levels and projected ΔΔQTc effect Abbreviations: LB, lower bound; UB upper bound; Cmax, maximum plasma concentration; QTc, corrected QT interval; ΔΔQTcF, placebo-adjusted change from baseline of corrected QT interval using Fridericia formula. |
 | Figure 5 Predicted effect on ΔΔQTcF from concentration/QTc effect model. Notes: The solid black line with gray-shaded area denotes the model-predicted mean placebo-adjusted ΔΔQTcF with 90% CI as a function of plasma concentration. The horizontal red lines with tick marks show the range of plasma concentrations divided into deciles. Red squares with vertical bars denote the observed arithmetic mean and 90% CI for the placebo-adjusted ΔΔQTcF within each plasma concentration decile. The blue boxes denote the predicted mean placebo-adjusted ΔΔQTcF with 90% CI at the clinical dose of 4 mg and at the supratherapeutic dose of 15 mg. Abbreviations: QTcF, corrected QT by Fridericia correction formula; ΔΔQTcF, placebo-adjusted, change-from-baseline of QTcF. |
Discussion
Prolongation of the QTc interval, resulting in increased susceptibility to cardiac arrhythmia, is a recognized risk of pharmaceutical agents in a wide range of therapeutic settings. Ideally, novel, systemically available agents should all be evaluated in a TQT study in healthy volunteers, but where such a study is deemed impractical or unethical, eg, cytotoxic agents, dedicated ECG monitoring followed by concentration–QTc modeling would be more appropriate and is recommended to investigate potential drug-induced cardiac effects.2–4 Garg et al4 showed that pertuzumab has no clinically relevant effect on QTcF and other ECG parameters in patients with HER2-positive metastatic breast cancer by conducting concentration–QTc modeling based on data collected from a Phase III trial. Shah et al12 demonstrated that by utilizing ER analysis, the results from the SAD study could have obviated the need for a TQT study and provided favorable data that intensive ECG monitoring in early-phase clinical studies can replace a TQT study.
Because of the growing evidence that concentration–QT assessment is powerful in detecting potential QT prolongation, a collaboration between the Consortium for Innovation and Quality in Pharmaceutical Development and the Cardiac Safety Research Consortium was formed in 2013 to evaluate whether TQT study is superior to robust ECG monitoring in first-in-man SAD studies followed by ER analysis of TQT data in detecting the risk of QT prolongation. The QT effects of five “QT-positive” and one negative drug were tested to evaluate whether ER analysis can detect QT effects in a small study with healthy subjects.7 The result from this prospective study showed that the slope of the concentration/ΔQTc effect was steep enough to produce significantly QT prolongation at high doses for all five QT-positive drugs.8 For the negative drug, levocetirizine, a ΔΔQTcF effect >10 ms was excluded at sixfold the therapeutic dose. The study provided evidence that robust QT assessment in early-phase clinical studies may obviate the need of a TOT study.8,13 In light of this new information, the ICH E14 guideline has been revised, and the E14 Q&A on Concentration-Response Modeling (# 5.1) was revised to generate harmonized guidance on how concentration-response modeling could be used for regulatory decision making.9
In the development of CC-122 for hematologic malignancies and advanced solid tumor indications, cardiovascular risk has been evaluated in hERG assay in vitro and in 28-day good laboratory practice oral monkey study. Both studies showed negative signals (data on file, Celgene Corporation, 2016). In addition, TQT/corrected QT (QTc) interval studies have been conducted for lenalidomide and pomalidomide, CC-122’s similar chemical structure analogs. Both drugs are not associated with QT prolongation in healthy male subjects.5,6
CC-122 was studied in a randomized, blinded, placebo-controlled trial to evaluate its safety, tolerability, and PK following a single oral dose in healthy adult subjects. This trial included intensive ECG and PK measurements to support ER analysis of the QT interval. In general, single 3 mg, 6 mg, 9 mg, 12 mg, and 15 mg oral doses of CC-122 or placebo were safe and well tolerated by the healthy subjects in this study. No subject had a clinical laboratory result, vital sign measurement, ECG result, heart rate, PR interval, QRS interval, or physical finding that was considered clinically significant or reported as a treatment emergent adverse events. There were no treatment- or dose-related trends in vital sign measurements, 12-lead ECG results, or other safety assessments. Since intense triplicate ECG assessment has been conducted, paired with intense drug exposure assessment in this study, exposure–QTc analyses were conducted to evaluate the risk of QT prolongation by CC-122.
The primary objective of the current ER analyses was to assess the relationship between CC-122 exposure (concentration) and response (QT/QTc) to exclude small QT effect by CC-122. CC-122 was given at a series dose levels up to 15 mg, which is approximately fourfold higher than the current clinical dose of 4 mg. The upper range of observed ΔQTcF for the CC-122 cohorts was <20 ms at all postdose time points. Evidence of clinically irrelevant QT effect of CC-122 was provided by the ER model, which showed a very shallow slope and with no significant increase in QT signals at high concentrations of CC-122. The upper bounds of the 90% CI of the model-predicted ΔΔQTcF effect at Cmax from the clinical dose (4 mg) and the supratherapeutic dose (15 mg) are <10 ms (1.18 ms and 8.76 ms, respectively). The criterion for negative QT assessment used in this study corresponds to the one defining a negative TQT study as per the revised ICH E14 guideline, adapted to the use of ER analysis: a QTc effect >10 ms must be excluded with the supratherapeutic dose, ie, the upper bound of the 90% CI of the model-predicted ΔΔQTcF effect at Cmax must be <10 ms. CC-122 clearly met the criteria for negative QT assessment. One limitation of the current analysis should be acknowledged: the triplicate machine-recorded ECG was read by the investigator using standard electrocardiograph software, and the readings were not centralized. A TQT/corrected QT (QTc) interval study protocol is currently under development, and the results from this study will validate the findings from the current analyses.
Consistent with the concentration–QTc analysis, there was no substantial effect of prolongation on the measure of QTcB, QTcF prolongation observed following CC-122 treatment through the range of dose evaluated (0.5–3.5 mg), and no consistent pattern by the dose or cycle in a separate ECG expert analysis based on the ECG data collected from an ongoing Phase Ia/Ib patient trial (CC-122-ST-001: A Phase Ia/Ib, Multi-center, Open-label, Dose Finding Study to Assess the Safety, Tolerability, Pharmacokinetics and Preliminary Efficacy of the Pleiotropic Pathway Modifier CC-122 Administered Orally to Subjects with Advanced Solid Tumors, non-Hodgkin’s Lymphoma or Multiple Myeloma) was observed (data on file, Celgene Corporation, 2016).
Conclusion
The potential for QT prolongation by CC-122 was evaluated using ER analysis. The upper bounds of the 90% CI of the model-predicted ΔΔQTcF effect at Cmax from the clinical dose (4 mg) and the supratherapeutic dose (15 mg) are below 10 ms, suggesting the risk of CC-122 QT prolongation effect at clinical dose of 4 mg is low. The robust QT assessment from the CC-122-CP-002 study demonstrated little to no risk of QT prolongation by CC-122 in relevant clinical dose range.
Disclosure
All authors are the employees of, and hold equity ownership in Celgene Corporation. The authors report no other conflicts of interest in this work.
References
Hagner P, Man HW, Fontanillo C, et al. CC-122, a pleiotropic pathway modifier, mimics an interferon response and has antitumor activity in DLBCL. Blood. 2015;126(6):779–789. | ||
European Agency for the Evaluation of Medicinal Products (EMEA). ICH Topic E14: Note for Guidance on the Clinical Evaluation of QT/QTc Interval Prolongation and Proarrhythmic Potential for Non-Antiarrhythmic Drugs (CHMP/ICH/2/04). London: European Medicines Agency (EMEA); 2005. | ||
U.S. Department of Health and Human Services Food and Drug Administration (FDA), Center for Biologics Evaluation and Research (CBER). Guidance for Industry: E14 Clinical Evaluation of QT/QTc Interval Prolongation and Proarrhythmic Potential for Non-Antiarrhythmic Drugs. Rockville: US Food and Drug Administration; 2005. | ||
Garg A, Li J, Clark E, et al. Exposure-response analysis of pertuzumab in HER2-positive metastatic breast cancer: absence of effect on QTc prolongation and other ECG parameters. Cancer Chemother Pharmacol. 2013;72(5):1133–1141. | ||
Chen N, Ye Y, Liu L, et al. Lenalidomide at therapeutic and supratherapeutic doses does not prolong QTc intervals in the thorough QTc study conducted in healthy men. Basic Clin Pharmacol Toxicol. 2013;113(3):179–186. | ||
Mondal SA, Assaf M, Liu L, O’Mara E. A Phase 1, double-blind, 4-period crossover study to investigate the effects of pomalidomide on QT interval in healthy male subjects. Cancer Chemother Pharmacol. 2016;77(2):251–258. | ||
Darpo B, Sarapa N, Garnett C, et al. The IQ-CSRC prospective clinical Phase 1 study: “can early QT assessment using exposure response analysis replace the thorough QT study?”. Ann Noninvasive Electrocardiol. 2014;19(1):70–81. | ||
Darpo B, Benson C, Dota C, et al. Results from the IQ-CSRC prospective study support replacement of the thorough QT study by QT assessment in the early clinical phase. Clin Pharmacol Ther. 2015;97(4):326–335. | ||
International Conference on Harmonization EI and Working Group. ICH E14 Guideline: The Clinical Evaluation of QT/QTc Interval Prolongation and Proarrhythmic Potential for Non-Antiarrhythmic Drugs Questions & Answers (R3). Geneva: International Conference on Harmonization group (ICH); 2015. | ||
Garnett CE, Beasley N, Bhattaram VA, et al. Concentration-QT relationships play a key role in the evaluation of proarrhythmic risk during regulatory review. J Clin Pharmacol. 2008;48(1):13–18. | ||
Bednar MM, Harrigan EP, Anziano RJ, Camm AJ, Ruskin JN. The QT interval. Prog Cardiovasc Dis. 2001;43(5 suppl 1):1–45. | ||
Shah RR, Maison-Blanche P, Robert P, Denis E, Duvauchelle T. Can an early phase clinical pharmacology study replace a thorough QT study? Experience with a novel H3-receptor antagonist/inverse agonist. Eur J Clin Pharmacol. 2016;72(5):533–543. | ||
Cavero I, Holzgrefe H, Clements M. The prospective IQ-CSRC trial: a prototype early clinical proarrhythmia assessment investigation for replacing the ICH E14 thorough QTc (TQT) study. J Pharmacol Toxicol Methods. 2016;80:1–8. |
 © 2016 The Author(s). This work is published and licensed by Dove Medical Press Limited. The
full terms of this license are available at https://www.dovepress.com/terms
and incorporate the Creative Commons Attribution
- Non Commercial (unported, 3.0) License.
By accessing the work you hereby accept the Terms. Non-commercial uses of the work are permitted
without any further permission from Dove Medical Press Limited, provided the work is properly
attributed. For permission for commercial use of this work, please see paragraphs 4.2 and 5 of our Terms.
© 2016 The Author(s). This work is published and licensed by Dove Medical Press Limited. The
full terms of this license are available at https://www.dovepress.com/terms
and incorporate the Creative Commons Attribution
- Non Commercial (unported, 3.0) License.
By accessing the work you hereby accept the Terms. Non-commercial uses of the work are permitted
without any further permission from Dove Medical Press Limited, provided the work is properly
attributed. For permission for commercial use of this work, please see paragraphs 4.2 and 5 of our Terms.