Back to Journals » ClinicoEconomics and Outcomes Research » Volume 6
Exploring the willingness to pay for a quality-adjusted life-year in the state of Penang, Malaysia
Authors Shafie A ![]() , Lim YW, Chua GN, Hassali MAA
, Lim YW, Chua GN, Hassali MAA ![]()
Received 7 May 2014
Accepted for publication 8 July 2014
Published 23 October 2014 Volume 2014:6 Pages 473—481
DOI https://doi.org/10.2147/CEOR.S67375
Checked for plagiarism Yes
Review by Single anonymous peer review
Peer reviewer comments 4
Asrul Akmal Shafie, Yen Wei Lim, Gin Nie Chua, Mohammed Azmi Ahmad Hassali
Discipline of Social and Administrative Pharmacy, School of Pharmaceutical Sciences, Universiti Sains, Penang, Malaysia
Introduction: The incremental cost-effectiveness ratio (ICER) is typically compared with a reference value to support the cost-effectiveness of a decision. One method for estimating this value is to estimate the willingness-to-pay (WTP) for a quality-adjusted life-year (QALY). This study was conducted to explore the WTP for a QALY in the Malaysian population.
Methods: A cross-sectional, contingent valuation study was conducted in Penang, Malaysia. Respondents were selected from randomly chosen geographical grids of Penang. Respondents’ sociodemographic information, qualities of life, and WTP for one additional QALY were collected using predesigned questionnaires in face-to-face interviews. WTP values were elicited using a double-bound dichotomous choice via a bidding game approach. The Heckman selection model was applied to the analysis of the mean WTP/QALY values, where the “protest zero” values, which may contribute to selection bias, were excluded.
Results: The mean value of WTP for an additional QALY gained was estimated to be MYR (Malaysian Ringgit) 29,080 (~USD 9,000). Key factors that affected the WTP include ethnicity and estimated monthly household income.
Conclusion: The study findings suggested that the cost-effectiveness threshold value as studied in Penang, Malaysia was estimated to be MYR 29,080.
Keywords: WTP, QALY, cost-effectiveness threshold, contingent valuation method, Malaysia
Introduction
Cost-utility analysis (CUA) is a form of economic evaluation that focuses specifically on the quality of health outcomes produced by health programs or services.1 CUA has increasingly been used in the economic evaluation of health care for research or decision-making purposes, particularly when decisions on the allocation of health resources must be made.2
In CUA, the incremental cost between two programs is compared with the incremental health improvement attributed to these programs. Health improvement is normally measured in the quality-adjusted life-years (QALYs) gained or using other generic outcome measures, such as disability-adjusted life-years (DALYs). The results of CUA are typically expressed as cost per QALY gained.1 The estimated incremental cost-effectiveness ratio (ICER) derived is usually compared with a reference value to determine a program’s cost effectiveness; a health system will only fund activities that cost equal to or less than this value. This reference value is also named the cost-effectiveness threshold value, which is usually estimated in terms of societal willingness-to-pay (WTP) for a QALY.
A number of countries have explicitly stated their own threshold values. For instance, the threshold value set by the National Institute for Health and Clinical Excellence in the United Kingdom has a threshold value of GBP 20,000–30,000 per QALY gained, whereas Ireland’s threshold is Euro 20,000 per QALY gained.3–5 Additionally, the Slovak Republic uses a threshold ranging from Euro 18,000–26,500 per QALY for drug reimbursements.5 In current practice in Malaysia, however, decisions regarding the coverage of new health care technologies are made without transparent decision criteria. In a review of 14 Malaysian economic evaluation papers from 1999 to 2011,6–19 it was found that most reported cost-effectiveness outcomes were based solely on the average cost-effectiveness ratio without considering the ICER. Although some papers discussed cost-effectiveness threshold values, decisions were made without using a transparent and solid threshold value. The funding and reimbursement process in Malaysia uses an arbitrary threshold value of one to three times the regional gross domestic product (GDP) per capita, as recommended by the World Health Organization (WHO).20,21 It was also noted that of the 14 reviewed papers, only two papers17,19 discussed the use of CUA in decision making. This finding indicates that the use of CUA in decision making for health care programs is not popular in Malaysia, despite the global trend of rapid growth in the publication of CUA papers, in which many experts have recommended the application of CUA in health economics and outcomes research.22,23 Hence, through this paper, we hope that the use of CUA in decision making for health care interventions will be encouraged in Malaysia, via a recommendation in the Pharmacoeconomic Guideline for Malaysia.24 In addition, by exploring a cost-effectiveness threshold value in Malaysia, estimated in terms of societal WTP per QALY (WTP/QALY), health care decision making will be improved.
The contingent valuation method (CVM) is a widely used technique for estimating the value of nonmarketed commodities, where it creates a hypothetical marketplace in which no actual transactions are made.25,26 This method is applied as a reasonable approach for determining the monetary value that society places on a QALY.3,27,28 As a threshold should represent the value a society attaches to a QALY, individual valuations of personal health gains can be directly elicited using contingent valuation (CV). In the recently performed European Value of a Quality-Adjusted Life-Year (EuroVaQ) study, CVM with a chained approach was adopted to determine the value of WTP/QALY gained. Using this method, it is possible to assess societal utility measures and elicit individualized WTP values. Combining the answers of both utility and WTP values would allow respondents’ WTP/QALY gained to be estimated.29 In CV surveys, the use of a dichotomous-choice format is widely accepted due to its way of inducing respondents to reveal their true preferences and its simplification of the cognitive task faced by respondents (where there are only two possible responses: “yes” or “no”).26 Nevertheless, it is vital to identify some potential influences on the results, due to the starting-point bias and outliers.
This study was the first attempt in Malaysia to explore the use of CVM in estimating the value of WTP/QALY and to assess the general factors associated with the WTP amount for a QALY gained. It is anticipated that the findings from this study could serve as a basis for determining a valid cost-effectiveness threshold value for Malaysia, which could, in turn, assist health authorities in making informed funding and reimbursement decisions and in formulating health policies.
Methods
Research structure
A cross sectional CV study was conducted among adults from the general population in Penang, Malaysia, in August 2010. Penang is one of 13 states in Malaysia and consists of two separate areas, Penang Island and Seberang Perai, on the Peninsular Malaysia mainland. The state of Penang is the second most densely populated place in Malaysia. It has a high level of urbanization (91.4%) and had a total population of 1.56 million residents in 2010.30 This study was carried out through a face-to-face survey, with one family member in each household, using a predesigned questionnaire that measured WTP for 1 additional year of survival with perfect health. The family member could be the head of household, the spouse of the head of household, son or daughter of the head of household, or someone else. In the questionnaire, a double-bound dichotomous-choice approach was applied in which respondents were asked whether they would be willing to pay a specified amount (which was randomly chosen from three starting bid values) for a particular treatment that would be capable of extending their life by 1 year, with perfect health. A bidding game technique was used to elicit respondents’ WTP values.
Subject sampling
A minimum sample size of 286 was required for a multiple regression test, using the rule of thumb for a small effect size (30 participants per variable plus 50) expected with seven predictors (monthly household income, ethnicity, visual analog score, presence of disease, satisfaction with provided medical care, satisfaction with medical care available in the country, and total expenditure on health for the last 3 months) and a dropout rate of 10%.31 In the absence of a population-level sampling framework, this exploratory study adopted random walking to reduce biases and introduce randomness into the sampling. Gridlines (1 km2) were overlaid on a Google Earth map of Penang, resulting in 192 grids. Sixty-nine grids were excluded because they were designated as natural forests and were geographically uninhabitable areas. Ten grids were randomly selected from the remaining 123 grids, using Microsoft Excel® 2007 software. Within each grid, the initial direction for data collection was determined using a random pen-throw method.
Questionnaire design
We developed questionnaires, in both English and Malay, to collect respondents’ sociodemographic information; to assess quality of life, using the EuroQol visual analog scale (EQ-VAS)32 (a thermometer-like visual analog scale [VAS] ranging from 0 to 100, with 0 signifying the worst health state imaginable and 100 signifying the best health state imaginable); and to determine the cost-effectiveness threshold value, by collecting the information on subject’s WTP for one additional QALY. The scenario for the CV was modified from Shiroiwa et al.3 In the scenario (Figure 1), respondents were asked whether they were willing to pay for medication A, which would treat a serious illness and give them 1 year of perfect health. If a positive response was obtained, respondents were asked to give a WTP amount for medication A, using a double-bound dichotomous choice bidding game approach with three different starting bids (MYR [Malaysian Ringgit] 20,000, MYR 40,000, and MYR 100,000). The first three from six starting bid values used by Shiroiwa et al were chosen because they were close to the range of the cost-effectiveness threshold in Malaysia set by the WHO.21 The bidding values were converted to Malaysian currency, and subsequent bidding values were modified, contingent on the response to the initial bid.
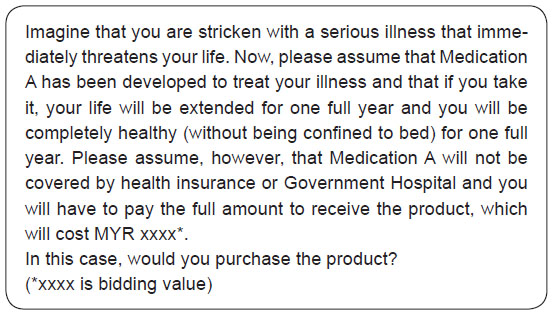 | Figure 1 The health state scenario for the willingness-to-pay exercise. |
Statistical analysis
In the elicitation of WTP values, it is important to distinguish between true zero values and the “protest zero” values provided by respondents. Some respondents who have a positive WTP amount for the commodity may provide “protest zero” values if they disagree with some aspects of a scenario in the survey. For instance, some respondents may think that the treatment cost should be covered by the government or insurance companies and thus give a WTP value of zero. In this case, the value is identified as a “protestor” and should be excluded from the analysis.33 Conversely, those with true zero values should be included in the analysis. Excluding all true zero and protest zero values from the analysis may reduce the number of samples being analyzed and introduce some degree of selection bias. Hence, the selection of samples is crucial to the data analysis.
All data were analyzed using STATA 9.0 (StataCorp, College Station, TX, USA). To summarize the data, the Kruskal–Wallis test was applied to assess the association of independent variables with WTP, with the P-value set as 0.05. The Heckman selection model was employed in the estimation of the mean WTP, to account for a selection bias due to data clumping at zero. In Heckman’s two-step approach, the probability of observing a positive WTP was predicted by a binary Probit model in the first step, while in the second step, a quantile regression on the observations above zero WTP was estimated.34
Results
A total 510 households were approached, and 347 households (68.04%) participated in this survey. The respondents’ sociodemographic data are summarized in Tables 1 and 2. Through a cross-comparison of Malaysia’s population with Penang’s population, it was noted that the results for age, sex, and employment status were very similar but ethnicity and marital status were not. In this survey, it was noted that n=124 (35.7%) of the respondents were over 51 years of age. A total n=177 (51%) of the respondents were Chinese, and the majority of the respondents (n=253 [72.9%]) were married. Of the 347 respondents in this study, 106 (30.5%) earned an estimated monthly household income of MYR 2,001 to MYR 4,000. In the valuation of the respondents’ current health statuses using the VAS, the mean current health status of the respondents was found to be 76.06, with a standard deviation (SD) of 14.64.
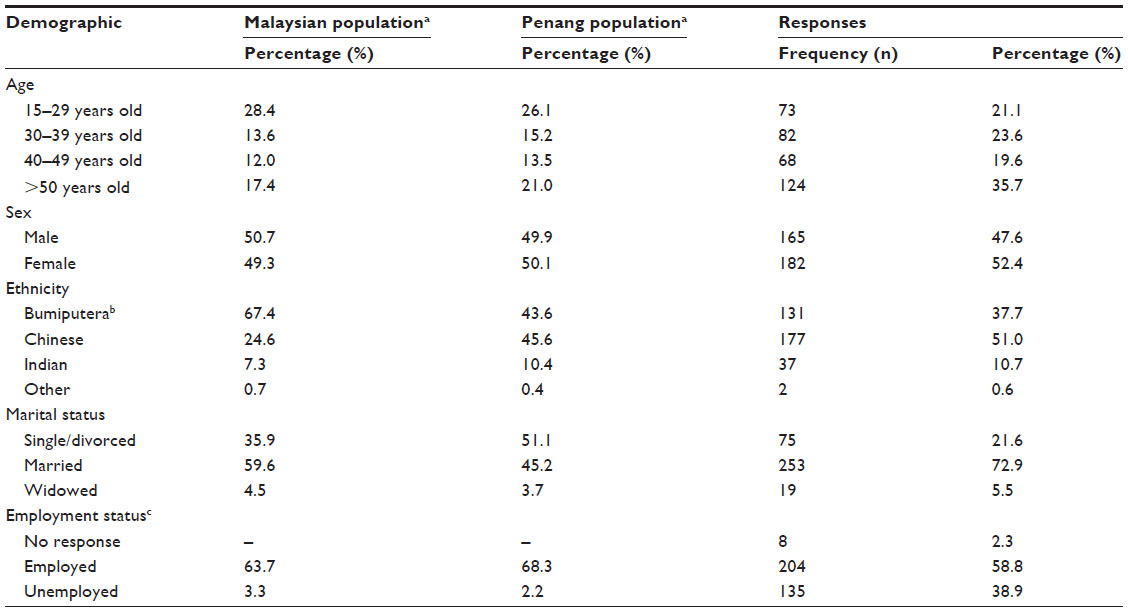 | Table 1 Comparison of respondents’ sociodemographic information for the Penang and Malaysian populations |
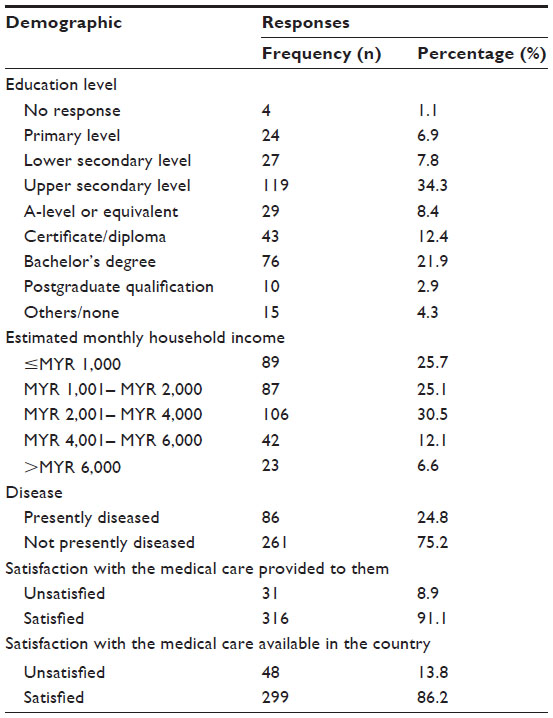 | Table 2 Further description of respondent characteristics |
The descriptive statistical analysis showed that 152 respondents were not willing to pay any amount for the treatment in the given scenario. The reasons given for not being willing to pay are presented in Table 3. From the reasons provided, affordability (n=45 [29.6%]) was the main concern affecting the respondents’ WTP. Some of the respondents claimed that they could not afford any additional treatment costs, due to financial constraints. There were also some respondents (n=5 [3.3%]) who felt that the treatment cost should be covered by the government or insurance companies.
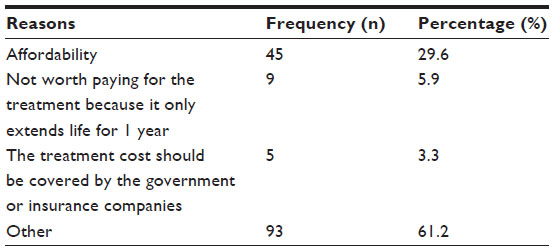 | Table 3 Summary of the reasons for not being willing to pay |
Excluding all zero WTP values, we performed a preliminary analysis and noted that the mean value of WTP/QALY was estimated to be MYR 53,629, or approximately USD 17,000 (MYR 3.2≈USD 1), with an SD of MYR 106,805. The minimum and maximum results for WTP for an additional QALY were MYR 20 (~USD 6) and MYR 1,000,000 (~USD 310,000), respectively, with a median value of MYR 20,000 (25th percentile = MYR 5,000; 75th percentile = MYR 40,000) (Figures 2 and 3). However, we also found that the mean WTP/QALY value was MYR 30,137 (SD = MYR 84,297) when we included the positive WTP values together with all of the zero values.
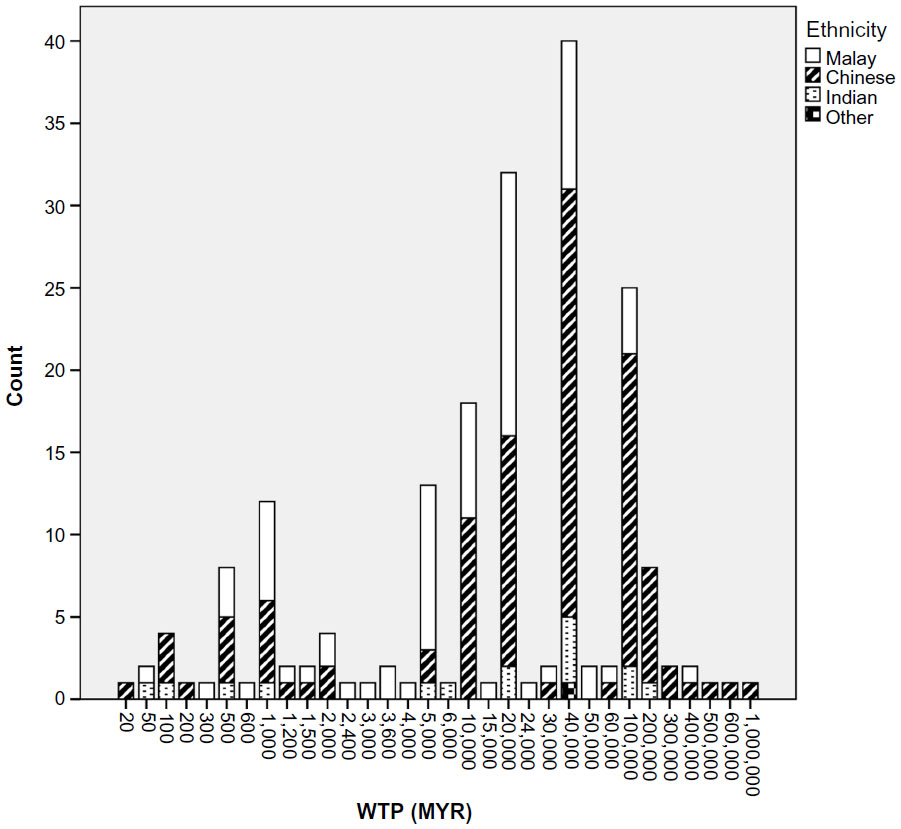 | Figure 2 Representation of minimum and maximum WTP amounts based on ethnicity. |
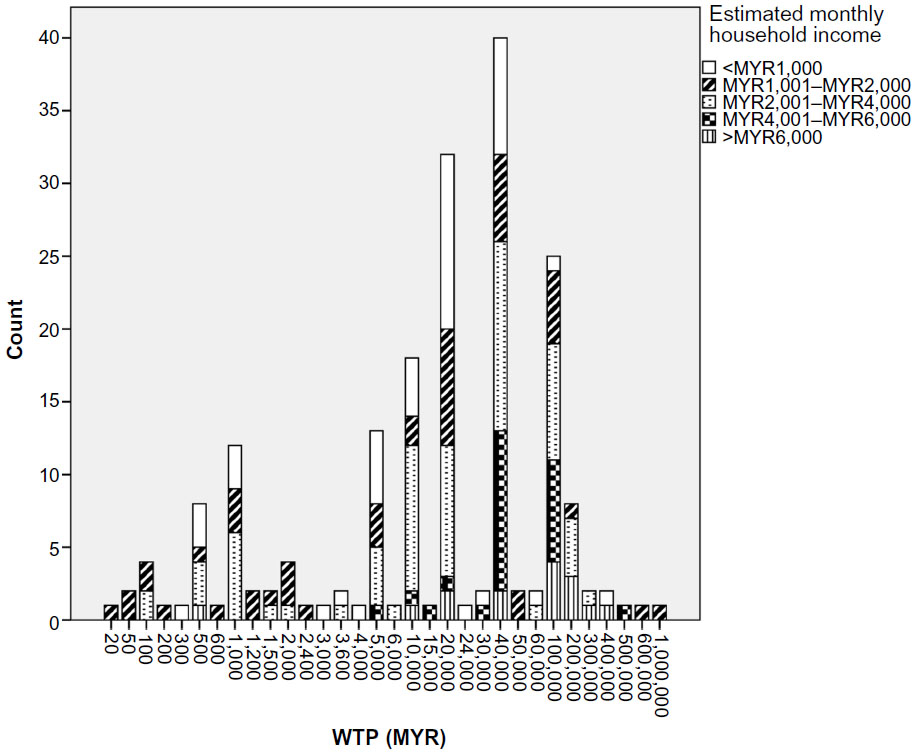 | Figure 3 Representation of minimum and maximum WTP amounts, based on estimated monthly household income. |
By fitting all of the observations using the Heckman selection model, the estimated mean WTP for a QALY value was found to be MYR 29,080 (~USD 9,000). The Probit estimation results from the Heckman selection model (Table 4) showed that the respondents’ visual analog scores and current disease statuses significantly affected their WTP. From the second-stage regression estimate of the model, it was found that respondents who had incomes more than MYR 6,000 or who were of Chinese ethnicity were more likely to elicit a higher WTP amount.
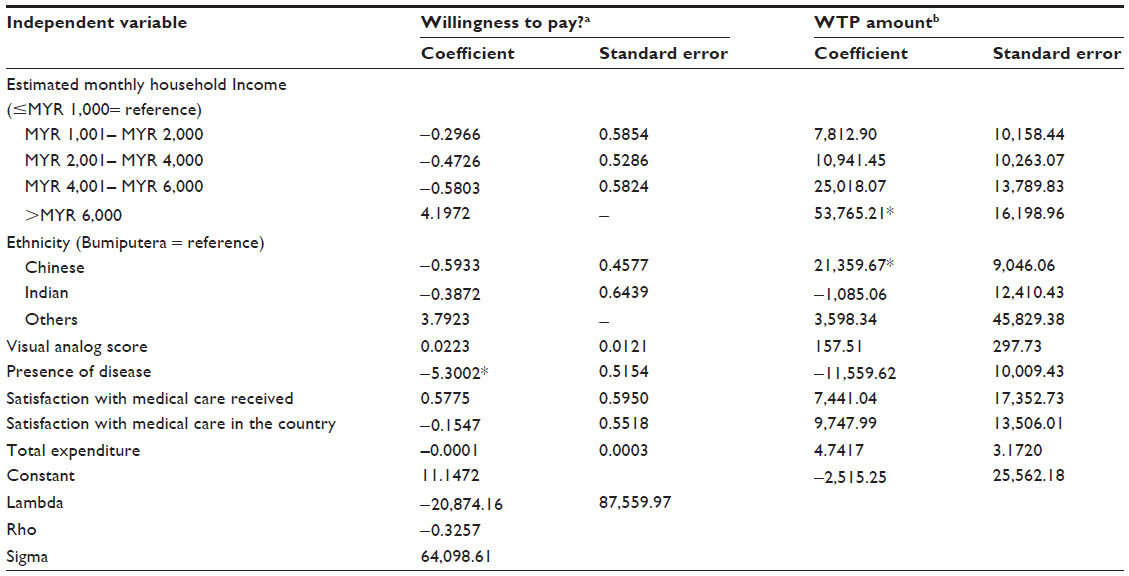 | Table 4 Estimated coefficients of the Heckman selection model for WTP/QALY |
Discussion
For a long time, many studies in Malaysia employed the threshold value recommended by the WHO in the “CHOosing Interventions that are Cost-Effective” (CHOICE) project, which uses GDP per capita as an indicator.20,21 Following this recommendation, any new intervention would be considered cost-effective if it were below the recommended value of three times the GDP per capita threshold of MYR 66,704 (USD 20,845).21 Many policymakers and local researchers are still using this arbitrary threshold as a reference when making decisions, though the value is over 10 years old. Based on this problem, this study was performed with the intention of finding an empirical threshold value for Malaysia. Moreover, the acceptance of the WHO-recommended threshold value remains controversial because it depends on the robustness of the assumptions behind the estimation of the regional GDP per capita. In addition, the use of such a generalized threshold value may not be entirely relevant in every country as different countries may have distinct sociodemographic and disease burdens, despite having similar GDPs per capita. In using GDP per capita as an indicator, a nation’s average wealth does not necessarily indicate the state of wealth of every member of society. For example, the incomes of some individuals in rural areas may remain low, although they live in high-income countries, and may not fairly represent a nation’s wealth.35 In this case, these individuals may have a different WTP from the average. Thus, the validation method suggested by CHOICE may only be relevant for countries that have a fairly even distribution of wealth.
Rather than applying arbitrary decision rules, such as league tables or proposed ICER thresholds, without actual societal representation, it may be more reasonable to allocate health care resources based on actual societal WTP for health care benefits.27 We found that the cost-effectiveness threshold value estimated in this study was lower than the value recommended by the WHO. This finding is consistent with that of King et al,27 in whose study the WTP/QALY ratios, calculated using preference-based data collected from a population, were lower than the proposed cost-effectiveness threshold. The person trade-off technique for evaluating health benefits has been proposed as one way to address the trade-off that may exist between efficiency and equity. Social welfare is characterized by a spectrum of individualized welfares. Economists have typically argued that individuals are the best judges of their own well-being and that social welfare depends only on the welfare of individuals in society.36,37 It is also defined as the utilitarian concept of the sum of individual happiness, where individual utilities are aggregated in a direct and transparent manner.36 In our study, both the numerator (WTP) and denominator (calculated QALY) were obtained from respondents in the general population and should indicate actual societal preferences.
In the preliminary analysis of the estimation of the WTP for an additional QALY, 152 zero WTP cases were removed. This may contribute to “outlier” WTP/QALY values. The mean WTP/QALY values would be considerably higher due to the exclusion of the zero WTP values. On the contrary, the mean WTP/QALY value was noted to be low when all of the values were included. Here, the application of the Heckman selection model is important in the analysis of mean WTP/QALY values, where only “protestors” were excluded. The capabilities of the Heckman selection model, which range from specifying a selection function to obtaining an estimate for the bias term, make it an intuitive, appealing tool that can be used to correct for the selection bias problem. The value estimated by the Heckman selection eliminates the sample selection bias that arises from the specification error of the zero data.34 In the reported Heckman model, a rho value of –0.3257 and a statistically significant likelihood ratio test indicates correlation between the two-part model and the presence of selection. This procedure has the advantage of minimizing skewed outcome distributions, which is robust against potential outliers. Additionally, it tends to model two independent decisions that may display distinct effects on the different dependent variables being considered. The quantile regression’s ability to give a more complete description of the impact of covariates on the outcome distribution, by analyzing different quantiles, adds to the appeal of using this procedure in exploring the analysis.33 As a result, the Heckman selection model is preferred because it gives a better estimated value of WTP/QALY.
Examining the results, the WTP amounts were significantly affected by ethnicity. Malaysia is a unique multiracial nation whose predominant ethnic groups are Bumiputera (67.4%), Chinese (24.6%), and Indian (7.3%). Different ethnicities have biological, demographic, and social environment differences as well as differences in psychological and behavioral characteristics, all of which contribute to one’s health. Differences in sociocultural beliefs among different races may affect various forms of self-care and eventually affect health outcomes.38 Chinese respondents, with different beliefs and cultural backgrounds, may contribute to the significant difference in their beliefs about paying for health care, as demonstrated by their WTP results. After adjustments, it was found that Chinese respondents, on average, offered an additional MYR 21,339 per QALY gained relative to other ethnic groups. Such diversity in the sociodemographic characteristics in Malaysia suggests that the generalized regional WTP/QALY value based on three times the GDP per capita, as recommended by the WHO, may not be entirely appropriate.
In addition, estimated monthly household income was found to be significantly associated with the WTP results. According to the Malaysia Household Income and Basic Amenities Survey Report,39 the mean household income in Malaysia is MYR 4,025 per month. Individuals with incomes below MYR 2,000 can be considered a low-income group, while those with incomes of MYR 6,000 or higher are categorized as a high-income group. Respondents with different income levels may have different perceptions toward the interventions provided. Logically, within the context of WTP, those with greater wealth have a greater ability to pay.27,40 Some research has assessed the reciprocal relationship between income and health status and found that individuals with better health have more household income than individuals with poor health.38,41 In this study, respondents’ income statuses were found to be positively related to their magnitude of WTP/QALY; thus, the internal validity of this CV survey is ensured. As we move through the income scale, respondents with income more than MYR 6,000 on average paid an additional MYR 53,788 after adjustment.
A few limitations were identified in this study. First, the use of just a single scenario might not be practical and illustrative in eliciting WTP amounts for the determination of WTP per QALY values. The design was based on the notion of “A QALY is a QALY is a QALY”, implying that all QALYs have the same value. QALY serves as a measure of health and is a unit on a value function scale.42 For instance, 2 years at a quality of 0.5 is judged as equivalent to 1 year at a quality of 1.0. Using weight as another example, the weight of 1 kg of apples is equivalent to the weight measuring 1 kg of watermelon, regardless of the size of the fruits. However, some studies have found that the valuation of WTP might be different in the cases of chronic diseases or when respondents are faced with death.3 For instance, in a study by Thavorncharoensap et al, the value of a QALY varies depending on treatment and prevention scenarios and the health condition under consideration.43 In the EuroVaQ project, it was found different people do not attach equal value to QALYs for example, a QALY gained in a person who is severely ill may be valued differently than a QALY gained in a person who is only mildly ill.29 Therefore, we intend to explore these issues in future studies.
Second, the results in this study only accounted for the valuation by Penang’s population, where Penang is just one of the 13 states in Malaysia. Although the sociodemographic characteristics of respondents in this survey were marginally comparable with those of the Penang population,30 it has an overrepresentation of Chinese respondents, despite the fact that the predominant ethnic group in Malaysia is Bumiputera. However, again, this study serves as our first attempt to determine a validated cost-effectiveness threshold for Malaysia. Furthermore, we noted that some of the sociodemographic questions were not answered. This may be due to the nature of elderly respondents in answering questionnaires, as some of them have no formal education. This issue will be addressed in the inclusion criteria for our future studies, where we plan to have an age limit of 60 years. Last but not least, convenience sampling was performed in this study in the absence of a population-level sampling frame. More rigorous population sampling, such as multistage stratified cluster sampling using data derived from computerized household lists from Malaysia’s Department of Statistics census, should be applied in future studies.
Conclusion
The WTP for an additional QALY gained among respondents in Penang, Malaysia was estimated to be MYR 29,080 (~USD 9,000). Among the independent variables, ethnicity and income level are key elements that affect WTP responses. It is crucial to obtain the social value of a QALY from the perspectives of the public as different beneficiaries of health care have differing values of a QALY, due to variations in sociodemographic factors. The findings from this study will provide empirical evidence for the determination of the cost-effectiveness threshold in Malaysia and, in turn, facilitate the development of health technology assessment for the country.
Acknowledgments
The authors would like to thank Universiti Sains Malaysia for the financial support from the Accelerated Program for Excellence (APEX) Delivering Excellence Grant. Additionally, the authors extend their gratitude to Shiroiwa et al for their permission to use the health state scenario as one of the research instruments in this study.
Disclosure
The authors report no conflicts of interest in this work.
References
Drummond MF, Sculpher MJ, Torrance GW, O’Brien BJ, Stoddart GL. Methods for the Economic Evaluation of Health Care Programmes. 3rd ed. New York, NY: Oxford University Press; 2005. | |
Robinson R. Cost-utility analysis. BMJ. 1993;307(6908):859–862. | |
Shiroiwa T, Sung YK, Fukuda T, Lang HC, Bae SC, Tsutani K. International survey on willingness-to-pay (WTP) for one additional QALY gained: what is the threshold of cost effectiveness? Health Econ. 2010;19(4):422–437. | |
Appleby J, Devlin N, Parkin D. NICE’s cost effectiveness threshold. BMJ. 2007;335(7616):358–359. | |
Barnieh L, Manns B, Harris A, et al. A synthesis of drug reimbursement decision-making processes in organisation for economic co-operation and development countries. Value Health. 2014;17(1):98–108. | |
Lim TO, Lim YN, Wong HS, et al. Cost effectiveness evaluation of the Ministry of Health Malaysia dialysis programme. Med J Malaysia. 1999;54(4):442–452. | |
Goh KL, Cutler A, Chua AB, et al. Optimal treatment for duodenal ulcer disease: a cost-decision analysis in Malaysian patients. J Gastroenterol Hepatol. 1999;14(1):32–38. | |
Loo CY, Kandiah M, Arumugam G, et al. Cost efficiency and cost effectiveness of cataract surgery at the Malaysian Ministry of Health ophthalmic services. Int Ophthalmol. 2004;25(2):81–87. | |
Price N, Davey P, Birinyi-Strachan L. The cost-effectiveness of olanzapine for the treatment of schizophrenia in Malaysia. Malaysian Journal of Psychiatry. 2005;13(1):53–62. | |
Hooi LS, Lim TO, Goh A, et al. Economic evaluation of centre haemodialysis and continuous ambulatory peritoneal dialysis in Ministry of Health hospitals, Malaysia. Nephrology (Carlton). 2005;10(1):25–32. | |
Cheah IG, Soosai AP, Wong SL, Lim TO; Cost-Effectiveness NICU Study Group. Cost-effectiveness analysis of Malaysian neonatal intensive care units. J Perinatol. 2005;25(1):47–53. | |
Hassali MAA, Mohamed Ibrahim MI, Syed Sulaiman SA, et al. A clinical and economic study of community-acquired pneumonia between single versus combination therapy. Pharm World Sci. 2005;27(3):249–253. | |
Rizal AM, Enna MH, Aljunid SM, Rohana AG, Soehardy Z, Norella CTK. Cost-effectiveness analysis of continuous venovenous hemofiltration therapy in the treatment of sepsis in Hospital Universiti Kebangsaan Malaysia: a comparison between high volume and standard dose hemofiltration. Malaysian Journal of Community Health. 2006;12(1):1–8. | |
Ibrahim MI, Abdullah M, Naing L, Abdullah JM, Idris Z, Aljunid SM. Cost effectiveness analysis of using multiple neuromodalities in treating severe traumatic brain injury in a developing country like Malaysia. Asian J Surg. 2007;30(4):261–266. | |
Annemans L, Demarteau N, Hu S, et al. An Asian regional analysis of cost-effectiveness of early irbesartan treatment versus conventional antihypertensive, late amlodipine, and late irbesartan treatments in patients with type 2 diabetes, hypertension, and nephropathy. Value Health. 2008;11(3):354–364. | |
Alefan Q, Ibrahim MIM, Razak TA, Ayub A. Cost-effectiveness of antihypertensive treatment in Malaysia. Malaysian Journal of Pharmaceutical Sciences. 2009;7(2):137–152. | |
Ezat SW, Aljunid S. Comparative cost-effectiveness of HPV vaccines in the prevention of cervical cancer in Malaysia. Asian Pac J Cancer Prev. 2010;11(4):943–951. | |
Aljunid S, Abuduxike G, Ahmed Z, Sulong S, Nur AM, Goh A. Impact of routine PCV7 (Prevenar) vaccination of infants on the clinical and economic burden of pneumococcal disease in Malaysia. BMC Infect Dis. 2011;11:248. | |
Dranitsaris G, Truter I, Lubbe MS, Sriramanakoppa NN, Mendonca VM, Mahagaonkar SB. Using pharmacoeconomic modelling to determine value-based pricing for new pharmaceuticals in Malaysia. Malays J Med Sci. 2011;18(4):32–43. | |
WHO Commission on Macroeconomics and Health. Macroeconomics and Health: Investing in Health for Economic Development. Geneva: World Health Organization; 2001. | |
who.int [homepage on the Internet]. Cost-effectiveness thresholds. World Health Organization; 2005 [cited February 7, 2013]. Available from: http://www.who.int/choice/costs/CER_thresholds/en/index.html. Accessed August 9, 2014. | |
Neumann PJ, Greenberg D, Olchanski NV, Stone PW, Rosen AB. Growth and quality of the cost-utility literature, 1976–2001. Value Health. 2005;8(1):3–9. | |
Fang C, Otero HJ, Greenberg D, Neumann PJ. Cost-utility analyses of diagnostic laboratory tests: a systematic review. Value Health. 2011;14(8):1010–1018. | |
Pharmaceutical Services Division. Pharmacoeconomic Guideline for Malaysia. Putrajaya: Ministry of Health Malaysia; 2012. | |
Food and Agriculture Organization Information Division. Applications of Contingent Valuation Method in Developing Countries: A Survey. Rome: Food and Agriculture Organization, United Nations; 2000. | |
Hoyos D, Mariel P. Contingent valuation: past, present and future. Prague Economic Papers. 2010;4:329–343. | |
King JT, Tsevat J, Lave JR, Roberts MS. Willingness to pay for a quality-adjusted life year: implications for societal health care resource allocation. Med Decis Making. 2005;25(6):667–677. | |
Bobinac A, Van Exel NJ, Rutten FF, Brouwer WB. Willingness to pay for a quality-adjusted life-year: the individual perspective. Value Health. 2010;13(8):1046–1055. | |
Donaldson C, Baker R, Bell S, et al. European Value of a Quality Adjusted Life Year – Final Publishable Report. Newcastle: Newcastle University; 2010. Available from: http://research.ncl.ac.uk/eurovaq/EuroVaQ_Final_Publishable_Report_and_Appendices.pdf. Accessed November 18, 2012. | |
Department of Statistics, Malaysia. Population distribution and basic demographic characteristics 2010. Putrajaya: Department of Statistics Malaysia; 2011. Available from: http://www.statistics.gov.my/portal/download_Population/files/census2010/Taburan_Penduduk_dan_Ciri-ciri_Asas_Demografi.pdf. Accessed September 18, 2014. | |
VanVoorhis CRW, Morgan BL. Understanding power and rules of thumb for determining sample sizes. Tutor Quant Methods Psychol. 2007;3(2):43–50. | |
EuroQol Group. EuroQol – a new facility for the measurement of health-related quality of life. Health Policy. 1990;16(3):199–208. | |
Ahlert M, Breyer F, Schwettmann L. What You Ask is What You Get: Willingness-to-Pay for a QALY in Germany [CESifo Working Paper No 4239]. Munich: CESifo; 2013. | |
Heckman JJ. Sample selection bias as a specification error. Econometrica. 1979;47(1):153–161. | |
Decision Support Unit, National Institute for Health and Clinical Excellence. Briefing paper for the Methods Working Party on the Cost Effectiveness Threshold. London: National Institute for Health and Clinical Excellence; 2007. | |
Dolan P. The measurement of individual utility and social welfare. J Health Econ. 1998;17(1):39–52. | |
Berger ML, Bingefors K, Hedblom EC, Pashos CL, Torrance GW, Dix Smith M. Health Care Cost, Quality, and Outcomes. Lawrenceville, NJ: International Society for Pharmacoeconomics and Outcomes Research (ISPOR); 2003. | |
Haron SA, Sharpe DL, Masud J, Abdel-Ghany M. Health divide: economic and demographic factors associated with self-reported health among older Malaysians. J Fam Econ Iss. 2010;31(3):328–337. | |
Department of Statistics Malaysia. Household Income and Basic Amenities Survey Report. Putrajaya: Department of Statistics, Malaysia; 2009. | |
Costa-Font J, Rovira-Forns J. Who is willing to pay for long-term care insurance in Catalonia? Health Policy. 2008;86(1):72–84. | |
Smith JP, Kington RS. Race, socioeconomic status and health in late life. In: Martin LG, Soldo BJ, editors. Racial and Ethnic Differences in Health of Older Americans. Washington, DC: National Academic Press; 1997:106–162. | |
Weinstein MC. A QALY is a QALY is a QALY – or is it? J Health Econ. 1988;7:289–290. | |
Thavorncharoensap M, Teerawattananon Y, Natanant S, Kulpeng W, Yothasamut J, Werayingyong P. Estimating the willingness to pay for a quality-adjusted life year in Thailand: does the context of health gain matter? Clinicoecon Outcomes Res. 2013;5:29–36. | |
Department of Statistics, Malaysia. Labour force survey report, Malaysia 2011. Putrajaya: Department of Statistics Malaysia; 2012. Available from: http://www.statistics.gov.my/portal/download_Labour/files/labour_force/Laporan_Penyiasatan_Tenaga_Buruh_Malaysia2011.pdf. Accessed September 18, 2014. |
 © 2014 The Author(s). This work is published and licensed by Dove Medical Press Limited. The
full terms of this license are available at https://www.dovepress.com/terms
and incorporate the Creative Commons Attribution
- Non Commercial (unported, 3.0) License.
By accessing the work you hereby accept the Terms. Non-commercial uses of the work are permitted
without any further permission from Dove Medical Press Limited, provided the work is properly
attributed. For permission for commercial use of this work, please see paragraphs 4.2 and 5 of our Terms.
© 2014 The Author(s). This work is published and licensed by Dove Medical Press Limited. The
full terms of this license are available at https://www.dovepress.com/terms
and incorporate the Creative Commons Attribution
- Non Commercial (unported, 3.0) License.
By accessing the work you hereby accept the Terms. Non-commercial uses of the work are permitted
without any further permission from Dove Medical Press Limited, provided the work is properly
attributed. For permission for commercial use of this work, please see paragraphs 4.2 and 5 of our Terms.