Back to Journals » Patient Preference and Adherence » Volume 16
Exploring the Gap Between Patients’ Expectations and Perceptions of Healthcare Service Quality
Authors A'aqoulah A ![]() , Kuyini AB, Albalas S
, Kuyini AB, Albalas S
Received 9 February 2022
Accepted for publication 30 March 2022
Published 23 May 2022 Volume 2022:16 Pages 1295—1305
DOI https://doi.org/10.2147/PPA.S360852
Checked for plagiarism Yes
Review by Single anonymous peer review
Peer reviewer comments 2
Editor who approved publication: Professor Qizhi (Cathy) Yao
Ashraf A’aqoulah,1,2 Ahmed Bawa Kuyini,3 Samir Albalas4
1Department of Health Systems Management, College of Public Health and Health Informatics, King Saud Bin Abdulaziz University for Health Sciences, Riyadh, Saudi Arabia; 2King Abdullah International Medical Research Centre, Riyadh, Saudi Arabia; 3Social Work Department, School Global Urban and Social Studies, RMIT University, Melbourne, Australia; 4Department of Basic Medical Sciences, Faculty of Medicine, Yarmouk University, Irbid, Jordan
Correspondence: Ashraf A’aqoulah, Department of Health Systems Management, College of Public Health and Health Informatics, King Saud bin Abdulaziz University for Health Sciences, Riyadh, Saudi Arabia, Tel +966 11 4295415, Email [email protected]
Purpose: This study aimed to explore the gap between patients’ expectations of healthcare service quality in Jordanian hospitals against their perceptions of service received using SERVQUAL model.
Methods: The study used a cross-sectional design. The study data were collected randomly from 415 patients (participants) who completed the SERVEQUAL questionnaire. The data were analyzed using statistical procedures such as descriptive, t-test, and ANOVA.
Results: The results showed that there is a gap between mean score of patients’ expectations of what should be available in the hospital and patients’ perceptions of the service received in the hospital. Patients’ expectations were higher than their perceptions on all five SERVQUAL domains (Tangibles, Reliability, Responsiveness, Assurance, and Empathy).
Conclusion: Hospital managers should take necessary actions to improve healthcare services in their hospitals with respect to all SERVQUAL domains. These actions should be directed to reduce the gap between patients’ expectation and their perceptions in order to provide services meet patients’ needs.
Keywords: patients’ expectations, patients’ perceptions, healthcare services quality, hospitals
Introduction
One of the main benchmarks for hospitals is quality of service based on patients’ satisfaction.1 Not only is this important in terms of professional obligations but also patient wellbeing and organizational reputation. In the current globalized world with increased focus on markets, profits and competition, quality is all the more important for the survival of health service providers. In this sense, Eshghi, Roy and Ganguli (2008) defined quality as the overall evaluation of service quality based on customers’ perception or the extent that a service meets their expectations or needs.2 Gronroos (2016) on his part mentioned a two-dimensional model of service quality. The first model is Technical (outcome) quality, which refers to the outcome of the service performance; and the second is Functional (process) quality, which refers to the manner in which the service is delivered.3
Service quality has become a cornerstone for high performing hospitals, as they need to maximize resource use, survive, and compete against other hospitals. Assessing quality is essential for determining obstacles that hinder quality improvement so that hospitals can address these obstacles and enhance services.4 Many researchers confirm a positive relationship between quality and patients’ satisfaction and this relationship encourages hospitals to assess and improve the quality of their services.2,5 Thus, hospitals need to be conscious of quality and adopt new ways, including technology and engaging highly qualified professionals, as part of the tangible service quality measures to manage minor or major errors and achieve excellent standards.6 Patients expect service without errors from hospitals, and as a result, hospitals generally endeavor to provide services in line with objective standards of quality. However, these services might not always meet patients’ expectations, and this implies that patients’ expectations are important in assessing service quality. Indeed, patients these days have enough knowledge to assess service quality based on comparing a hospital’s service with that of other hospitals. Therefore, hospitals would benefit from a clear awareness and consciousness about patients’ perceptions and expectations of their services.
In the health services management sector, assessing quality of services has been a vital topic of research as a response to the need for systematic evaluation of services from the patient’s perspective. Researchers have used different measures to assess service quality in different countries. While some studies have either used measures based on the technical (outcome) or functional (process) dimension of quality, others have used a combination of the two (technical and functional) dimensions. Some studies have used the technical (outcome) quality of the service-delivery process.7–9 Other studies have used the functional quality.10–13 The SERVQUAL Scale, which is the focus of the current research, is based on functional quality (the delivery process) rather than technical quality (the outcome of the service encounter) and has been used in relation to hospital care and other service areas.14
Using SERVQUAL in Different Sectors
The SERVQUAL is considered a comprehensive measure to assess expected and perceived quality of services.15 Parasuraman et al, who developed the SERVQUAL, considered service quality in different sectors as the gap between customers’ expectations of service quality and perception of their service quality.14 They believed that the SERVQUAL model is valid for a variety of services in different fields and some previous studies relied heavily on this model in assessing the quality of services. Gilbert, Veloutsou, Goode, and Moutinho (2004) stated that the SERVQUAL model is more aligned to the identification of patients’ expectations rather than what patients actually experienced in service delivery. Researchers have used SERVQUAL in its original format or modified it to be more suitable for use in different contexts/sectors.16 For example, in banks, in transport services, in business-to-business services, in Campus Career Services Centers, in restaurants, in historic houses and in lodging index.7,9–13
Research on Patients’ Expectations of Service Quality in Health Services
Healthcare quality is the degree to which health services increase the likelihood of desired health outcomes.17 The quality of healthcare service is very complicated when compared with other services because healthcare services involve significant risk.18 Numerous studies have employed the SERVQUAL directly or with some modifications to assess the quality of healthcare service. As expected, the findings differ with respect to context, the domains that are prominent as meeting or not meeting expectations, and the particular influences of demographic variables. The following are some of the findings of such studies.
Tomes and Cheng Peng Ng (1995) assessed in-patient perceptions of healthcare quality in the United Kingdom. They built a scale for measuring service quality in hospitals based on patients’ perceptions. The study results found the main intangible factors: understanding of illness, relationship of mutual respect, empathy, dignity and religious needs, along with food and physical environment factors. Moreover, patients’ perceptions met or exceeded expectations in respect of main intangible factors.19
In Jordan, Ayaad and other researchers (2019) examined the difference in the quality of healthcare service between electronic medical records and paper-based record hospitals. The researchers explored that the perceptions and expectations of healthcare services quality in the hospitals that rely on electronic medical records in serving patients were higher than the quality health services in the hospitals that rely on paper-based health records.20 In Taiwan, Bao-Lin and other researchers (2019) identified the gaps between expectation and the perception of quality of healthcare services in the care of prolonged mechanical ventilation. The result showed clear similarity in the mean scores of the SERVQUAL measure for expectations and perceptions.21 In Malaysia, Zun, Ibrahim, and Hamid (2018) evaluated the level of patient satisfaction with care and its associated factors using the SERVQUAL. They found that most of the patients were not satisfied with the quality of healthcare services, as service quality was lower than their expectations.22
On the other hand, Raluca, Madalina, and Lorin (2018) investigated the gap between consumers’ expectations and actual healthcare services received in Romanian. The researchers found that there was a gap between the consumers’ expectations and actual service in favor of consumer expectations.23 Similarly, Nadi, Shojaee, Ghassem, Siamian, Abedini & Rostami (2016) assessed patients’ expectations and perceptions of health services in a variety of hospitals in Iran. Their results showed a clear gap between patients’ perceptions and expectations in favor to patients’ expectations.24 In China, Li and other researchers (2015) examined patients’ perceptions of healthcare service quality at hospitals and found different outcomes in different Chinese cities. Specifically, they found that the perceived healthcare service quality in the Laibin, Guangxi, and Shanghai cities was better than perceived healthcare service quality in the Chongqing and Nanning and Guilin of Guangxi cities.25
It is evident from the available literature that patients’ expectations and perceptions of service quality vary in the different contexts and particular domains of the SERVQUAL measure are more prominent than others in each jurisdiction. In addition, the literature shows that patients’ demographic variables have a diversity of influence on perceptions and expectations. Specifically, there is a documented link between perceptions and expectations of service quality in relation to particular demographic variables such as Past experience in use of health service, Life style, Individual value, Type of patient (in-patient and out-patients), Level of knowledge/education and Frequency of visits.22,25
Context and Issue of Study
Health system in Jordan has improved considerably during the past 20 years. It is recognized as one of the best in the Middle East, and it is considered as a leader in medical tourism.26 The healthcare system in Jordan is an area that is consistently supported by the Government, which aims to increase access and quality to all citizens. As a result, healthcare quality has been improving over the last two decades with increased healthcare funding.27 Despite this, the health system still faces many challenges to high-quality service provision. Some of the challenges in the sector relate to facility and health services funding, insufficient coordination between the public and private health services and the absence of monitoring and auditing healthcare service.24 In addition, there is growing demand for health services with increased population and as public and private health providers compete for the market, there is increased awareness and expectations of patients for effective and better-quality healthcare services.26,27 Consequently, there is need to explore service quality and the gaps in patients’ expectations as a way to inform service provision and strategies for better outcomes. Despite service quality in hospitals becoming the focus of research in Jordan, more attention has been paid to identifying quality obstacles and the role of health information systems in quality of services.20,28 Studies in Jordan have explored the obstacles that hinder quality in high and low performing hospitals and examined the difference in the quality of healthcare service between electronic medical records and paper-based record hospitals.4,20,28 None of these studies focused on the gap between patients’ expectations and their perceptions regarding quality of services. Therefore, this study explores the gap between patients’ expectations and their perceptions based on the SERVQUAL model.
Therefore, this study explores the gap between patients’ expectations and their perceptions based on the SERVQUAL model.
Study Aim and Research Questions
This small-scale exploratory study aimed to explore the gap between patients’ expectations of healthcare service quality in Jordanian hospitals against their perceptions of actual services received by using SERVQUAL model. The model is useful in exploring the gap between patients’ perceptions and their expectations and it is employed in this exploratory study.
Research Questions
- What are the patients’ expectations of healthcare quality services in Jordanian hospitals?
- What are the patients’ perceptions of healthcare quality services received in Jordanian hospitals?
- Are there significant differences between patients’ expectations and perceptions of hospital services?
Methods
This study adopted cross-sectional design involving quantitative methods of data collection as the SERVAQUAL measure aligns well with this methodology. Since the quantitative approach allows for gathering information for a large number of participants and since this study was aiming to survey a large number of people with regard to their expectations and perceptions of service quality, it was deemed most suitable.
Study Population, Participants, Sampling
The study participants were 415 patients who used the outpatients’ clinics in two major Jordanian hospitals. These hospitals were selected because they are run by academic staff and considered unique from many other hospitals. Therefore, people think these hospitals are high performing hospitals and likely to meet their expectations. The participants were made up of 171 males and 244 females. The majority (n = 230, 55%) had a bachelor’s degree qualification. The age range of the participants was from 20 years to over 51 years old (see Table 1).
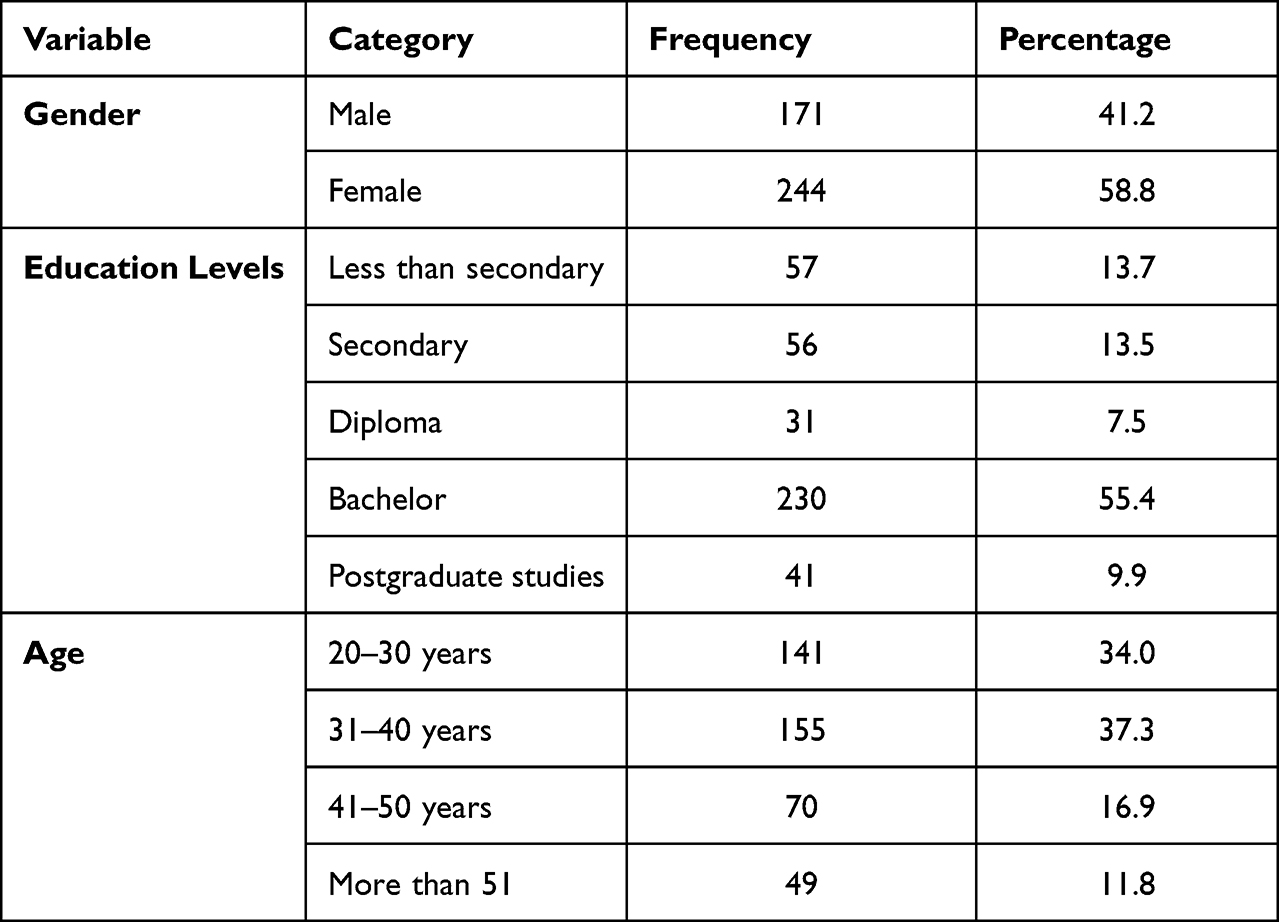 |
Table 1 Frequency and Percentage for Demographic Information |
Using hospital information dissemination systems, information about the study and a request to participate was disseminated to potential participants in the local communities of Amman and Irbid. The study participants were contacted at the participating hospitals and given copies of the questionnaire randomly. This approach was in line with convenience sampling.
Instrument
The study used the SERVQUAL questionnaire for data collection.15 The questionnaire has 21 items about expected services, divided into five dimensions – Tangibility, Reliability, Responsiveness, Assurance, and Empathy. The same 21 items also repeated to assess patients’ perceptions of hospital services. The scale uses a 5-point Likert Scale rating format from 1 (Strongly Disagree) to 5 (Strongly Agree).
To facilitate data collection in Jordan, the SERVQUAL was translated from English to Arabic and reversed translated from Arabic to English by two independent professional translators. This was to ensure that the Arabic SERVQUAL version was translated correctly. In order to ascertain the validity and suitability of the SERVQUAL questionnaire of Arabic culture, it was sent to three experts for review, and a pilot study was conducted with 50 patients in another hospital not part of this study sample.
Data Collection and Analysis
The SERVQUAL Questionnaire along with information about consent and how to participate was distributed to potential participants in the two hospitals. Since participation was anonymous, participants were instructed not to include identifying information and to submit the completed questionnaire to the researchers or a repository in each of the hospitals. The researchers collected the completed QERVOUAL questionnaires at each location days after they were completed by the participants (patients). The number of distributed questionnaires was 500 and the number of returned questionnaires was 415, corresponding to a response rate of 83%.
The data were analyzed using the Statistical Package for Social Scientists (SPSS) program version 25. Before the data analysis, the coding for the negatively worded items of the study questionnaire was reversed, and reliability analysis for the study data was conducted. The analysis showed an alpha of 0.82, which is within the range acceptable for research. After confirming that that measure was reliable, the data were used for further analysis in relation to the research questions. Descriptive statistics procedure was used for assessing mean scores of expectations and perceptions. On the other hand, t-tests and ANOVA were used to explore the relation between items of the questionnaire and participants’ demographic variables.
Results
The results of the study are presented in line with the research questions. First, the descriptive results indicating the perceptions and expectations about service quality are presented. Then, the gap between expectations and perceptions and, finally, the relationship between demographic data and perceptions and expectations scores are presented.
Participants: Distribution of Personal Variables
Table 1 shows frequency distribution for participants’ demographic information. For gender, the percentage of female participants was higher (58.8%) than the percentage of male participants (41.2%). For educational level, most of the participants were bachelor’s degree holders (55.4%). Majority of participants were between the age 31 and 40 years old (37.3%) and the age group with the lowest number of participants was those above 51 years old (11.8%).
Patients’ Expectations About Hospital Services
Table 2 shows means, standard deviation, and rank, for patients’ expectations of what should be available in the hospital for all domains (Tangibles, Reliability, Responsiveness, Assurance, and Empathy). The mean score for all four domains combined is 4.38, and the standard deviation is 0.51. The results show that the Tangible domain has the highest mean score (Mean = 4.45: Standard Deviation = 0.55), followed by Assurance domain (Mean = 4.40: Standard Deviation = 0.65), then Responsiveness domain (Mean = 4.38: Standard Deviation = 0.60), Reliability domain (Mean = 4.35: Standard Deviation = 0.60), and Empathy domain (Mean = 4.32: Standard Deviation = 0.68). In terms of individual items in the Tangible domain, the item “Hospital cleanliness and hygiene should be excellent” (Mean = 4.69) is ranked highest and item “Hospital staff should be pleasant when dealing with patients” (Mean = 4.33) is ranked lowest. In the Reliability domain, the item “Hospital services should be prompt every time” (Mean = 4.46) is ranked highest and item “Patients should receive adequate information about their medical condition” (Mean = 4.26) is ranked lowest. In the Responsiveness domain, the item “Hospital administration staff be efficient at dealing with patients’ queries” (Mean = 4.53) is ranked highest and the item “Hospital reception should answer outside phone calls promptly” (Mean = 4.31) is ranked lowest. Furthermore, in the Assurance domain, the item “Hospital employees should always respect patients’ privacy” (Mean = 4.53) is ranked highest and item “Hospitals should always provide proficient medical staff” (Mean = 4.30) is ranked lowest. Finally, in the Empathy domain, the item “Hospital employees should provide individualized medical attention” (Mean = 4.47) is ranked highest and the item “Patients should be treated with a warm and caring attitude in hospital” (Mean = 4.24) is ranked lowest (see Table 2).
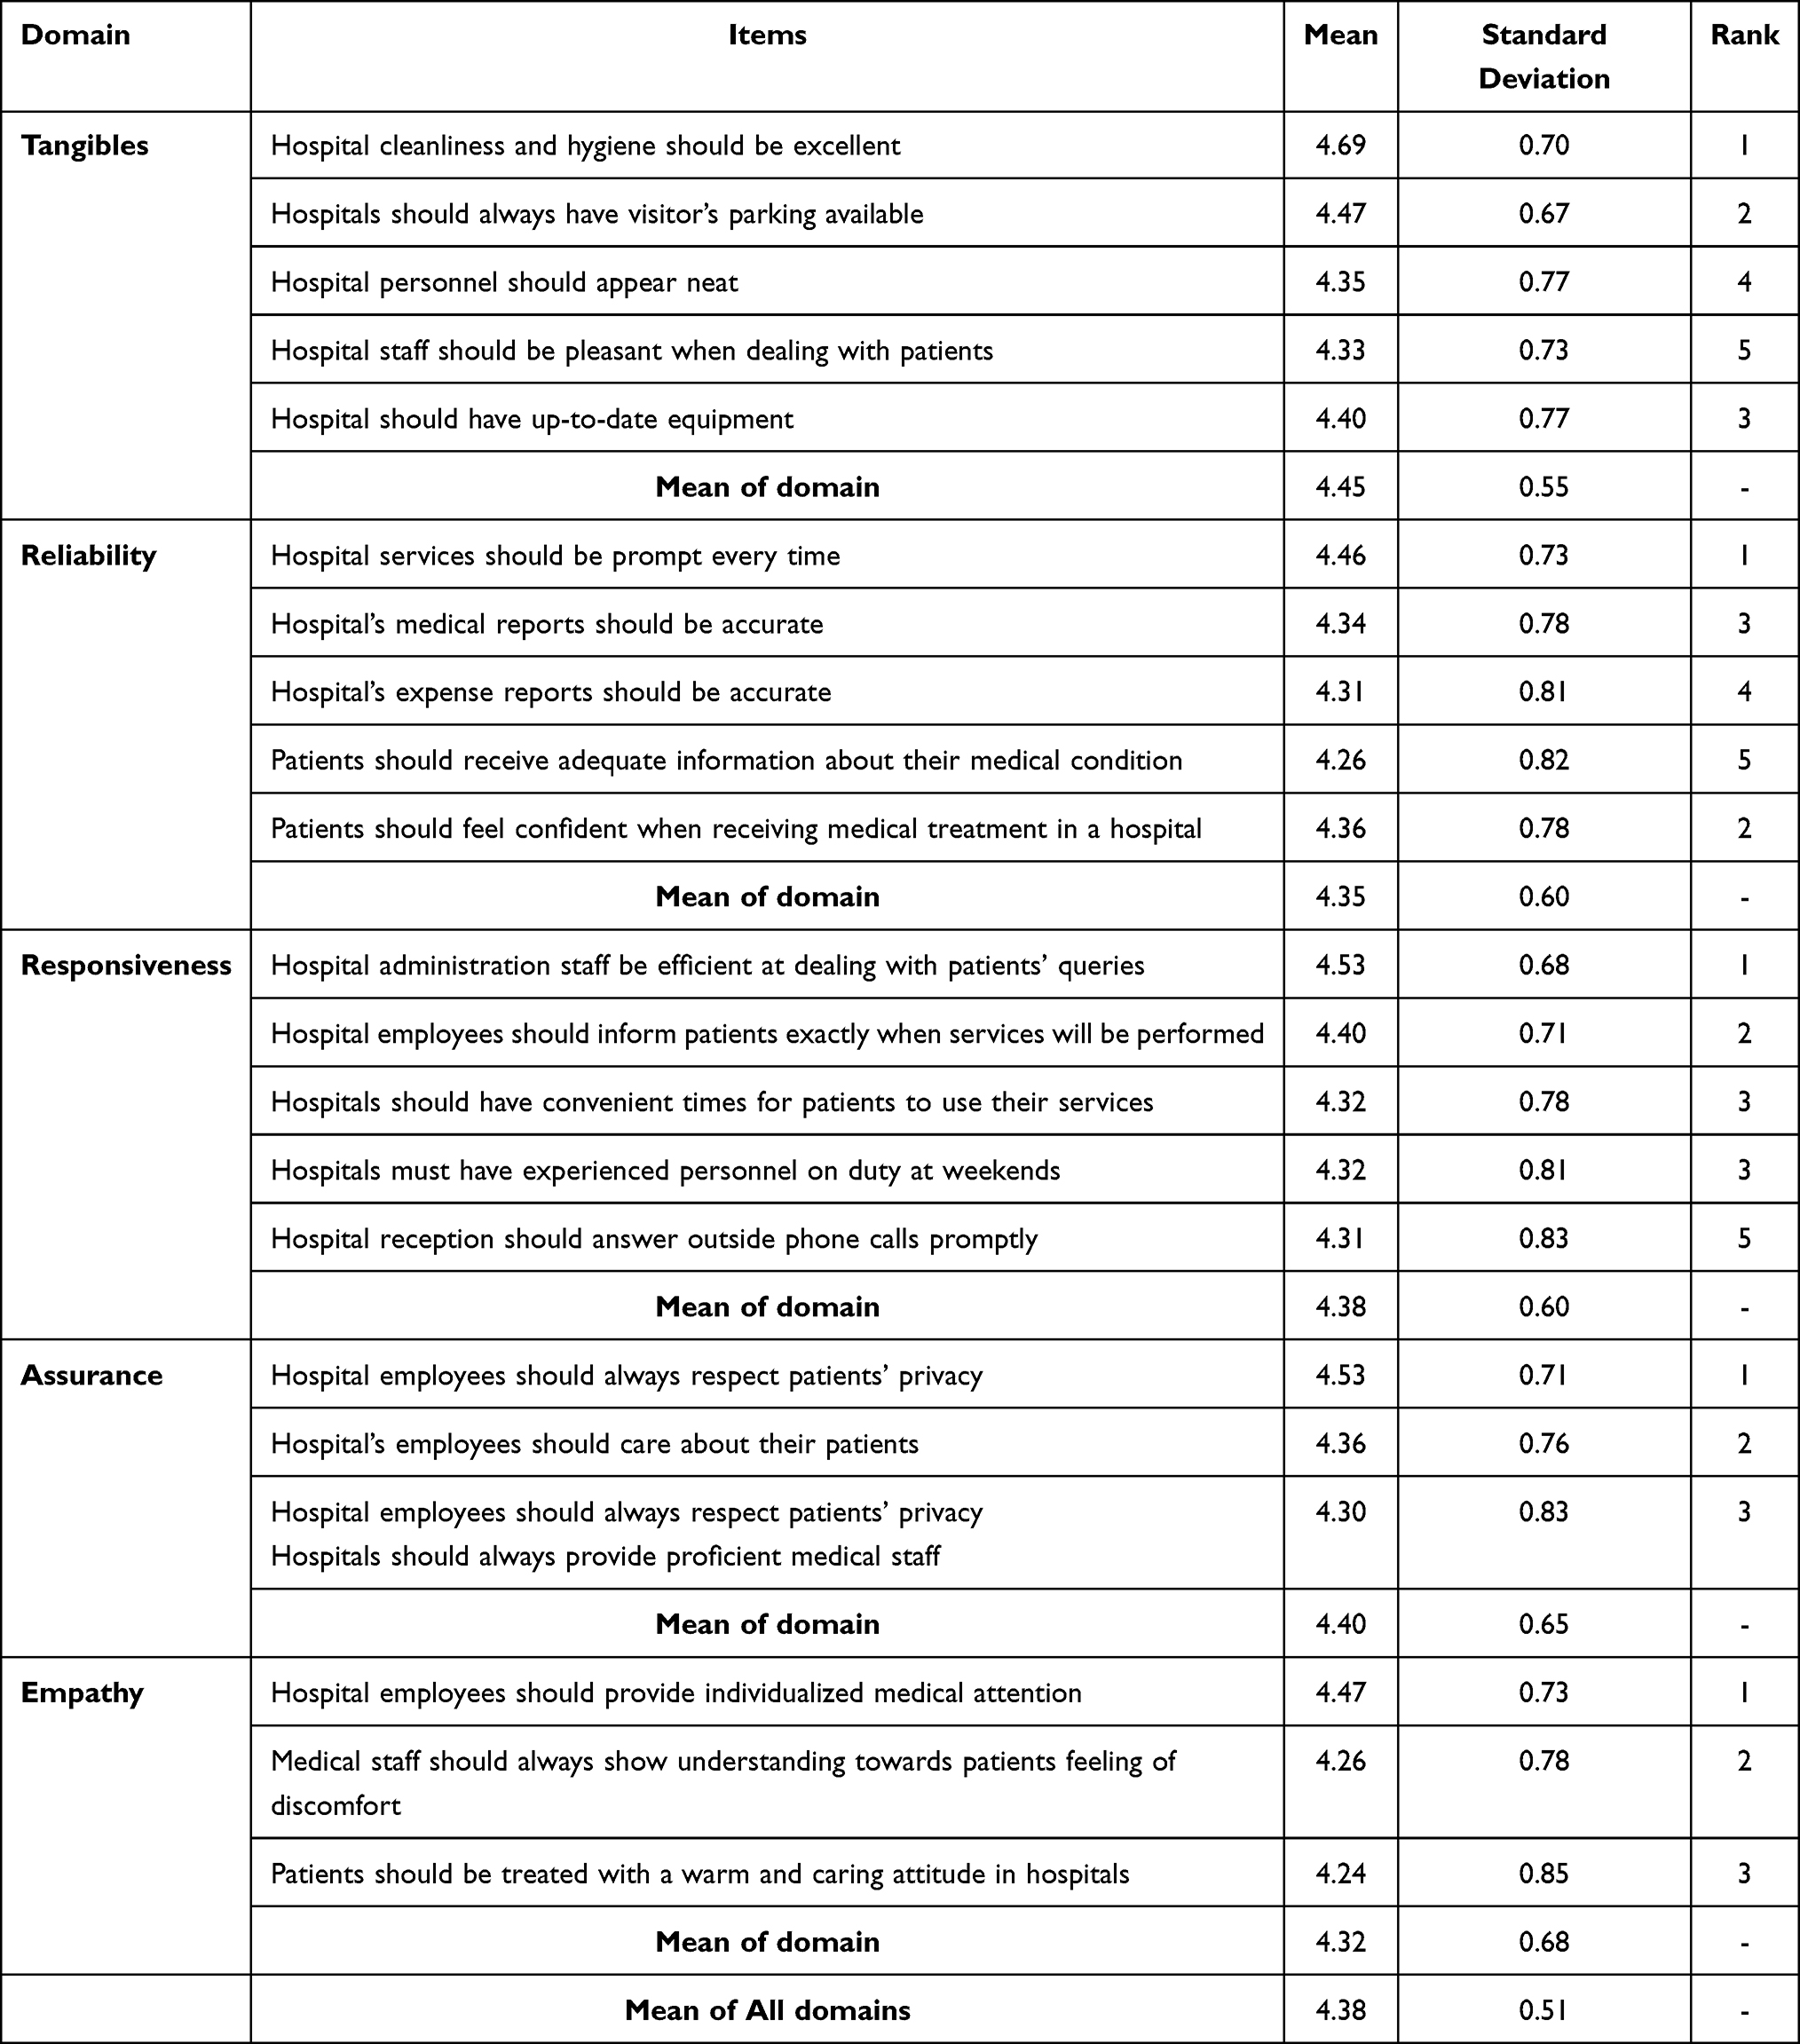 |
Table 2 Descriptive Results: Means, Standard Deviation, and Rank for Patients’ Expectations by Domain |
Patients’ Perceptions About Hospital Services
The results for patients’ perception of hospital services in Table 3 show means, standard deviation, and rank, for patients’ perceptions of the services received (patients’ experiences of services on the ground in the hospital) for all domains of the SERVQUAL measure. The mean score of all domains for patients’ expectations is 3.85, and the standard deviation was 0.83. Tangible domain got the highest mean score. The order of domains based on the mean score was Tangible domain (Mean = 3.95: Standard Deviation = 0.89), Empathy domain (Mean = 3.85: Standard Deviation = 0.98), Assurance domain (Mean = 3.84: Standard Deviation = 0.98), Reliability domain (Mean = 3.83: Standard Deviation = 0.92), and Responsiveness domain (Mean = 3.76: Standard Deviation = 1.01). In the Tangible domain, the item “Hospitals’ cleaning and hygiene are excellent” (Mean = 4.14) is ranked highest and the item “Hospitals staff are pleasant to deal with” (Mean = 3.86) is ranked lowest. In the Reliability domain, the item “Hospitals offer prompt service every time” (Mean = 3.93) is ranked highest and both items “Hospitals expense reports are accurate” and “Hospitals provided me with adequate information about medical condition “got the same mean score (Mean = 3.84) and they are ranked lowest. In the Responsiveness domain, the item “Hospitals administration staff were efficient dealing with my queries” (Mean = 3.96) is ranked highest and item “There are experienced personnel on duty on weekends at hospitals” (Mean = 3.67) is ranked lowest. Furthermore, in the Assurance domain, the item “Hospitals’ employees always respected my privacy” (Mean = 3.94) is ranked highest, and the item “Hospitals make use of proficient medical staff” (Mean = 3.79) is ranked lowest. Finally, in the Empathy domain, the item “Hospitals’ employees gave individuals medical attention” (Mean = 3.98) is ranked highest and item “I was treated with a warm and caring attitude in hospitals” (Mean = 3.75) is rated/ranked lowest (see Table 3).
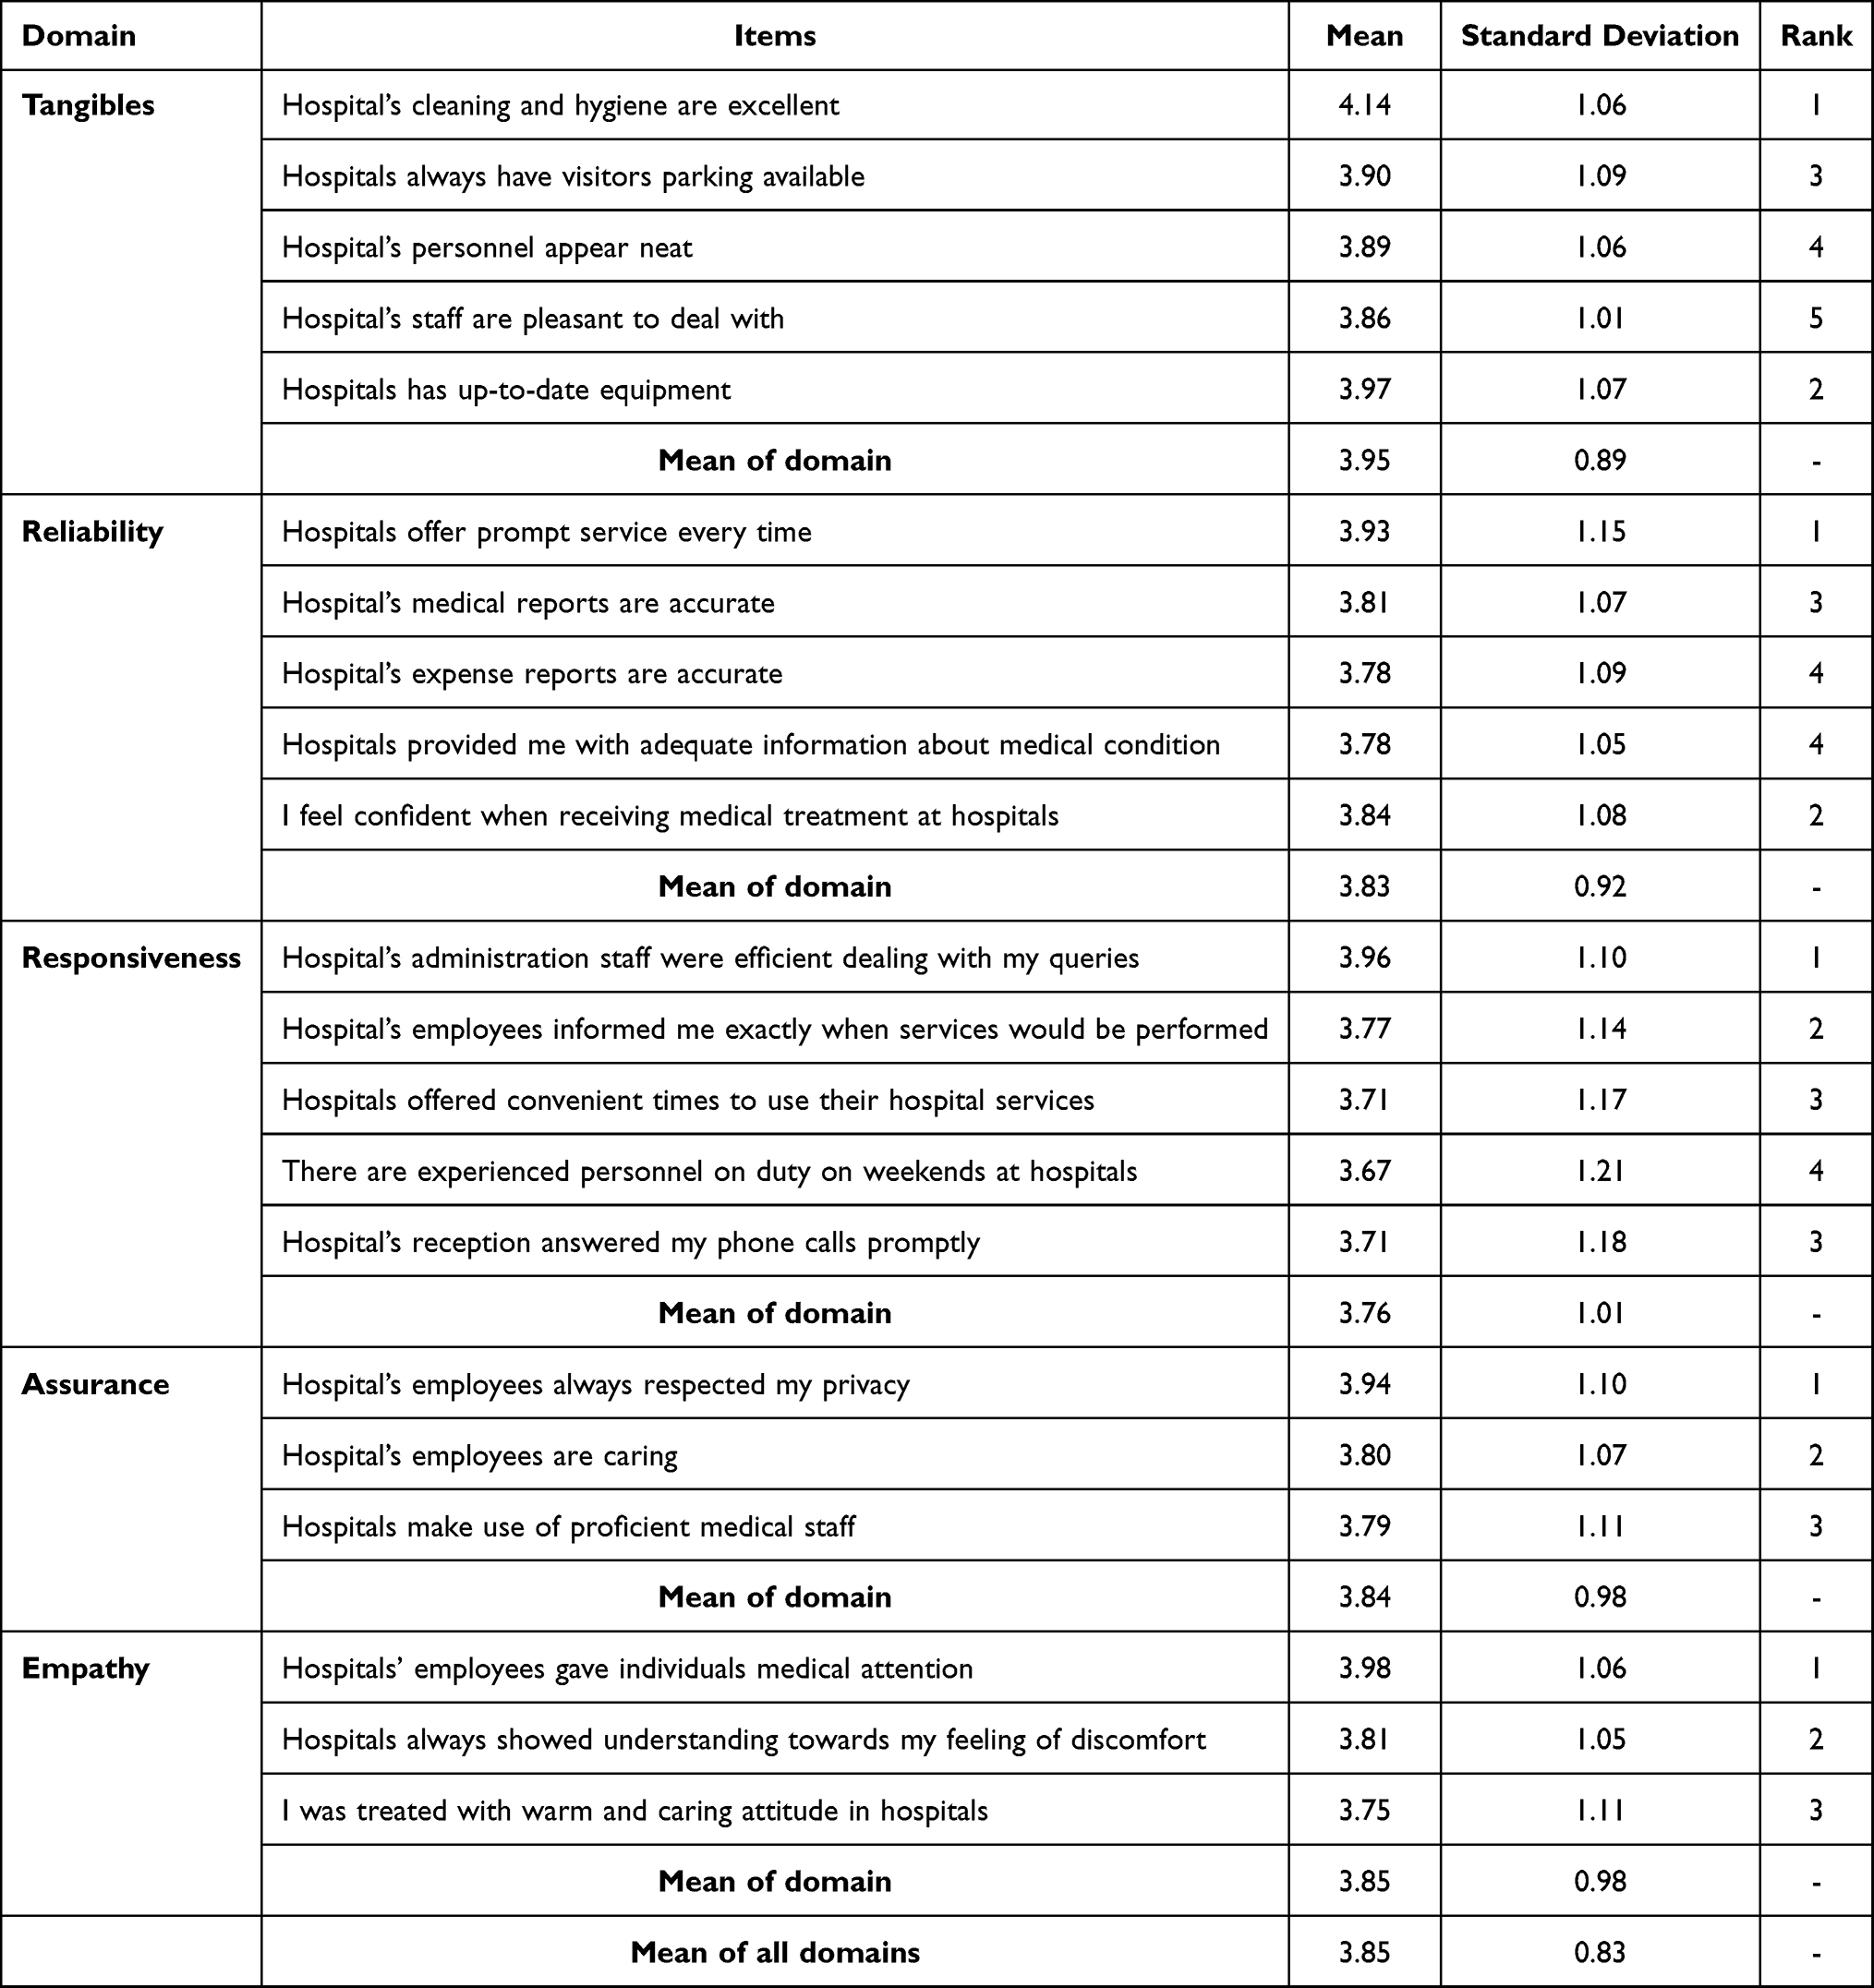 |
Table 3 Descriptive Results Includes Means, Standard Deviation, and Rank for Patients’ Perceptions of Services Received in the Hospital by Domain |
Differences Between the Patients’ Expectations and Their Perceptions of the Quality of Service
Table 4 shows the differences between the patients’ expectations of services and their perceptions of the quality of service received or offered by the hospitals. This relationship was explored using the Paired Samples t-test procedure. The results show that there is a statistically significant difference (P-value <0.001) between the quality of service in hospitals and patients’ expectation in favor of patients’ expectation for all domains of the SERVQUAL, indicating that patients had higher expectations of service quality than they received (see Table 4).
 |
Table 4 Paired Samples t-test to Detect the Differences Between Patients’ Expectations and Perceptions of Service Quality Offered by Hospitals |
Demographic Variables and SERVQUAL
Independent Sample t-test and one-way ANOVA were applied to examine the relation between the quality of service in hospitals and patients’ expectation with the demographic variables (gender, education level and age variables). The results showed no significant relation between the three demographic variables and the patients’ mean scores on expectations or perceptions of service quality offered in Jordanian hospitals.
Discussion
The results of the study, which explored patients’ expectations against their perceptions of service, showed that expectations of what should be available in the hospital were very high. Patients had higher expectations of service quality for every item of SERVQUAL scale with mean scores for all items above 4 on a 5-point scale (see Table 2). Overall, there was a gap between the mean scores for each expectation items and perception items (see Table 4). The same result was replicated with the five SERVQUAL domains/factors. In particular, the results showed that there is a statistically significant difference between patients’ expectations mean and patients’ perceptions mean score in favor of patients’ expectations for all SERVQUAL domains (Reliability, Tangibles, Assurance, Responsiveness, and Empathy). These results are consistent with the study in Jordan which conducted by Ayaad et al to examine the difference in the quality of healthcare service between electronic medical records and paper-based record hospitals. Ayaad et al found a significant difference between expectations and perceptions of health service quality in all domains in favor of hospitals that adopted electronic medical records.20 Similar results are reported by Tomes and Cheng Peng Ng (1995).19 In addition, the study results are consistent with a study which was conducted on Ghana hospitals regarding patients’ expectations and perceptions of service quality in 2020.29
It is clear that patients’ expectations of quality are far higher than their lived experiences of service provision. This is similar to studies in Malaysia, Taiwan, Romania, Iran, and China.21–25 In addition, non-SERVQUAL-based studies such as Odell, Bong, Andrell, Widell, Fryklund et al in Sweden, where only 56.4% of the patients reported fulfilment of treatment expectations.30 However, this study’s finding differs from those studies mentioned above in that expectations were equal with perceptions for some domains. In the other studies, some domains had higher expectation scores than others. For example, Zun, Ibrahim & Hamid (2018) found that the Empathy dimension had the highest scores among the five dimensions for both expectation and perception.22 In both Iran and Taiwan, Nadi et al and Bao-Lin et al found that the Reliability dimension of SERVQUAL had the highest scores among the five dimensions for both expectation and Perception of service quality.21,24
In previous studies, researchers have tried to decipher why expectations are higher by examining the role of demographic variables. In this study, these variables showed no significant effect on mean scores for any of the SWERVQUAL domains. This departs from studies such as Zun et al, who found that patient satisfaction on the Tangibles dimension of the SERVQUAL was influenced by demographic variables such as education level, monthly household income, and frequency of visits to hospital.22 It also differs from the Li et al study in China, where the type of patient (out-patient and in-patient) status influenced perceptions of quality in relation to Tangibles Domain. And Patients of 60 years of age and above reported more positive perception than those between 40 and 49 on dimensions of Reliability, Assurances and Empathy.25
In this study, the statistically significant differences found between expectations and perceptions of service quality on all factors or domains of the SERVQUAL are difficult to explain or speculate. However, these results could be because patients have high expectations that these hospitals provide high quality of services because they have qualified and trained staff. The literature suggests that staffing, training, resourcing, and workload pressures all contribute to how professionals interact and deliver services.31 These factors according the A’aquolah et al are constraints that impede quality improvement in Jordanian hospitals.28 If staff are not well trained and/or are not well remunerated or working in understaffed departments with resource constraints, they are more likely to deliver, inadvertently, services that do not meet patients’ expectations. Comparing high- and low-performing hospitals with respect to managing quality management systems obstacles, A’aquolah et al observed, through qualitative interviews, that staff and management complained about the lack of training, poor remuneration/rewards, not having delegation, communication issues, among others.4 These human dimensions of the practices within the Jordanian hospitals are important for boosting staff performance and contribute to quality of services. As can be seen from the results of the study, the domain where the gulf between expectations and perceptions of service experiences was widest is the Responsiveness domain. This domain has more to do with the interactions between staff and patients and service flexibility, including staff being more flexible and ready to work during weekends, responding to calls and providing flexible times for services. These can be related to quality management systems obstacles such as staffing, resourcing and remuneration. Therefore, hospital management's shifting focus on how to improve responsiveness will go a long way towards service quality improvement and by extension patients’ perceptions of services.
Conclusion
This study set out to explore patients’ expectations and perceptions of service quality using the SERVQUAL Model measure. The findings indicate that the participating hospitals in Jordan did not meet expectations as many participants reported discrepancy between what they expected, and the nature of the service received. This result shows a gap between patients’ expectations and their perceptions in all quality dimensions, and it should be considered carefully in order to improve quality of care services in hospitals.
The study therefore recommends that hospital managers should take necessary actions in all quality dimensions to improve healthcare services in their hospitals. These actions should be directed at reducing the gap between patients’ expectation and their perceptions regarding all service dimensions in order to provide desired services to patients. These actions should be directed towards addressing the reasons for the gap between patients’ expectations and their perceptions, as identified in SERVQUAL scale. These reasons which include, for example, emphasis on dealing with patients in gentle manner, the medical staff providing patients with adequate information about treatment facilitators and challenges, ensuring there are experienced personnel on duty on weekends in the hospitals, utilizing the skills of proficient medical staff and treating patients with warm and caring attitude in hospitals.
One of such measures is to employ a good instrument such as the SERVQUAL to assess quality of healthcare services in hospitals to enable managers to know how much of a gap exists between patients’ expectation and the quality of services provided in their hospitals. Hospital managers should frequently review these five domains of quality because patients’ expectations change over time. This approach will enable them to track how patients’ expectations are changing and help hospital managers to employ their human and material resources more efficiently to improve the level of healthcare services quality for all patients. In addition, hospital managers should address the obstacles that hinder their effort to improve the service quality through service evaluation and research. Future research themes have emerged from this study including key contributory factors to poor service quality from the perspective of patients. Research on these themes is essential in order to understand the underlying factors that inform expectation and perceptions of service quality and to point to more evidenced based approaches to service improvements.
Ethics Approval
The study was conducted according to the guidelines of the Declaration of Helsinki and approved by the Institutional Review Board (IRB) of King Abdullah International Medical Research Centre (KAIMRC). The IRB approval Number is IRB/0052/22.
Informed Consent Statement
Informed consent was obtained from the study participants.
Author Contributions
All authors made substantial contributions to conception and design, acquisition of data, or analysis and interpretation of data; took part in drafting the article or revising it; agreed to submit to the current journal; gave final approval of the version to be published; and agreed to be accountable for all aspects of the work.
Funding
This study was supported by King Abdullah International Medical Research Centre (KAIMRC), Saudi Arabia.
Disclosure
The authors declare no conflicts of interest in this work.
References
1. Gill J. Quality follows quality: add quality to the business and quality will multiply the profits. TQM J. 2009;21(5):530–539. doi:10.1108/17542730910983434
2. Roy SK, Ganguli S. Service quality and customer satisfaction: an empirical investigation in Indian mobile telecommunications services. J Mark Manag. 2008;18(2):119–144.
3. Gronroos C. Service Management and Marketing: Managing the Service Profit Logic. Wiley; 2016.
4. A’aqoulah A, Kuyini AB, Ajlouni MT. Addressing quality management system obstacles in Jordanian hospitals. Int Bus Res. 2016;9(9):34–40. doi:10.5539/ibr.v9n9p34
5. Martinez Garcia JA, Martinez Caro L. Rethinking perceived service quality: an alternative to hierarchical and multidimensional models. Total Qual Manag. 2010;21(1):93–118. doi:10.1080/14783360903492694
6. Abedi G, Rostami F, Ziaee M, Siamian H, Nadi A. Patient’s perception and expectations of the quality of outpatient services of Imam Khomeini Hospital in Sari City. Mater Socio Medica. 2015;27(4):272. doi:10.5455/msm.2015.27.272-275
7. Aldlaigan AH, Buttle FA. SYSTRA‐SQ: a new measure of bank service quality. Int J Serv Ind Manag. 2002;13(4):362–381. doi:10.1108/09564230210445041
8. Caro LM, García JAM. Measuring perceived service quality in urgent transport service. J Retail Consum Serv. 2007;14(1):60–72. doi:10.1016/j.jretconser.2006.04.001
9. Gounaris S. Measuring service quality in b2b services: an evaluation of the SERVQUAL scale vis-à-vis the INDSERV scale. J Serv Mark. 2005;19(6):421–435. doi:10.1108/08876040510620193
10. Engelland BT, Workman L, Singh M. Ensuring service quality for campus career services centers: a modified SERVQUAL scale. J Mark Educ. 2000;22(3):236–245. doi:10.1177/0273475300223007
11. Frochot I, Hughes H. HISTOQUAL: the development of a historic houses assessment scale. Tour Manag. 2000;21(2):157–167. doi:10.1016/S0261-5177(99)00045-X
12. Getty JM, Getty RL. Lodging quality index (LQI): assessing customers’ perceptions of quality delivery. Int J Contemp Hosp Manag. 2003;15(2):94–104. doi:10.1108/09596110310462940
13. Markovic S, Komsic J, Stifanic M. Measuring service quality in city restaurant settings using DINESERV scale. Recent Adv Business Manag Mark. 2013;181:176–181.
14. Parasuraman A, Berry L, Zeithaml V. Refinement and reassessment of the SERVQUAL scale. Journal of Retailing. 2002;67(4):114.
15. Angur MG, Nataraajan R, Jahera JS. Service quality in the banking industry: an assessment in a developing economy. Int J Bank Mark. 1999;17(3):116–125. doi:10.1108/02652329910269211
16. Gilbert GR, Veloutsou C, Goode MM, Moutinho L. Measuring customer satisfaction in the fast food industry: a cross‐national approach. J Serv Mark. 2004;18(5):371–383. doi:10.1108/08876040410548294
17. Corrigan JM. Crossing the quality chasm. Build Better Deliv Syst. 2005;27:89.
18. Rashid WEW, Jusoff K. Service quality in healthcare setting. Int J Health Care Qual Assur. 2009;18:84–94.
19. Tomes AE, Ng SCP. Service quality in hospital care: the development of an in-patient questionnaire. Int J Health Care Qual Assur. 1995;8(3):25–33. doi:10.1108/09526869510089255
20. Ayaad O, Alloubani A, ALhajaa EA, et al. The role of electronic medical records in improving the quality of healthcare services: comparative study. Int J Med Inform. 2019;127:63–67. doi:10.1016/j.ijmedinf.2019.04.014
21. Chang B-L, Kao H-O, Lin S-J, Yang S-H, Kuo Y-W, Jerng J-S. Quality gaps and priorities for improvement of healthcare service for patients with prolonged mechanical ventilation in the view of family. J Formos Med Assoc. 2019;118(5):922–931. doi:10.1016/j.jfma.2018.09.019
22. Zun AB, Ibrahim MI, Hamid AA. Level of satisfaction on service quality dimensions based on SERVQUAL model among patients attending 1 Malaysia clinic in Kota Bharu, Malaysia. Oman Med J. 2018;33(5):416. doi:10.5001/omj.2018.76
23. Gheorghe IR, Gheorghe C-M, Purcărea VL. Measuring the perceived quality of ophthalmology services in private organizations. A marketing perspective. Rom J Ophthalmol. 2018;62(1):54. doi:10.22336/rjo.2018.8
24. Nadi A, Shojaee J, Abedi G, Siamian H, Abedini E, Rostami F. Patients’ expectations and perceptions of service quality in the selected hospitals. Med Arch. 2016;70(2):135. doi:10.5455/medarh.2016.70.135-139
25. Li M, Lowrie DB, Huang C-Y, et al. Evaluating patients’ perception of service quality at hospitals in nine Chinese cities by use of the ServQual scale. Asian Pac J Trop Biomed. 2015;5(6):497–504. doi:10.1016/j.apjtb.2015.02.003
26. World Health Organiziation. Health Systems Profile-Jordan; 2015. Available from: https://apps.who.int/iris/bitstream/handle/10665/254894/EMROPUB_2017_EN_19603.pdf?sequence=1&isAllowed=y.
27. Ministry of health (Jordan). Annual Report; 2018.
28. A’aqoulah A, Kuyini AB, Ajlouni MT, Saif N, Al-Raoush A. Staff perceptions of obstacles to quality management systems in low-and high-performing hospitals in Jordan. Int J Bus Manag. 2016;11(2):232. doi:10.5539/ijbm.v11n2p232
29. Agyei SK, Kumah E, Baffour PA, Ankomah SE. Patient perception of service quality in Ghana: an empirical study in Christian Health Association of Ghana Hospitals. Br J Health Care Manag. 2020;26(6):1–9. doi:10.12968/bjhc.2019.0048
30. Odell A, Bång A, Andréll P, et al. Patients expectations and fulfilment of expectations before and after treatment for suspected coronary artery disease assessed with a newly developed questionnaire in combination with established health-related quality of life questionnaires. Open Heart. 2017;4(1):e000529. doi:10.1136/openhrt-2016-000529
31. Ghazali RJD, Abd Manaf NH, Abdullah AHA, et al. Hospital waiting time: the forgotten premise of healthcare service delivery? Int J Health Care Qual Assur. 2011;24. doi:10.1108/09526861111160553
 © 2022 The Author(s). This work is published and licensed by Dove Medical Press Limited. The
full terms of this license are available at https://www.dovepress.com/terms
and incorporate the Creative Commons Attribution
- Non Commercial (unported, 3.0) License.
By accessing the work you hereby accept the Terms. Non-commercial uses of the work are permitted
without any further permission from Dove Medical Press Limited, provided the work is properly
attributed. For permission for commercial use of this work, please see paragraphs 4.2 and 5 of our Terms.
© 2022 The Author(s). This work is published and licensed by Dove Medical Press Limited. The
full terms of this license are available at https://www.dovepress.com/terms
and incorporate the Creative Commons Attribution
- Non Commercial (unported, 3.0) License.
By accessing the work you hereby accept the Terms. Non-commercial uses of the work are permitted
without any further permission from Dove Medical Press Limited, provided the work is properly
attributed. For permission for commercial use of this work, please see paragraphs 4.2 and 5 of our Terms.