Back to Journals » ClinicoEconomics and Outcomes Research » Volume 12
Explaining Socioeconomic Inequality Differences in Catastrophic Health Expenditure Between Urban and Rural Areas of Iran After Health Transformation Plan Implementation
Authors Kazemi-Karyani A ![]() , Woldemichael A
, Woldemichael A ![]() , Soofi M
, Soofi M ![]() , Karami Matin B, Soltani S, Yahyavi Dizaj J
, Karami Matin B, Soltani S, Yahyavi Dizaj J
Received 8 May 2020
Accepted for publication 29 September 2020
Published 11 November 2020 Volume 2020:12 Pages 669—681
DOI https://doi.org/10.2147/CEOR.S261520
Checked for plagiarism Yes
Review by Single anonymous peer review
Peer reviewer comments 2
Editor who approved publication: Prof. Dr. Dean Smith
Ali Kazemi-Karyani,1 Abraha Woldemichael,2 Moslem Soofi,3 Behzad Karami Matin,1 Shahin Soltani,1 Jafar Yahyavi Dizaj4
1Research Center for Environmental Determinants of Health, Health Institute, Kermanshah University of Medical Sciences, Kermanshah, Iran; 2School of Public Health, College of Health Sciences, Mekelle University, Mekelle, Tigray, Ethiopia; 3Social Development and Health Promotion Research Center, Kermanshah University of Medical Sciences, Kermanshah, Iran; 4Health Management and Economics Research Center, Iran University of Medical Sciences, Tehran, Iran
Correspondence: Jafar Yahyavi Dizaj
Health Management and Economics Research Center, Iran University of Medical Sciences, Tehran, Iran
Email [email protected]
Objective: Ensuring fair financial contribution is one of the main goals of the Health Transformation Plan (HTP) of Iran. This study aims to estimate socioeconomic inequality differences in catastrophic health expenditure (CHE) between urban and rural areas of Iran after the implementation of the HTP during 2017.
Materials and Methods: Data from a representative survey of households’ income and xpenditure from the Iran Statistical Center (ISC) were used for the analysis. We applied the World Health Organization (WHO) cut-off of 40% payment for CHE, and Wagstaff’s normalized concentration index (C) to measure and decompose the inequality. Also, Blinder–Oaxaca decomposition analysis was used to decompose contributors of inequality differences between rural and urban areas.
Results: The overall incidence of CHE among Iranian households during the year 2017 was 3.32% with a standard deviation (SD) of 17.91%, and the mean (SD) levels of CHE in rural and urban areas of Iran were 4.37% (20.45%) and 2.97% (16.99%), respectively. The aggregate socioeconomic status (SES)-related inequality in CHE was significantly (p< 0.001) different from zero (C=− 0.238) and there was a significant (p< 0.05) difference between rural (C=-0.150) and urban (C=0.218) areas. SES was the highest contributor to inequality in both rural (130.09) and urban (144.17) areas. The Blinder–Oaxaca decomposition revealed that SES (175.01%) followed by outpatient services (120.29%) were the main contributors to differences in inequality in rural and urban areas. Sex (− 101.42%) and health insurance coverage were among negative contributors to this inequality difference.
Conclusion: Our findings revealed a significant pro-rich inequality in CHE. Also, some variables, such as sex and region, made different contributions in rural and urban areas. However, SES, itself, made the highest contribution in both areas and explained the greatest share of difference in inequality between the two areas. This issue calls for revision of the HTP to further address the risk of CHE and socioeconomic disparity among Iranian households, especially those with lowSES.
Keywords: inequality, catastrophic health expenditure, Health Transformation Plan, Iran
Introduction
Financial protection of households is one of the main objectives of many healthcare systems and a key determinant of universal health coverage (UHC).1,2 Citizens’ utilization of healthcare services without incurring financial hardship contributes to the development and economic growth of countries.3 However, most of the developing countries have failed to achieve financial protection of their citizens, and annually many households face catastrophic health expenditure (CHE) and impoverishment due to costs related to healthcare services utilization.1,4
The increase in health spending due to advances in medical technology over the past few decades and the increased expectations of individuals have created new challenges for financing healthcare services.5 Annually about 44 million households (or more than 150 million people) globally experience CHE, of which nearly 25 million suffer from impoverishment related to healthcare services utilization.6 The share of out-of-pocket payments (OOPs) for the health of households from total payments reflects the effectiveness of the health system in financially protecting the citizens. OOP is the most inefficient mechanism for financing healthcare. These payments can lead households with CHE, especially in underresourced and developing countries, to a low income and may even push them below the poverty line.7 Besides, OOP can lead poor people not to seek healthcare because the costs of the services can be unaffordable for them.4
Evidence from Iran has revealed a high prevalence of OOPs. On average, 7% of Iranian households have been faced with CHE during the past few decades.8 The fourth 5-year development plan of Iran aims to decrease OOP by 30% and the incidence of CHE to 1%.9
Governments have been trying to reduce disparities in health outcomes through policies of the health sector and other sectors.10 The government of Iran has implemented the Health Transformation Plan (HTP) since April 2014, with the aim of improving health service coverage to citizens by reducing OOPs through different mechanisms, including the provision of health coverage to uninsured people, decreasing coinsurance payments to inpatient services in public hospitals, improving financial protection, and decreasing the incidence of CHE. However, the issue of ensuring fair financial contribution remains one of the main challenges to Iran’s healthcare system.11
Previous studies in Iran mainly focused on the incidence and intensity of CHE and its determinants.12,13 Some evidence also revealed a higher incidence of CHE during the year 2013 than during the year 2008, and failure to achieve financial protection of households.14 After the implementation of the HTP, another study in Kurdistan province reported similar findings,15 while a study in Guilan province reported a decreased incidence of CHE from 5.75% in 2013 to 3.82% in 2015. The inequity in and utilization of health services in the province showed significant changes after the implementation of the HTP.2 However, the effect of the HTP on the financial protection of Iranian households against CHE is debatable, and there is little understanding concerning the inequality in CHE since the introduction of the HTP. Furthermore, there is a lack of evidence about the socioeconomic inequality differences in CHE between rural and urban areas of Iran, and contributors to inequality in rural and urban populations of the country are not well documented. This study aims to investigate the incidence of CHE, and to explain socioeconomic inequality differences in CHE between urban and rural areas of Iran since the implementation of the HTP during 2017. The findings are anticipated to be helpful as a basis for further evaluation of the effectiveness of the HTP in reducing CHE, and as an input for decision-makers to devise mechanisms for reducing unfair CHE in different regions of Iran and perhaps in other similar contexts.
Materials and Methods
Data Source and Variables
We extracted data from the income–expenditure survey of Iran Statistical Center (ISC) of 2017, and the final dataset used for the analysis comprised 37,959 households. In this study, the sex and educational level of the head of the household; presence of an under-5-year-old child, an elderly person, or a person with a chronic specific disease (thalassemia, cancer, etc.) in the household; the household’s health insurance coverage status; place of residence; and inpatient services utilization and outpatient services utilization were the explanatory variables. The household’s socioeconomic status (SES) was another explanatory variable used as a ranking variable to measure the inequalities. We categorized the households into five socioeconomic groups, ranging from the lowest (1st quintile) to the highest (5th quintile). For this purpose, we applied a principal component analysis (PCA), and possession of a car, motorcycle, bicycle, radio, refrigerator, freezer, stove, vacuum cleaner, CD/DVD player, personal computer, sewing machine, cooler, washing mashing, microwave, central heating, use of natural gas for cooking, per capita rooms, per capita house area and access to piped drinking water, electricity, internet, telephone and sewage network were included as SES variables. Also, the educational level and employment of the head of the household were considered as SES variables. According to the SES index, households were categorized in five quintiles from the lowest (1st quintile) to highest (5th quintile) SES. CHE was the outcome variable and has been described as a state when a household’s expenditure exceeds 40% of its capacity to pay (CTP) for healthcare services, while the difference between the household’s income and living expenditures reflected the CTP.16 All provinces of Iran were included in the final analysis, and according to similarities such as geographic location and culture, the provinces were categorized into five regions of north, northeast, south, west, and east.
Statistical Analysis
Estimation of Catastrophic Health Expenditure (CHE)
Different studies have used different thresholds to define CHE. In this study, we applied the World Health Organization (WHO) threshold of 40% payment to determine CHE17,18 and used the CTP approach to calculate CHE. Wagstaff proposes a lifetime money metric utility (LMMU) approach to define medical expenses as catastrophic in terms of their lifetime consequences.19 Accordingly, after adjusting for household size, we obtained the CTP by deducting the average subsistence spending of each household on food, which fell within the 45th to the 55th percentile, from the effective income. Finally, we considered those households with OOPs for medical services exceeding 40% of their CTP as having experienced CHE.4,20
Inequality Measurement
Wagstaff’s normalized concentration index (C), which is expressed mathematically as follows,21 was used to measure the inequality in CHE:
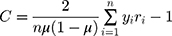
where  represents the ith household facing CHE,
  is the ith household’s fractional rank in the distribution of the household’s SES, and µ is the mean of the CHE. The values of C fall in the interval [−1, +1] and a value of zero indicates an equal distribution of the outcome variable among the different SES quintiles. The positive (negative) values indicate the pro-poor (pro-rich) inequality in CHE.
Decomposition of Inequality
We used Wagstaff’s relative concentration index (C) decomposition technique to determine the contributions of the explanatory variables to the measured inequalities in CHE.22 Assuming a linear relationship between CHE and its determinants, we can express the decomposition of the C for CHE as:
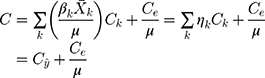
where here C was decomposed to the inequality that is attributable to the variations of the explanatory variable between SES quintiles ( ) and its residual (
 ); (
); ( ) represents the marginal effect of the explanatory variable as measured by a logit regression model;
  is the elasticity of the explanatory variable; and
  and (
and ( ) represent the mean values of the explanatory variable k (xk) and CHE, respectively. Also, Ck denotes the Wagstaff normalized CI for each explanatory variable. A positive association between the explanatory variable (xk) and CHE indicates a lower likelihood of the outcome variable among the poor (pro-poor), while a negative relationship indicates a higher contribution among the rich (pro-rich).
Finally, we determined the absolute contribution of each explanatory variable to the inequality in CHE by multiplying the elasticity value of the explanatory variable by its concentration index ( ). This value was divided by the C of the CHE to obtain the percentage contribution of the explanatory variables to the measured inequality of CHE.
Decomposition of Differences in Inequality
Blinder–Oaxaca decomposition analysis was performed to measure the contribution of changes in the explanatory variables to the measured differences in CHE in rural and urban areas of Iran. The decomposition formula is:
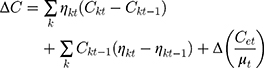
where  is Wagstaff C and
  is the elasticity of the explanatory variable k in rural areas; and
 is Wagstaff C and
  is the elasticity of the explanatory variable k in urban areas.22 The weight of samples was considered in all analyses performed in this study. Microsoft Excel sheet 2013 was used to extract the data, and the analysis was performed using Stata statistical package version 14.2 (StataCorp, College Station, TX, USA).
Results
Out of the total 37,959 households included in the analysis, male and female household heads accounted for 32,637 (85.98%) and 5322 (14.02%), respectively. Households without an under-5-year-old child and or an elderly person (74.27% vs 75.58%) made up about three-fourths each. The proportions of urban and rural residents (49.26% vs 50.74%) were almost equal. While 79.07% of the total households had health insurance, outpatient and inpatient services utilization accounted for 51.83% and 19.42%, respectively.
Catastrophic Health Expenditure (CHE)
The overall mean of facing CHE during 2017 among the households in Iran was 3.32% with a standard deviation (SD) of 17.91%, and ranged from the lowest for Kohgiluyeh and Boyer-Ahmad province (0.35%) to the highest for Lorestan province (6.62%) (Table 1). Female-headed households had a higher mean of CHE (4.64%) than the male-headed households (3.12%). Overall, households with an elderly person (6.70%), with no under-5-year-old children (4.17%), with a family size of 1–2 people (6.14%), living in rural areas (4.36%), with individuals having chronic specific diseases (19.73%), and those who utilize inpatient (11.38%) and outpatient (6.02%) services showed higher mean CHE (Table 2).
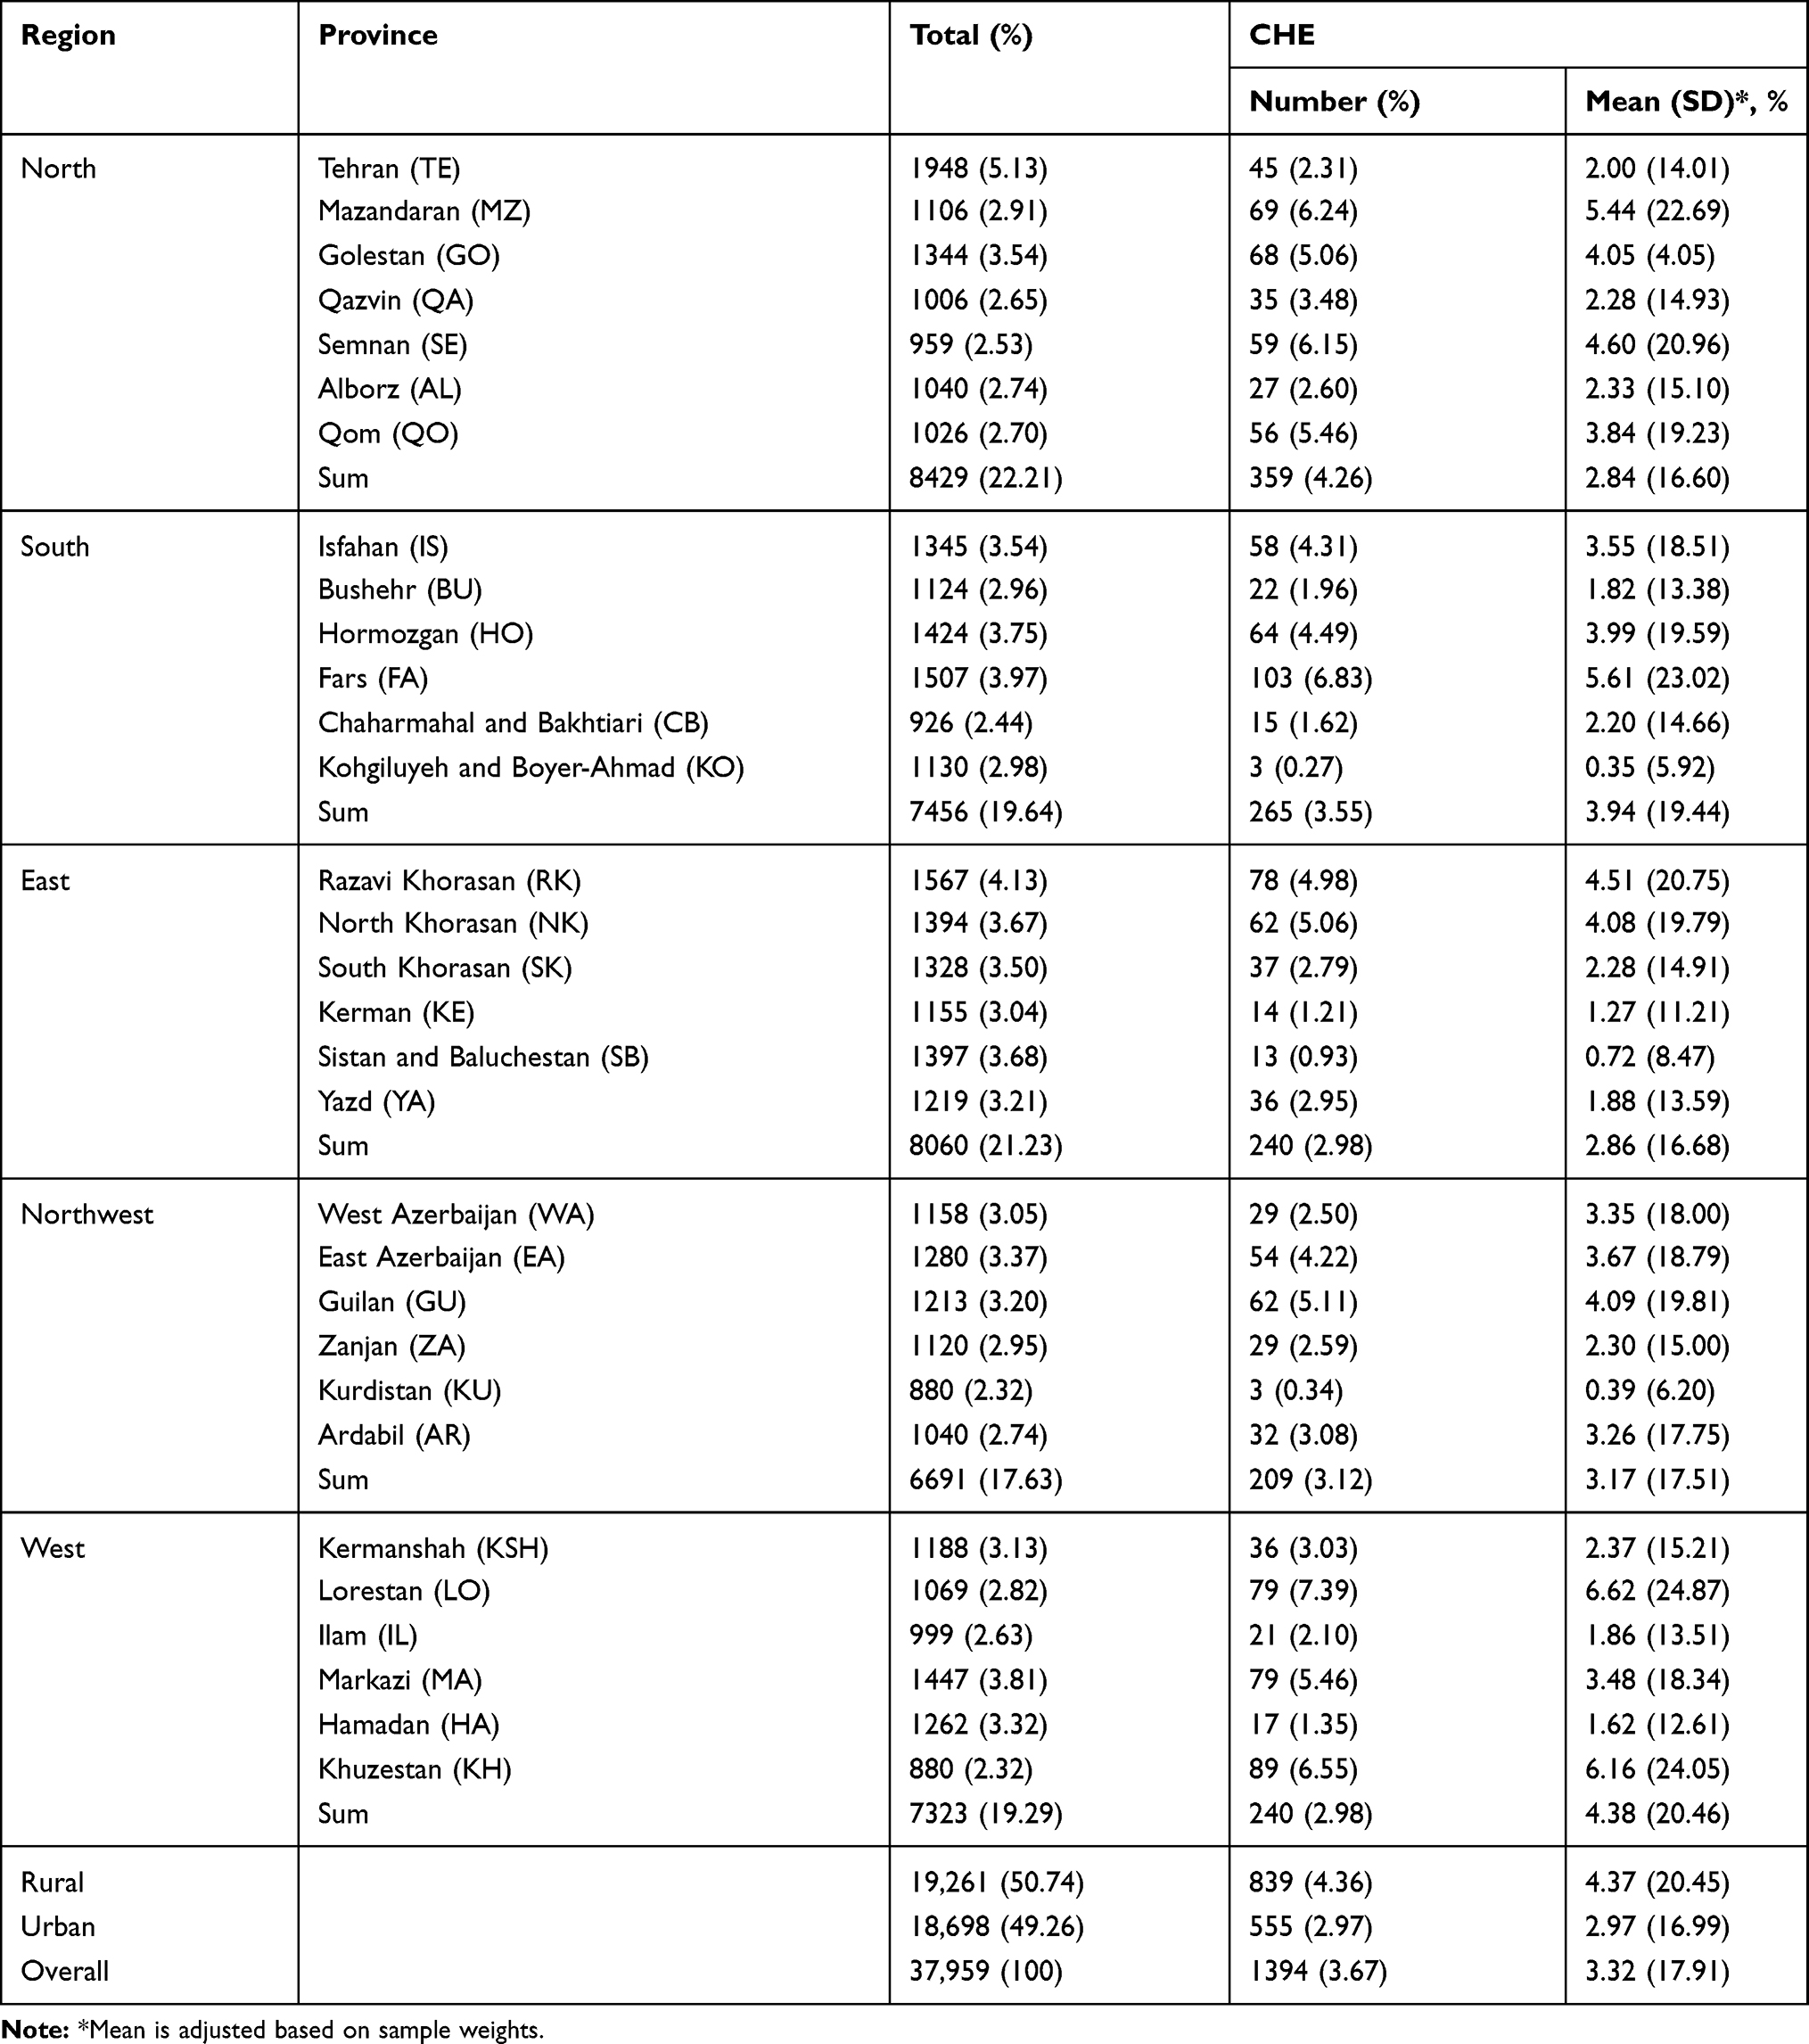 |
Table 1 Incidence of CHE Among Iranian Households by Province and Region, 2017 |
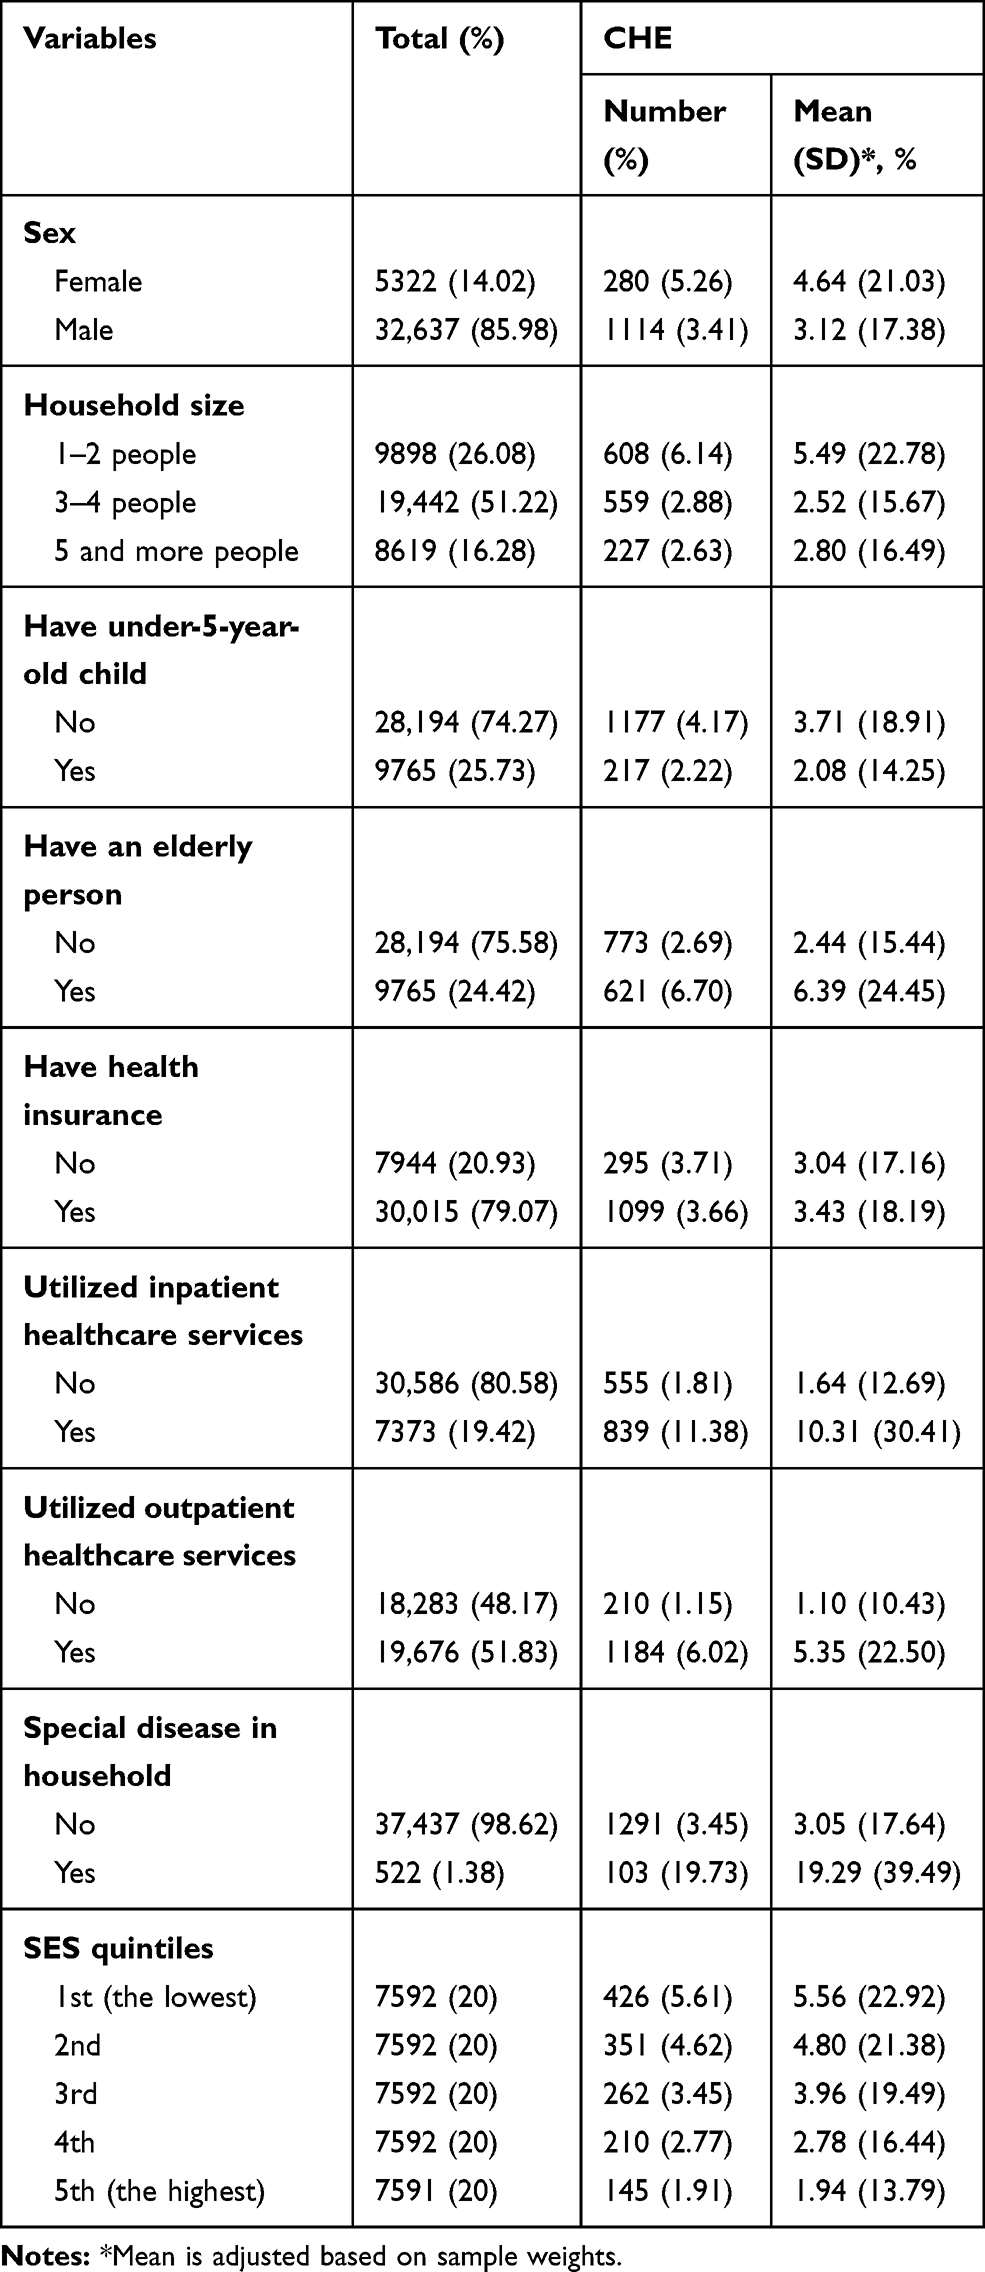 |
Table 2 Descriptive Statistics and Incidence of CHE Among Iranian Households, 2017 |
The findings indicated no considerable difference between insured and uninsured households regarding the mean CHE (3.04% vs 3.43%), and CHE was highest in proportion among the first SES quintile households (5.61%) compared with the other quintiles. The lowest CHE proportion was in Kohgiluyeh and Boyer-Ahmad province (0.27%) while the highest was in Lorestan province (7.39%). In Tehran province, the capital of Iran, the proportion of CHE was 2.31%. Regarding regions, the lowest and highest mean CHE were in the north (2.84%) and west (3.32), respectively (Table 1).
Inequality in CHE
The inequality in CHE in Iran during 2017 revealed a deviation from the 45-degree line of perfect equality (C=−0.226), indicating the relative concentration of CHE in the lower SES quintiles. Not only did 28 (90.32%) out of the total 31 provinces in Iran reveal pro-rich inequality in CHE (Table 3), but also 23 of the provinces (74.19%) showed statistically significant inequality in CHE (p<0.05). Qazvin (C=−0.559; p<0.001) and South Khorasan (C=−0.510; p<0.001) provinces had the highest amount of inequality. Hamadan was the only province with pro-poor significant inequality (p<0.05). The total mean (SD) values of CHE in rural and urban areas of Iran were 4.37% (20.45%) and 2.97% (16.99%), respectively (Table 1). Table 4 shows the comparison of normalized C for rural and urban areas. The pro-rich SES inequality in urban areas (C=−0.218) was higher than in rural areas (C=−0.150) and this difference was statistically significant (p<0.05).
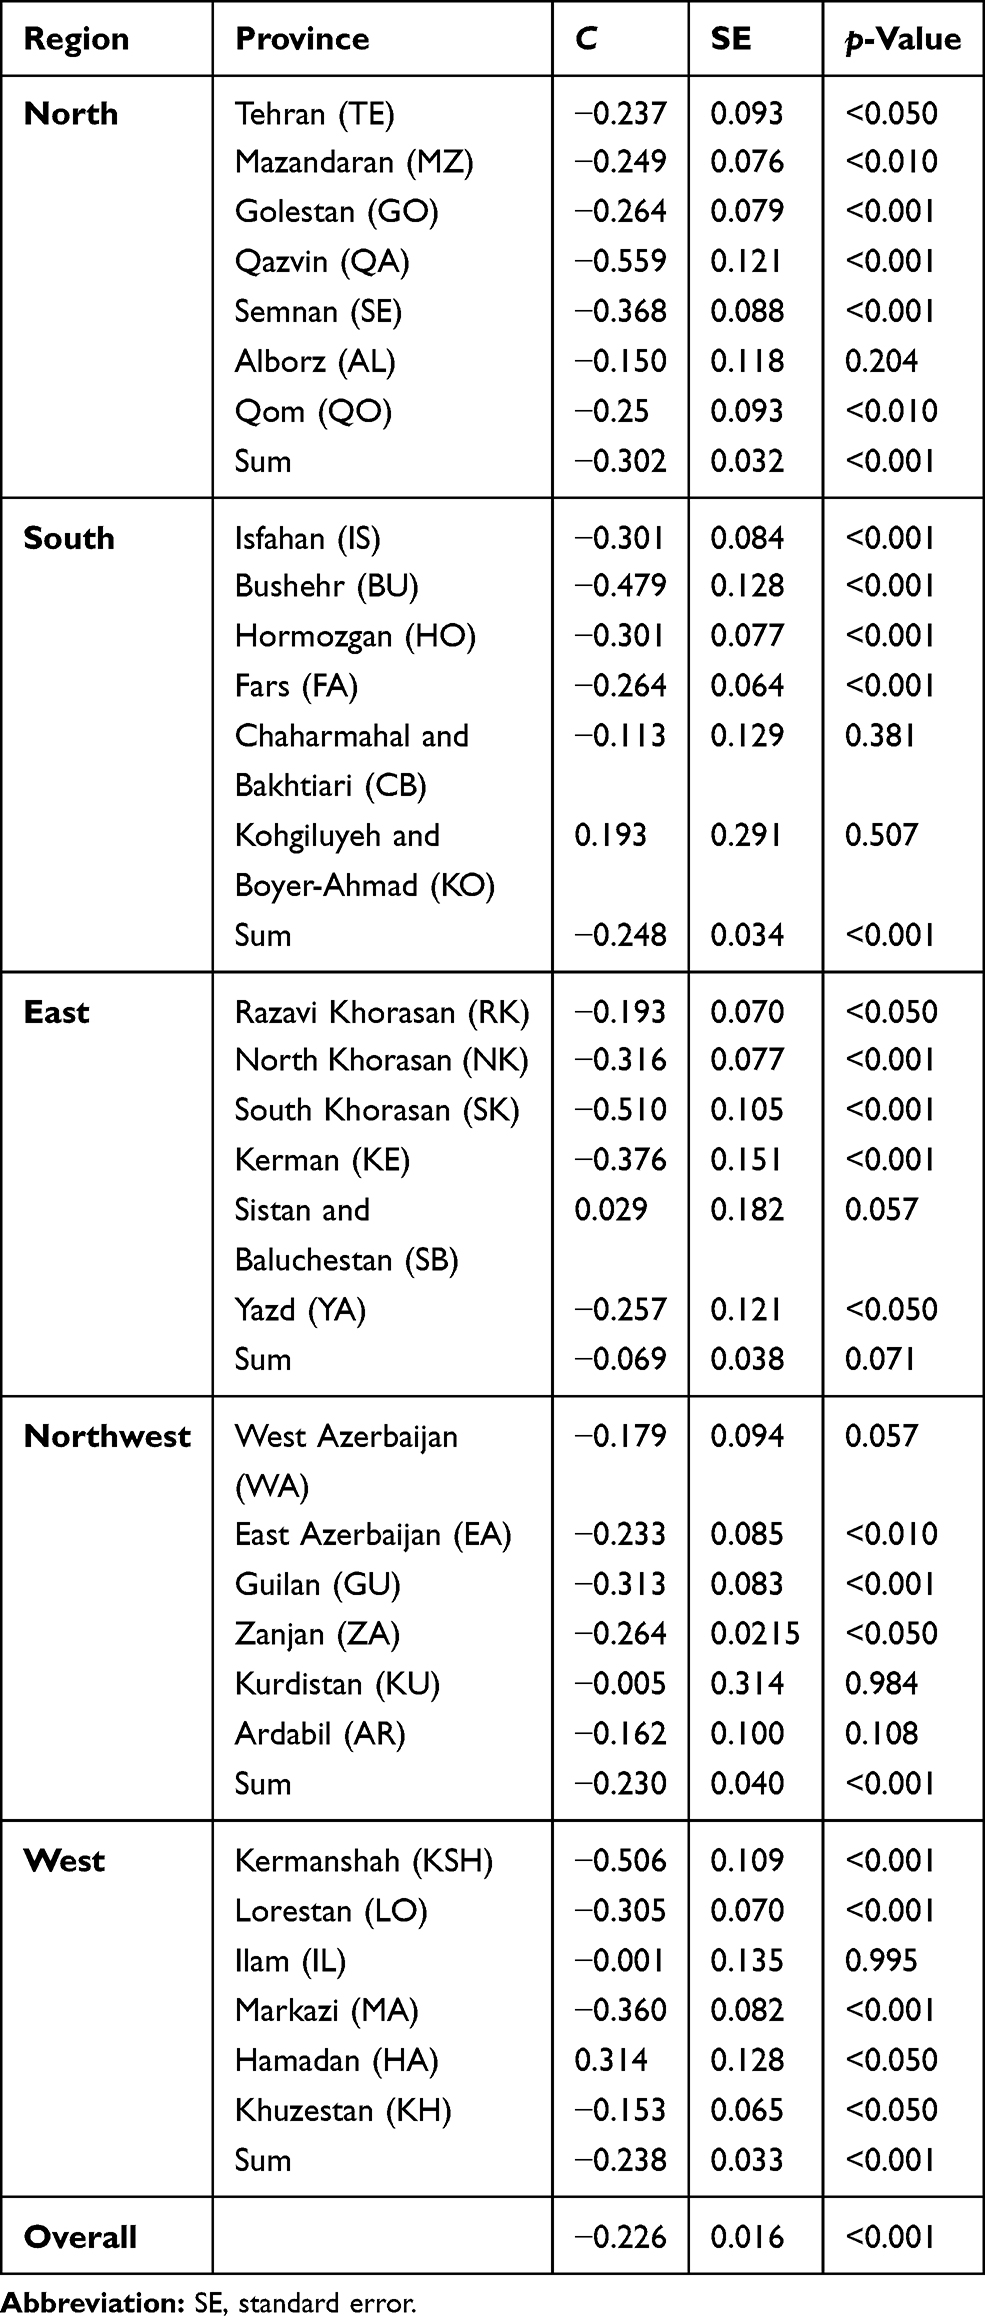 |
Table 3 Normalized Concentration Index (C) for Inequality in CHE by Province and Region of Iran, 2017 |
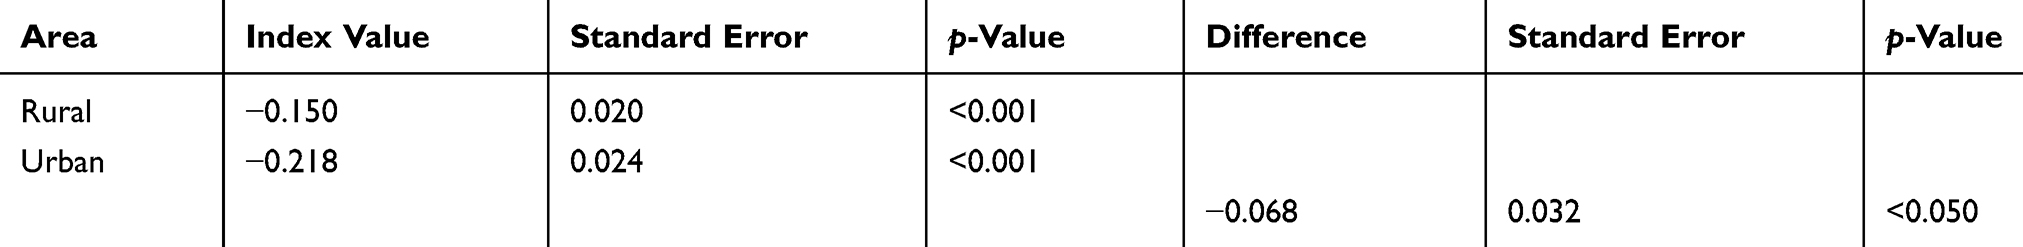 |
Table 4 Wagstaff Normalized Concentration Index for CHE Among Iranian Households in Rural and Urban Areas, 2017 |
Decomposition of CHE Inequality
The results of decomposition analysis of inequality in CHE in rural and urban areas of Iran are shown in Table 5. This table presents the mean, marginal effect, elasticity, C for explanatory variables, and absolute and percentage contributions of the variables to the measured inequality.
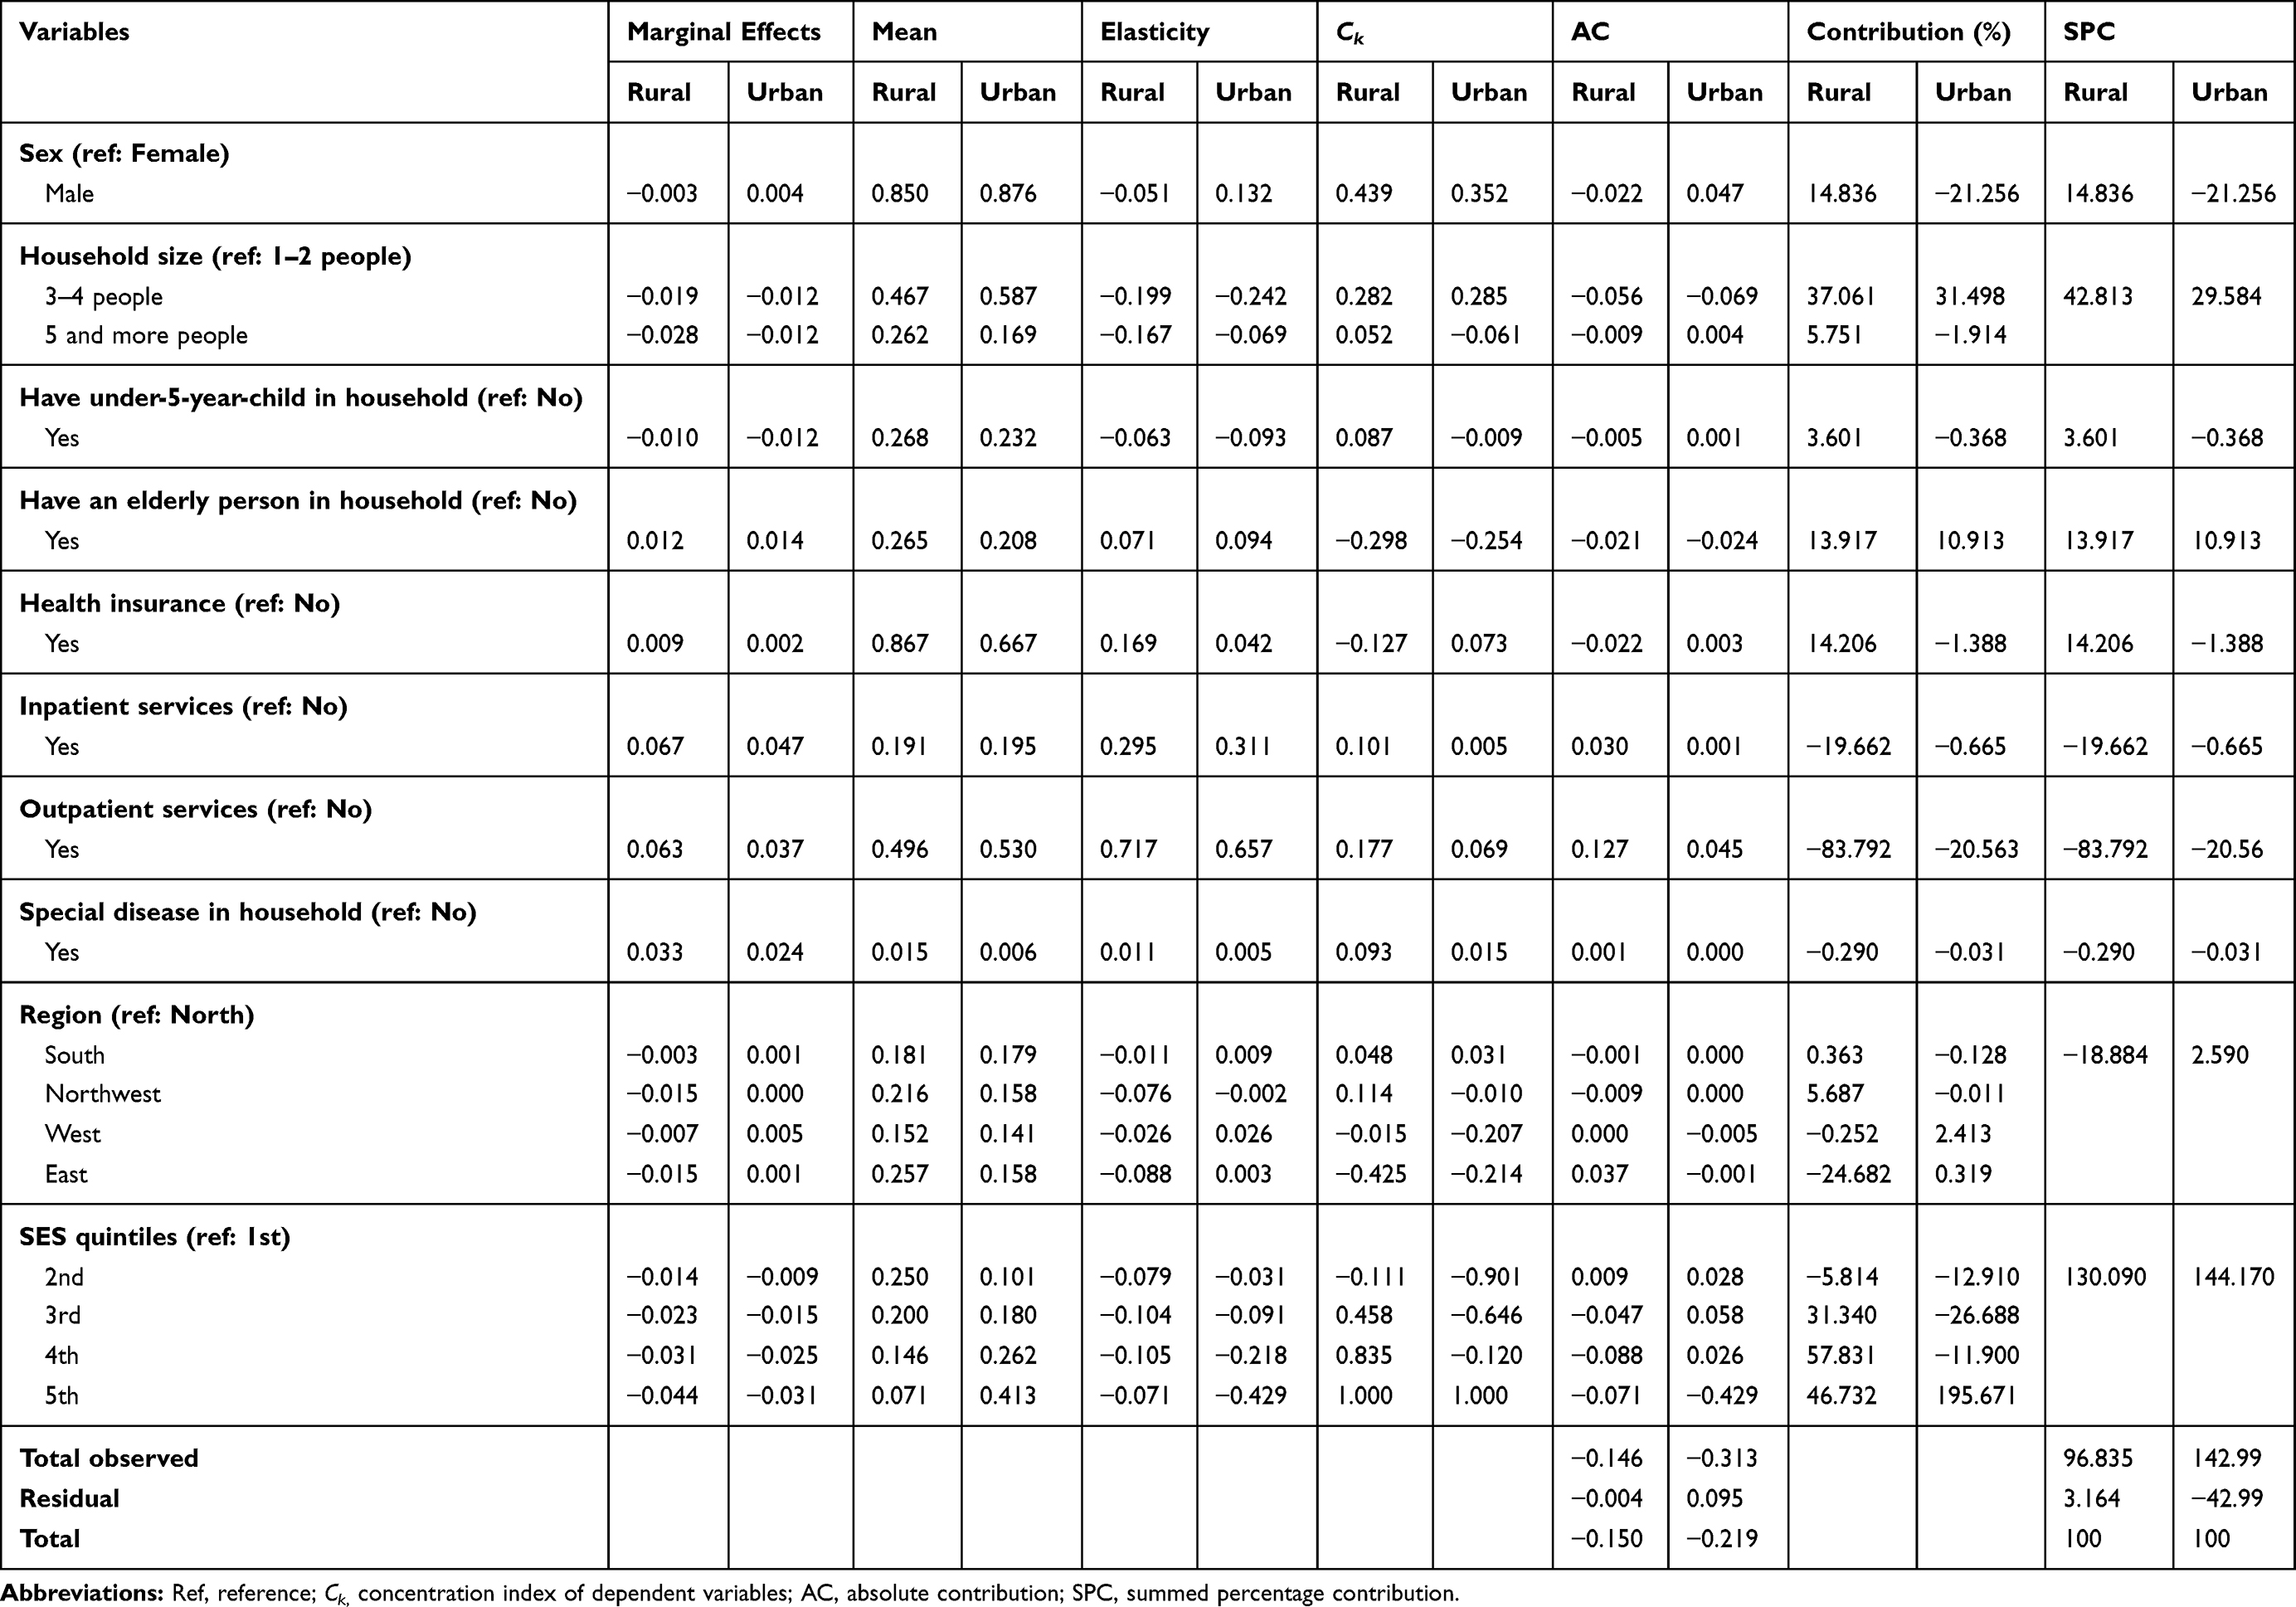 |
Table 5 Decomposition of Socioeconomic Inequality in CHE Among Iranian Households in Rural and Urban Areas, 2017 |
Based on percentage contributions, SES, household size, sex, health insurance coverage, and presence of an elder in the household were the main contributors to inequality in rural areas, by 130.09%, 42.81%, 14.84%, 14.21%, and 13.92%, respectively. On the other hand, use of outpatient services (83.80%), use of inpatient services (19.66%), and region of residency (18.88%) were the main negative contributors to inequality in rural areas of Iran. In urban areas of Iran, SES (144.17%), itself, was also the highest positive contributor to measured inequality in CHE.
Furthermore, household size and the presence of an elderly person explained 29.58% and 10.91% of the socioeconomic inequality in CHE, respectively. In contrast, sex (21.26%) and outpatient services utilization (19.69%) negatively contributed to inequality. Generally, the variables included in the model explained 55.24% of the overall inequality in CHE. Table 6 shows the results of Blinder–Oaxaca decomposition of differences in socioeconomic inequality in CHE in rural and urban areas. SES, utilization of outpatient services, region of residency, and utilization of inpatient services were the main positive contributors to the difference in inequality in CHE in urban and rural areas, by 175%, 120.29%, 50.40%, and 41.64%, respectively. In contrast, sex (101.42%), health insurance coverage (36.10%), and having an under-5-year-old child in the household (9.21%) negatively contributed to the difference in SES-related inequality between rural and urban areas of Iran.
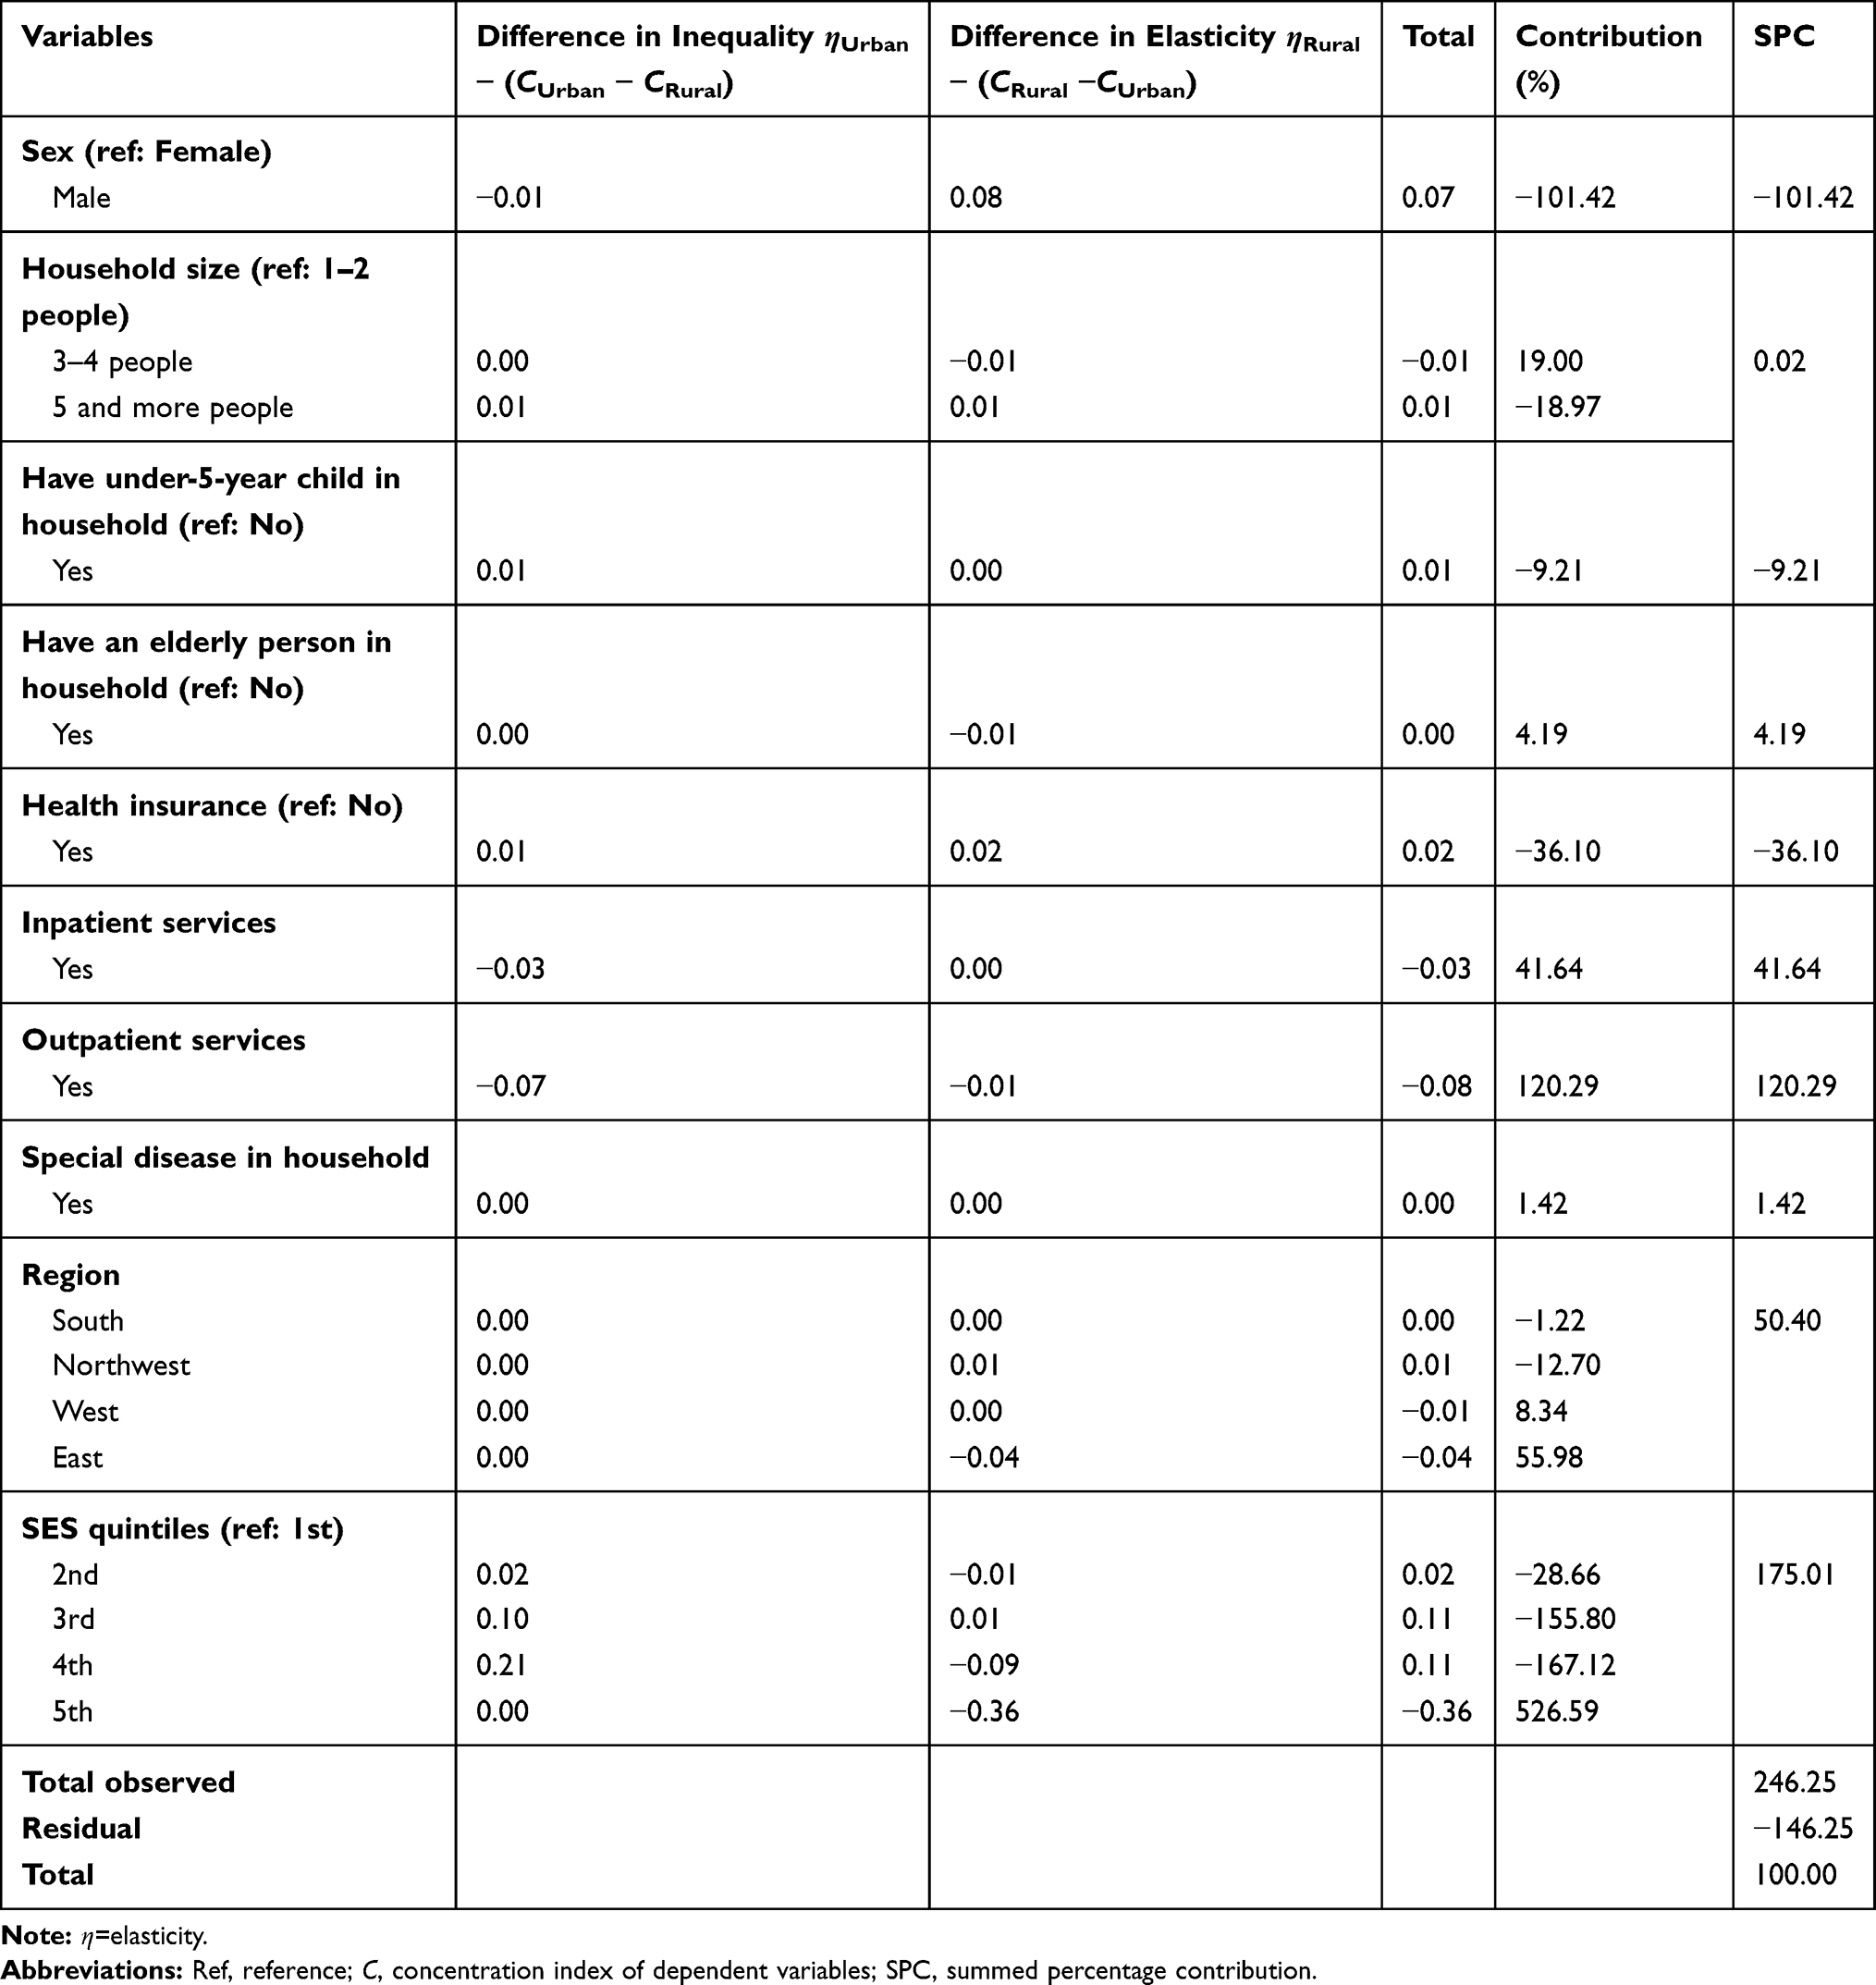 |
Table 6 Blinder–Oaxaca Decomposition of Differences in Socioeconomic Inequality in CHE in Rural and Urban Areas of Iran, 2017 |
Discussion
This study measured and decomposed the SES inequalities of CHE among Iranian households in rural and urban areas using national survey data for the year 2017. The extent of the overall CHE in our study was less than one-fourth of that reported in 2001 (3.32% vs 15.3%),23 and as high as that reported by many other studies (2.5% to 3.9%) before the implementation of the HTP in Iran.24–26 Similarly, evidence from households in low-income Latin American countries revealed a wide variation in the magnitude of CHE.4 Countries such as the Czech Republic, Slovakia, and the UK experienced zero CHE, while the underresourced countries such as Brazil and Vietnam had CHE of more than 10%.18 The overall CHE in our study is more than six times that reported from Turkey (3.67% vs 0.6%), and more than three and a half times lower (3.32% vs 13%) than that of China. However, consistent with the reports of studies in Turkey and China,27,28 our findings indicated a higher risk of CHE among the lower SES groups and rural residents.
The proportion of CHE for Tehran province (2.31%) in our study was markedly lower than the findings reported during 2011 and 2012 from the same city.29,30 However, the CHE for Guilan province in our study was considerably higher than that reported from a study 1 year after the implementation of the HTP in the same province.2 The rise of CHE in our study implies a higher OOP that may be associated with the increased inflation rate of the Iranian currency or a gap in the insurance coverage for some services, such as drugs and outpatient services.31 Overall, the high CHE revealed in our findings implies that the HTP did not significantly reduce the OOPs of the households, and the inequality in CHE remained pro-rich.
Evidence from a developing country in Africa reported that non-poor residents were more likely to use healthcare services and less likely to experience CHE than poor residents.32 In India, a study reported the existence of a difference in economic burden and the impact of OOPs between urban and rural residents, and among states within the country.33 Our findings also revealed differences in the magnitude of CHE and its inequality among the provinces and regions in Iran. The west and north of the country had the highest and lowest CHE, respectively. The eastern region of Iran showed the lowest inequality in CHE, whereas the northern region had the highest socioeconomic inequality.
The socioeconomic inequality in CHE among the households in this study was significantly pro-rich (p<0.05), with the highest socioeconomic inequality values in Qazvin and South Khorasan provinces. The northern region had the highest pro-rich inequality. Despite the households residing in rural areas having higher CHE, the inequality was higher in urban areas. These pro-rich inequalities in CHE are consistent with the reports of many studies in China.20,34,35 For example, Xu et al reported that CHE was concentrated mainly among population groups with lower SES.20 Evidence from Iran shows the Gini coefficient for low income per capita, unemployment rate, and inflation rate to be positively correlated with CHE. The people with a higher per capita income had a lower proportion of CHE.36 Other studies from developed countries also reported a higher risk of CHE among the lowest income households than the highest income ones.37,38 Unlike in our findings, the provinces located in northern, northeastern, and central parts of Iran were reported to have better access to healthcare services.39 The reasons for this difference require further investigation. However, the incidence of CHE with GDP per capita, and the share of the GDP spent on health are reported to be positive. Also, there is a negative association between CHE and the proportion of total health expenditure allocated from the social security funds and other government agencies.40
Being an urban resident was associated with a lower risk of CHE. These findings are consistent with study findings in India, which reported the occurrence of a significantly higher CHE among rural residents and households with smaller family size.33,41 The lower risk of CHE among households with a larger family may imply that large families have better opportunity for pooling funds from past savings for use in the worst situations. Nevertheless, having lower economic status and having elderly people in the household were significantly associated with an increased risk of CHE in rural and urban areas. Also, the increased risk of CHE from outpatient and inpatient healthcare services resulted in the concentration of service utilization by pro-rich households. Others also reported economic status, and inpatient and outpatient services use as the main determinants of CHE.20,34,35,42 Overall, our findings imply the need for policy interventions that aim to reduce CHE among rural residents, low socioeconomic groups, and elderly people.
The small contribution of households with family members having specific diseases to the inequality in CHE implies the protective effect of health insurance against the risk of CHE for those with special health needs. The Iranian government’s commitment to allocating fiscal recourses to reduce OOPs and eliminate barriers to access to healthcare services for citizens11 may have contributed to the lowering of the inequality in CHE. Nevertheless, the magnitude of CHE in our findings remained considerably high, and the HTP seems to have had less effect on decreasing the CHE to the stated target of 1%.8,14,15
A study carried out before the implementation of the HTP in Tehran reported pro-rich inequality in CHE, mainly explained by the economic status of the households. Also, household size (8%), lack of health insurance (6%), and being a female-headed household (5%) positively contributed to CHE. Despite the negative contribution of health services utilization to CHE, having under-five children did not show an effect on CHE.29 A previous study found that about 8% of the population fell below the poverty line owing to OOP health expenditure, and outpatient care was the main contributing factor.33 Our findings revealed that utilization of outpatient services made a higher contribution to inequality in CHE than utilization of inpatient services, in both rural and urban areas. This means that the financial protection for outpatient services is lower than for inpatient services. It worth noting that, since the implementation of HTP, more than 90% of the costs of inpatient services provided by public hospitals in Iran are covered by governmental subsidies. However, the coverage of outpatient services is poor and a considerable part of these services is not covered by health insurance or the government. The success of primary healthcare in the prevention and control of common childhood illnesses in Iran may have contributed to the prevention of CHE. The low contribution of health insurance coverage observed in our study on CHE may be due to the subsidized health insurance, with no premiums for any uninsured Iranians included in the HTP. Fair financial protection of citizens from CHE requires not only an adequate and sustainable financial commitment43 but also clear policies to guide successes.
In contrast, before the introduction of the HTP, households in a higher SES rank were more likely to experience CHE44 because they had the potential to utilize more healthcare services. Also, the better-off households were more likely to use private health facilities and have a higher risk of CHE.45 However, after the implementation of the HTP, improving health insurance coverage and decreasing the coinsurance in the public sector have reduced the gap between different SES groups regarding the utilization of healthcare services. A study in South Korea reported significantly higher transfer and loan incomes than earned, business, and property incomes in households with CHE than in those without CHE.46
Evidence from China showed that the households’ economic status positively contributed to the disparity in CHE, while the inpatient and outpatient services contributed negatively.47 Another study, which investigated the effect of universal coverage policy on CHE in Thailand, reported that a higher proportion of elderly members, people with chronic diseases or disabled members, and hospitalization had an increased likelihood of facing CHE.45 Furthermore, a study in an urban setting in Thailand found that the proportion of CHE was 12.5% among the poor and 7.1% among other groups, after 7 years of the implementation of the universal coverage policy.48
Investigating the main contributors of difference in inequality in exposure to CHE in urban and rural areas indicated that SES, itself, is the main positive contributor to this gap. Also, utilization of outpatient services increased the inequality difference between urban and rural residents. On the other hand, the sex of the head of the household, health insurance coverage, and having under-five children decreased inequality between urban and rural areas.
The high proportion of OOPs for outpatient services expenditure may be related to an increased demand by the clients for healthcare services owing to the implementation of the HTP in Iran. The increase in utilization of healthcare services may lead to CHE of households that do not have health insurance coverage. Thus, social health insurance and tax-based health insurance schemes are of paramount importance in protecting citizens from CHE.18 In Turkey, a reform that resulted in the unification of health financing for more than a decade revealed that the redistribution of wealth in the health financing system has benefitted the rich more than the poor.49 However, the implementation of the rural family physician program, health insurance policies, and economic subsidies did not play significant roles in realizing healthcare financing in the country.50,51 Overall, a well-designed program is needed to improve financial protection for households to ensure fair access to healthcare services.
Strengths and Limitations of the Study
This study comprehensively analyzed the extent of socioeconomic inequality in CHE across the provinces and regions in Iran. This is the first attempt to compare inequality in CHE in rural and urban areas of Iran and to decompose contributors of difference in inequality. The CHE inequality decomposition provided valuable insights for policymakers to make changes to reduce the persisting socioeconomic inequality in CHE in this context, and contributes as a basis for further investigation in the field. The use of data representing Iranian households from the ISC helps to ensure the credibility and reliability of the study. However, the limited database may have affected the precision and comprehensiveness of the determinants in our findings. In addition, this is a cross-sectional study and the results are not easily generalizable to other populations, so they should be interpreted cautiously.
Implication of the Findings
The high proportion of CHE among households across Iran and the statistically significant concentration of pro-rich inequality in CHE among residents of the provinces found in the central, northeastern, eastern, southern, and southwestern regions of Iran implies a wide disparity in the socioeconomic status of the citizens. This issue not only calls for a reduction in the high CHE for policymakers in the health and finance sectors, but also needs a multisectorial approach to improve the financing function of the Iranian health system.
Conclusions
The findings of our study revealed a high CHE and statistically significant pro-rich inequality in CHE in Iran, in both rural and urban areas. Thus, the HTP should be revised and improved with more focus on low-SES households, to reduce CHE and its disparities. Optimizing health insurance coverage for vulnerable groups, and especially for outpatient healthcare services, could reduce the magnitude of CHE and narrow the socioeconomic disparity in CHE. Further investigation on factors that hinder the reduction of the CHE could help to improve the implementation of the HTP in this context.
Abbreviations
UHC, universal health coverage; CHE, catastrophic health expenditure; OOP, out-of-pocket payment; HTP, Health Transformation Plan; ISC, Iran Statistical Center; SES, socioeconomic status; CTP, capacity to pay; WHO, World Health Organization; LMMU, lifetime money metric utility; C, concentration index; vs, versus; SD, standard deviation.
Ethics Approval and Consent to Participate
This study was approved by the Research Ethics Committee of Kermanshah University of Medical Sciences (no. IR.KUMS.REC.1398.348).
Acknowledgments
We are grateful to the deputy of research and technology of Kermanshah University of Medical Science for financial support for this study (fund no. 980505). Also, we would like to thank Iran Statistical Center for providing data for the study.
Author Contributions
All authors made a significant contribution to the work reported, whether that is in the conception, study design, execution, acquisition of data, analysis and interpretation, or in all these areas; took part in drafting, revising or critically reviewing the article; gave final approval of the version to be published; have agreed on the journal to which the article has been submitted; and agree to be accountable for all aspects of the work.
Funding
This study funded by Kermanshah University of Medical Science (fund no. 980505).
Disclosure
The authors declare that they have no competing interests.
References
1. Murray CJ, Frenk J. A framework for assessing the performance of health systems. Bull World Health Organ. 2000;78:717–731.
2. Rad EH, Yazdi-Feyzabad V, Yousefzadeh-Chabok S, Afkar A, Naghibzadeh A. Pros and cons of the health transformation program in Iran: evidence from financial outcomes at the household level. Epidemiol Health. 2017;39. doi:10.4178/epih.e2017029
3. Qosaj FA, Froeschl G, Berisha M, Bellaqa B, Holle R, Allocation R. Catastrophic expenditures and impoverishment due to out-of-pocket health payments in Kosovo. Cost Eff Resour Alloc. 2018;16(1):26.
4. Xu K, Evans DB, Kawabata K, Zeramdini R, Klavus J, Murray CJ. Household catastrophic health expenditure: a multicountry analysis. Lancet. 2003;362(9378):111–117. doi:10.1016/S0140-6736(03)13861-5
5. Xu K, World Health Organization. Distribution of Health Payments and Catastrophic Expenditures Methodology. Geneva: World Health Organization; 2005:1–11.
6. World Health Organization. Designing Health Financing Systems to Reduce Catastrophic Health Expenditure; 2005.
7. Van Doorslaer E, O’Donnell O, Rannan-Eliya RP, et al. Effect of payments for health care on poverty estimates in 11 countries in Asia: an analysis of household survey data. Lancet. 2006;368(9544):1357–1364.
8. Rezaei S, Woldemichael A, Hajizadeh M. Catastrophic healthcare expenditures among Iranian households: a systematic review and meta-analysis. Int J Hum Rights Healthcare. 2019.
9. Moghaddam AV, Damari B, Alikhani S, et al. Health in the 5th 5-years Development Plan of Iran: main challenges, general policies and strategies. Iran J Public Health. 2013;42(Supple1):42.
10. Wagstaff A. Poverty and health sector inequalities. Bull World Health Organ. 2002;80:97–105.
11. Moradi-Lakeh M, Vosoogh-Moghaddam A. Health sector evolution plan in Iran; equity and sustainability concerns. Int J Health Plann Manag. 2015;4(10):637–640. doi:10.15171/ijhpm.2015.160
12. Ghiasvand H, Gorji HA, Maleki M, Hadian M. Catastrophic health expenditure among Iranian rural and urban households, 2013–2014. Iran Red Crescent Med J. 2015;17:9. doi:10.5812/ircmj.30974
13. Reshadat S, Najafi F, Karami-Matin B, et al. Measuring financial protection in hospitalized patients after the health sector evolution plan in Iran. Health Scope. 2017;6(4).
14. Yazdi-Feyzabadi V, Bahrampour M, Rashidian A, Haghdoost -A-A, Akbari Javar M, Mehrolhassani MH. Prevalence and intensity of catastrophic health care expenditures in Iran from 2008 to 2015: a study on Iranian household income and expenditure survey. Int J Equity Health. 2018;17(1):44. doi:10.1186/s12939-018-0743-y
15. Piroozi B, Moradi G, Nouri B, Bolbanabad AM, Safari H. Catastrophic health expenditure after the implementation of health sector evolution plan: a case study in the west of Iran. Int J Health Policy Manag. 2016;5(7):417.
16. Murray CJ, Xu K, Klavus J, et al. Assessing the Distribution of Household Financial Contributions to the Health System: Concepts and Empirical Application. Health Systems Performance Assessment: Debates, Methods and Empiricism. Geneva: World Health Organization; 2003:12.
17. Rashidian A, Sari AA, Hoseini SM, Soofi M, Ameri H. Comparison of the thresholds of households’ exposure to catastrophic health expenditure in iran and brazil, and selection of the most appropriate threshold. Iran J Public Health. 2018;47(12):1945–1952.
18. Xu K, Evans DB, Carrin G, Aguilar-Rivera AM, Musgrove P, Evans T. Protecting households from catastrophic health spending. Health Aff. 2007;26(4):972–983. doi:10.1377/hlthaff.26.4.972
19. Wagstaff A. Measuring catastrophic medical expenditures: reflections on three issues. Health Econ. 2019;28(6):765–781. doi:10.1002/hec.3881
20. Xu Y, Gao J, Zhou Z, et al. Measurement and explanation of socioeconomic inequality in catastrophic health care expenditure: evidence from the rural areas of Shaanxi Province. BMC Health Serv Res. 2015;15(1):256. doi:10.1186/s12913-015-0892-2
21. O'Donnell O, van Doorslaer E, Wagstaff A, Lindelow M. Analyzing Health Equity Using Household Survey Data: A Guide to Techniques and Their Implementation. Washington, DC: World Bank; 2008. © World Bank. Available from: https://openknowledge.worldbank.org/handle/10986/6896. License: CC BY 3.0 IGO
22. Wagstaff A, Van Doorslaer E, Watanabe N. On decomposing the causes of health sector inequalities with an application to malnutrition inequalities in Vietnam. J Econom. 2003;112(1):207–223. doi:10.1016/S0304-4076(02)00161-6
23. Soofi M, Rashidian A, Aabolhasani F, Sari AA, Bazyar M. Measuring the exposure of households to catastrophic healthcare expenditures in Iran in 2001: the World Health Organization and the World Bank’s Approach. Hosp J. 2013;12(2):39–50.
24. Venkatachalam L. The contingent valuation method: a review. Environ Impact Assess Rev. 2004;24(1):89–124. doi:10.1016/S0195-9255(03)00138-0
25. Cheraghi-Sohi S, Hole AR, Mead N, et al. What patients want from primary care consultations: a discrete choice experiment to identify patients‘ priorities. Ann Fam Med. 2008;6(2):107–115. doi:10.1370/afm.816
26. Hajizadeh M, Connelly LB, Butler JRG, Khosravi A. Unmet need and met unneed in health care utilisation in Iran. Int J Soc Econ. 2012;39(6):400–422. doi:10.1108/03068291211224919
27. Yardim MS, Cilingiroglu N, Yardim N. Catastrophic health expenditure and impoverishment in Turkey. Health Policy (New York). 2010;94(1):26–33. doi:10.1016/j.healthpol.2009.08.006
28. Li Y, Wu Q, Xu L, et al. Factors affecting catastrophic health expenditure and impoverishment from medical expenses in China: policy implications of universal health insurance. Bull World Health Organ. 2012;90:664–671.
29. Kavosi Z, Rashidian A, Pourreza A, et al. Inequality in household catastrophic health care expenditure in a low-income society of Iran. Health Policy Plan. 2012;27(7):613–623. doi:10.1093/heapol/czs001
30. Kermani MS, Ghaderi H, Yousefi A. Demand for medical care in the urban areas of Iran: an empirical investigation. Health Econ. 2008;17(7):849–862. doi:10.1002/hec.1308
31. Karyani AK, Rashidian A, Sari AA, Sefiddashti SE. Developing attributes and levels for a discrete choice experiment on basic health insurance in Iran. Med J Islam Repub. 2018;32:26.
32. Liu K, Cook B. Health inequality and community-based health insurance: a case study of rural Rwanda with repeated cross-sectional data. Int J Public Health. 2019;64(1):7–14.
33. Sangar S, Dutt V, Thakur RJ. Coping with out-of-pocket health expenditure in India: evidence from NSS 71st round. Global Social Welfare. 2020;7:1–10.
34. Gu H, Kou Y, Yan Z, et al. Income related inequality and influencing factors: a study for the incidence of catastrophic health expenditure in rural China. BMC Public Health. 2017;17(1):727. doi:10.1186/s12889-017-4713-x
35. Si Y, Zhou Z, Su M, Ma M, Xu Y, Heitner J. Catastrophic healthcare expenditure and its inequality for households with hypertension: evidence from the rural areas of Shaanxi Province in China. Int J Equity Health. 2017;16(1):27. doi:10.1186/s12939-016-0506-6
36. Mosavi Jahromi Y, Hassani M, Mazosaz S. The effect of development level on the exposure rate of urban households with high cost of health in Iran: 2005–2011. Q J Econ Model Shahid Beheshti Univ. 2014;4(19):60–77.
37. Del Pozo-Rubio R, Mínguez-Salido R, Pardo-García I, Escribano-Sotos FJ. Catastrophic long-term care expenditure: associated socio-demographic and economic factors. Eur J Health Econ. 2019;1–11.
38. Callander EJ, Fox H, Lindsay D. Out-of-pocket healthcare expenditure in Australia: trends, inequalities and the impact on household living standards in a high-income country with a universal health care system. Health Econ Rev. 2019;9(1):10.
39. Bahrami R, Rezaei MJ. Development of the Iranian provinces in health indices using Morris Model and linear TOPSIS method. J Kermanshah Univ Med Sci. 2016;19(7):413–426.
40. Wagstaff A, Flores G, Hsu J, et al. Progress on catastrophic health spending in 133 countries: a retrospective observational study. Lancet Global Health. 2018;6(2):e169–e179. doi:10.1016/S2214-109X(17)30429-1
41. Sangar S, Dutt V, Thakur RJ. Economic burden, impoverishment and coping mechanisms associated with out-of-pocket health expenditure: analysis of rural-urban differentials in India. J Public Health. 2018;26(5):485–494.
42. Kien VD, Van Minh H, Giang KB, Dao A, Tuan LT, Ng N. Socioeconomic inequalities in catastrophic health expenditure and impoverishment associated with non-communicable diseases in urban Hanoi, Vietnam. Int J Equity Health. 2016;15(1):169. doi:10.1186/s12939-016-0460-3
43. Fazaeli AA, Seyedin H, Vosoogh Moghaddam A, et al. Fairness of financial contribution in iranian health system: trend analysis of national household income and expenditure, 2003–2010. Glob J Health Sci. 2015;7(5):260–265. doi:10.5539/gjhs.v7n5p260
44. Fazaeli AA, Ghaderi H, Fazaeli AA, Lotfi F, Salehi M, Mehrara MJG. Main determinants of catastrophic health expenditures: a Bayesian logit approach on Iranian household survey data (2010). Glob J Health Sci. 2015;7(4):335.
45. Somkotra T, Lagrada LP. Which households are at risk of catastrophic health spending: experience in Thailand after universal coverage. Health Aff. 2009;28(3):w467–w78.
46. Kim Y, Yang B. Relationship between catastrophic health expenditures and household incomes and expenditure patterns in South Korea. Health Policy. 2011;100(2–3):239–246.
47. Wang Z, Li X, Chen M. Catastrophic health expenditures and its inequality in elderly households with chronic disease patients in China. Int J Equity Health. 2015;14(1):8.
48. Weraphong J, Pannarunothai S, Luxananun T, Junsri N, Deesawatsripetch S. Catastrophic health expenditure in an urban city: seven years after universal coverage policy in Thailand. Southeast Asian J Trop Med Public Health. 2013;44(1):124–136.
49. Cinaroglu S, Baser O. Does the unification of health financing affect the distribution pattern of out-of-pocket health expenses in Turkey? Int J Social Welfare. 2019;28(3):293–306. doi:10.1111/ijsw.12389
50. Zandian H, Olyaeemanesh A, Takian A, Hosseini M. Contribution of targeted subsidies law to the equity in healthcare financing in Iran: exploring the challenges of policy process. Electron Physician. 2016;8(2):1892.
51. Aryankhesal A, Etemadi M, Mohseni M, Azami-Aghdash S, Nakhaei M. Catastrophic health expenditure in Iran: a review article. Iran J Public Health. 2018;47(2):166–177.
 © 2020 The Author(s). This work is published and licensed by Dove Medical Press Limited. The
full terms of this license are available at https://www.dovepress.com/terms
and incorporate the Creative Commons Attribution
- Non Commercial (unported, 3.0) License.
By accessing the work you hereby accept the Terms. Non-commercial uses of the work are permitted
without any further permission from Dove Medical Press Limited, provided the work is properly
attributed. For permission for commercial use of this work, please see paragraphs 4.2 and 5 of our Terms.
© 2020 The Author(s). This work is published and licensed by Dove Medical Press Limited. The
full terms of this license are available at https://www.dovepress.com/terms
and incorporate the Creative Commons Attribution
- Non Commercial (unported, 3.0) License.
By accessing the work you hereby accept the Terms. Non-commercial uses of the work are permitted
without any further permission from Dove Medical Press Limited, provided the work is properly
attributed. For permission for commercial use of this work, please see paragraphs 4.2 and 5 of our Terms.