
Back to Journals » Vascular Health and Risk Management » Volume 22
Explainable Machine Learning for Risk Prediction of Reduced Quality of Life in Hypertension
Authors Andala S  , Iqhrammullah M , Agusri A, De Liyis BG, Rampengan DD , Rampengan SH, Fahdhienie F, Habiburrahman M
Received 3 April 2026
Accepted for publication 1 July 2026
Published 14 July 2026 Volume 2026:22 614061
DOI https://doi.org/10.2147/VHRM.S614061
Checked for plagiarism Yes
Review by Single anonymous peer review
Peer reviewer comments 2
Editor who approved publication: Professor Mirna N Chahine
Sri Andala,1 Muhammad Iqhrammullah,2 Agusri Agusri,1 Bryan Gervais De Liyis,3 Derren DCH Rampengan,4 Starry Homenta Rampengan,5,6 Farrah Fahdhienie,2 Muhammad Habiburrahman7
1Undergraduate Nursing Program, STIKes Muhammadiyah Lhokseumawe, Lhokseumawe, Indonesia; 2Postgraduate Program of Public Health, Universitas Muhammadiyah Aceh, Banda Aceh, Indonesia; 3Department of Neurosurgery, National Brain Center Mahar Mardjono Hospital, Jakarta, Indonesia; 4Faculty of Medicine, Sam Ratulangi University, Manado, Indonesia; 5Department of Cardiology and Vascular Medicine, Faculty of Medicine, Sam Ratulangi University, Manado, Indonesia; 6Department of Cardiology and Vascular Medicine, R.D. Kandou Central General Hospital, Manado, Indonesia; 7Faculty of Medicine, Imperial College London, London, UK
Correspondence: Muhammad Iqhrammullah, Postgraduate Program of Public Health, Universitas Muhammadiyah Aceh, Banda Aceh, Indonesia, Email [email protected] Muhammad Habiburrahman, Faculty of Medicine, Imperial College London, London, UK, Email [email protected]
Background: Individuals with hypertension are at risk to reduced quality of life (QoL). Explainable machine learning (ML) can be used for domain-specific risk stratification and prioritization of modifiable determinants of low QoL.
Objective: To train ML classifier algorithms for QoL risk stratification in hypertension, where meaningful determinants were explored through Shapley additive explanations (SHAP).
Methods: Data from hypertensive individuals (n = 534) completed WHOQOL BREF, Quick Physical Activity Rating, Morisky Medication Adherence Scale 8, and standardized questionnaires for acceptance and knowledge were analyzed utilizing Decision Tree, Gradient Boosting, XGBoost, AdaBoost, Random Forest, and Naive Bayes ML classifiers. The trained ML algorithms were evaluated using stratified 10-fold cross-validation, where the stability was examined using rank-based metrics. SHAP were applied to the gradient boosting, as the most stable model.
Results: For physical QoL, Random Forest (AUC 0.850; sensitivity 0.835; specificity 0.738) and Gradient Boosting (AUC 0.850; sensitivity 0.801; specificity 0.764) showed good reduced QoL identification. For psychological domain, best classifications were obtained from Gradient Boosting performed best (AUC 0.833; sensitivity 0.818; specificity 0.651) and XGBoost (AUC 0.831; sensitivity 0.824; specificity 0.660), with the former observed as the most stable SHAP analysis identified acceptance and medication adherence as the dominant shared drivers of risk across both QoL domains. Physical QoL risk was further influenced by physical activity–related factors, whereas Psychological QoL risk showed additional contributions from age and educational attainment.
Conclusion: Ensemble tree–based classifiers, particularly Gradient Boosting, had the most optimal performance in discriminating reduced and good QoL. Acceptance and medication adherence are the most influential shared drivers of risk, while physical activity, age, and educational attainment contributed to domain-specific heterogeneity.
Keywords: algorithm, ensemble tree, gradient boosting, random forest SHAP, XGBoost
Introduction
Hypertension has been estimated to affect approximately 1.28 billion adults aged 30 to 79 years globally, based on a pooled analysis of 1201 population representative studies including about 104 million participants across 1990 to 2019.1 Control of elevated blood pressure has nevertheless remained suboptimal, despite some improvement over time. In 2010, control was achieved in only 10.9% of men and 16.8% of women.2 By 2019, these rates had increased to 18.0% among men and 23.0% among women, but still remained below one-quarter of individuals with hypertension.1 The hypertension care pathway is increasingly considered a longitudinal process in which diagnostic and management strategies are expected to be aligned with real world implementation constraints and patient centered priorities.3 One thing to note is that the burden of hypertension has not been confined to just clinical events, since impairments in perceived health status and daily functioning have been frequently reported among affected individuals.4 Quality of life (QoL) has been conceptualized as a multidimensional construct that extends beyond symptom metrics and organ specific endpoints, supporting its use as a clinically meaningful outcome in chronic disease research.5 Within the World Health Organization QoL (WHOQOL) project, QoL was defined as an individual’s perception of position in life within cultural contexts and in relation to goals, expectations, standards, and concerns.6
A systematic review and meta-analysis of observational studies showed a measurable reduction in QoL among hypertensive individuals, with pooled decrements of approximately 2.43 points in the physical component and 1.68 points in the mental component across widely used instruments.7 Suboptimal adherence has been described as a major contributor to poor blood pressure control, encompassing failure to initiate therapy, to take medications as prescribed, and to persist over time.8 In outpatient populations, multimorbidity and poor blood pressure control have been associated with poorer adherence patterns, illustrating the clinical complexity in routine hypertension care.9 Behavioral determinants have also been implicated, as a randomized physical activity intervention delivered in primary care was associated with improved cardiovascular health indices and improved health related QoL, alongside more favorable blood pressure control.10 In Indonesian data, knowledge and acceptance were reported to be associated with medication adherence,11 indicating that psychosocial adaptation and disease understanding may represent modifiable pathways relevant to QoL.
Artificial intelligence (AI) methods have been increasingly applied in cardiovascular medicine for improved phenotyping, risk prediction, and precision prevention strategies.12 In the case of hypertension, contemporary reviews have summarized applications of AI across blood pressure measurement, diagnosis, prognostication, and management, while emphasizing clinician centered implementation requirements.13 Stakeholder syntheses have highlighted that machine learning (ML) may enable individualized hypertension care, while challenges in generalizability and real world deployment have remained substantial.3 For prediction models developed using regression or ML methods, the Transparent Reporting of a multivariable prediction model for Individual Prognosis Or Diagnosis (TRIPOD) AI statement has provided updated reporting guidance to strengthen transparency and reproducibility.14 In an analysis of European QoL five dimension three level (EQ 5D 3L) health utility in older adults with stroke complicated by hypertension, nonlinear risk modelling was performed using tree based ensemble classifiers including random forest and extreme gradient boosting (XGBoost), and model interpretability was supported through Shapley additive explanations (SHAP) based feature attribution to rank determinants of reduced health related QoL.15
Despite the substantial global burden of hypertension and the consistent evidence of compromised QoL, routine clinical stratification remains largely focused on blood pressure values and traditional risk markers rather than patient centered wellbeing. This may be particularly problematic in resource-limited settings, where time, workforce, and access to comprehensive psychosocial assessment are often constrained. In this context, explainable ML may support routine hypertension management by using available patient data to identify individuals predicted to have reduced QoL and by highlighting modifiable factors that may require attention, such as medication adherence, illness acceptance, and physical activity. Such models are not intended to replace clinical judgment or formal QoL assessment, but they may support database-based risk stratification and help prioritize patients for closer monitoring or targeted behavioral support.
The present study was positioned to address this need by evaluating multiple classifier models for QoL risk stratification in hypertensive individuals and by characterizing the most influential drivers of low QoL using interpretable explanations. Among the WHOQOL-BREF domains, the physical and psychological domains are particularly relevant in hypertension because they reflect functional limitation, energy, daily activity, emotional wellbeing, illness acceptance, and perceived disease burden. These dimensions are closely related to self-management behaviors, including medication adherence and physical activity, which are central to long-term hypertension care. Therefore, the explainable ML models developed in the present study focused on these domains.
Methods
Study Design and Data Source
This secondary analysis used data derived from a previously published cross-sectional study by Andala et al conducted among individuals with hypertension in Aceh Province, Indonesia.11 The original investigation was carried out between March and July 2023, and the data collection protocol has been described in detail elsewhere.11 The objective of the present secondary analysis was to identify ML classifiers for risk stratification of reduced QoL among individuals with hypertension, rather than to determine causal relationships between predictors and QoL outcomes.
Ethical approval for the primary study was obtained from the Ethics Committee of the Faculty of Nursing, Universitas Syiah Kuala, Banda Aceh, Indonesia [approval number: 11302030122].11 The approval was obtained from this institution because the primary study was undertaken while the first author was attending Universitas Syiah Kuala. All participants provided written informed consent. The present analysis used anonymized data and involved no additional participant contact.
The dataset comprised 534 adults with hypertension recruited from community and healthcare settings in Aceh Province. The minimum required sample size in the primary study was 494 respondents,11 as estimated using the Fleiss method on the OpenEpi platform.16 Therefore, the sample size included in the present analysis exceeded the minimum required sample size. This study was conducted and reported in accordance with the TRIPOD-AI guidelines for prediction models developed using machine learning methods.
Case Definition and Eligibility Criteria
As reported in the primary study,11 all participants had an established diagnosis of hypertension to be eligible for inclusion. Hypertension status was categorized based on systolic blood pressure (SBP) as follows: controlled hypertension (<140 mmHg), grade I hypertension (140–159 mmHg), and grade II hypertension (160–179 mmHg), and severe hypertension (≥180 mmHg). The present analysis focused on individuals with primary hypertension. Participants were excluded if they had secondary hypertension, a history of cerebrovascular or cardiovascular complications, including stroke, transient ischemic attack, coronary heart disease, or heart failure, or physical disability that could interfere with questionnaire completion or QoL assessment.
Variables
QoL was assessed using the WHOQOL-BREF, with analyses focusing on the physical (Domain 1) and psychological (Domain 2) domains. Each domain score was dichotomized into reduced QoL (<60) and good QoL (≥60). Both the domain selection and the cutoff were determined based on the distribution of participants in the available dataset, with the aim of obtaining sufficiently balanced outcome groups for supervised machine learning classification. Separate classification models were developed for each QoL domain. Predictor variables were selected based on clinical relevance and availability in the original dataset and included sociodemographic factors (age, sex, education level, marital status, ethnicity, and occupation), a clinical characteristic (body mass), behavioral factors (medication adherence assessed using the Morisky Medication Adherence Scale–8), psychosocial factors (disease acceptance score), and physical activity measures derived from the Quick Physical Activity Rating, including total physical activity score and weekly physical activity duration (minutes). QoL, medication adherence, disease acceptance, and physical activity were assessed using translated instruments that had been validated in Indonesian populations.11,17 All variables were measured at baseline in the original study.11
Data Preprocessing
All variables in the dataset were complete, and no missing data were present. Categorical variables were converted to string format and encoded using one-hot encoding, with unknown categories ignored during model training. All preprocessing steps were implemented within machine learning pipelines.
Machine Learning Models and Evaluation
Six supervised machine learning classifiers were trained for QoL risk stratification, including Decision Tree, Random Forest, Gradient Boosting, XGBoost, AdaBoost, and Naïve Bayes. Model development and evaluation were performed separately for physical and psychological QoL outcomes. Model performance was assessed using stratified 10-fold cross-validation to preserve outcome class distribution. Evaluation metrics included the area under the receiver operating characteristic curve (AUC), sensitivity, specificity, accuracy, and F1 score. Confusion matrices were pooled across cross-validation folds to derive sensitivity and specificity estimates. Model stability was examined using rank-based consistency of performance metrics across folds, and the most stable high-performing model was selected for subsequent interpretability analysis. The analyses were conducted in Python 3.14.5 using scikit-learn and XGBoost for machine learning model development and evaluation.
Explainability Analysis
To identify meaningful determinants of reduced QoL, feature importance was first examined using Random Forest models for both physical and psychological QoL to support completeness of reporting and provide a complementary, model-based ranking of predictors. In addition, SHAP analyses were applied to the Gradient Boosting model, which demonstrated robust performance and stable ranking across QoL domains. SHAP values were used to quantify both the magnitude and direction of each predictor’s contribution and to compare shared and domain-specific determinants of QoL risk. The analysis was conducted in Python 3.14.5 using the SHAP library.
Results
Characteristics of the Participants
The study population was predominantly female across all QoL groups, with women accounting for more than 80% of participants in both reduced and good physical and psychological QoL categories. The mean age was above 55 years in all groups. Most participants were married, Acehnese, and worked as housewives. Based on body mass category, normal weight and obesity were the most common categories across the QoL groups. Most participants were classified as having grade I hypertension across both physical and psychological QoL groups, followed by grade II hypertension. Only one participant had controlled blood pressure at assessment, while severe hypertension was observed in approximately 5–6% of participants across groups.
Participants with reduced QoL generally showed lower acceptance scores, lower medication adherence scores, and lower physical activity scores than those with good QoL in both the physical and psychological domains. For physical QoL, the mean acceptance score was 23.91 ± 4.36 in the reduced QoL group and 25.53 ± 7.55 in the good QoL group. A similar pattern was observed for psychological QoL, with lower acceptance scores in the reduced QoL group (23.45 ± 5.07) than in the good QoL group (26.30 ± 7.09). Medication adherence and physical activity scores also followed this pattern. The summary of participant characteristics is presented in Table 1.
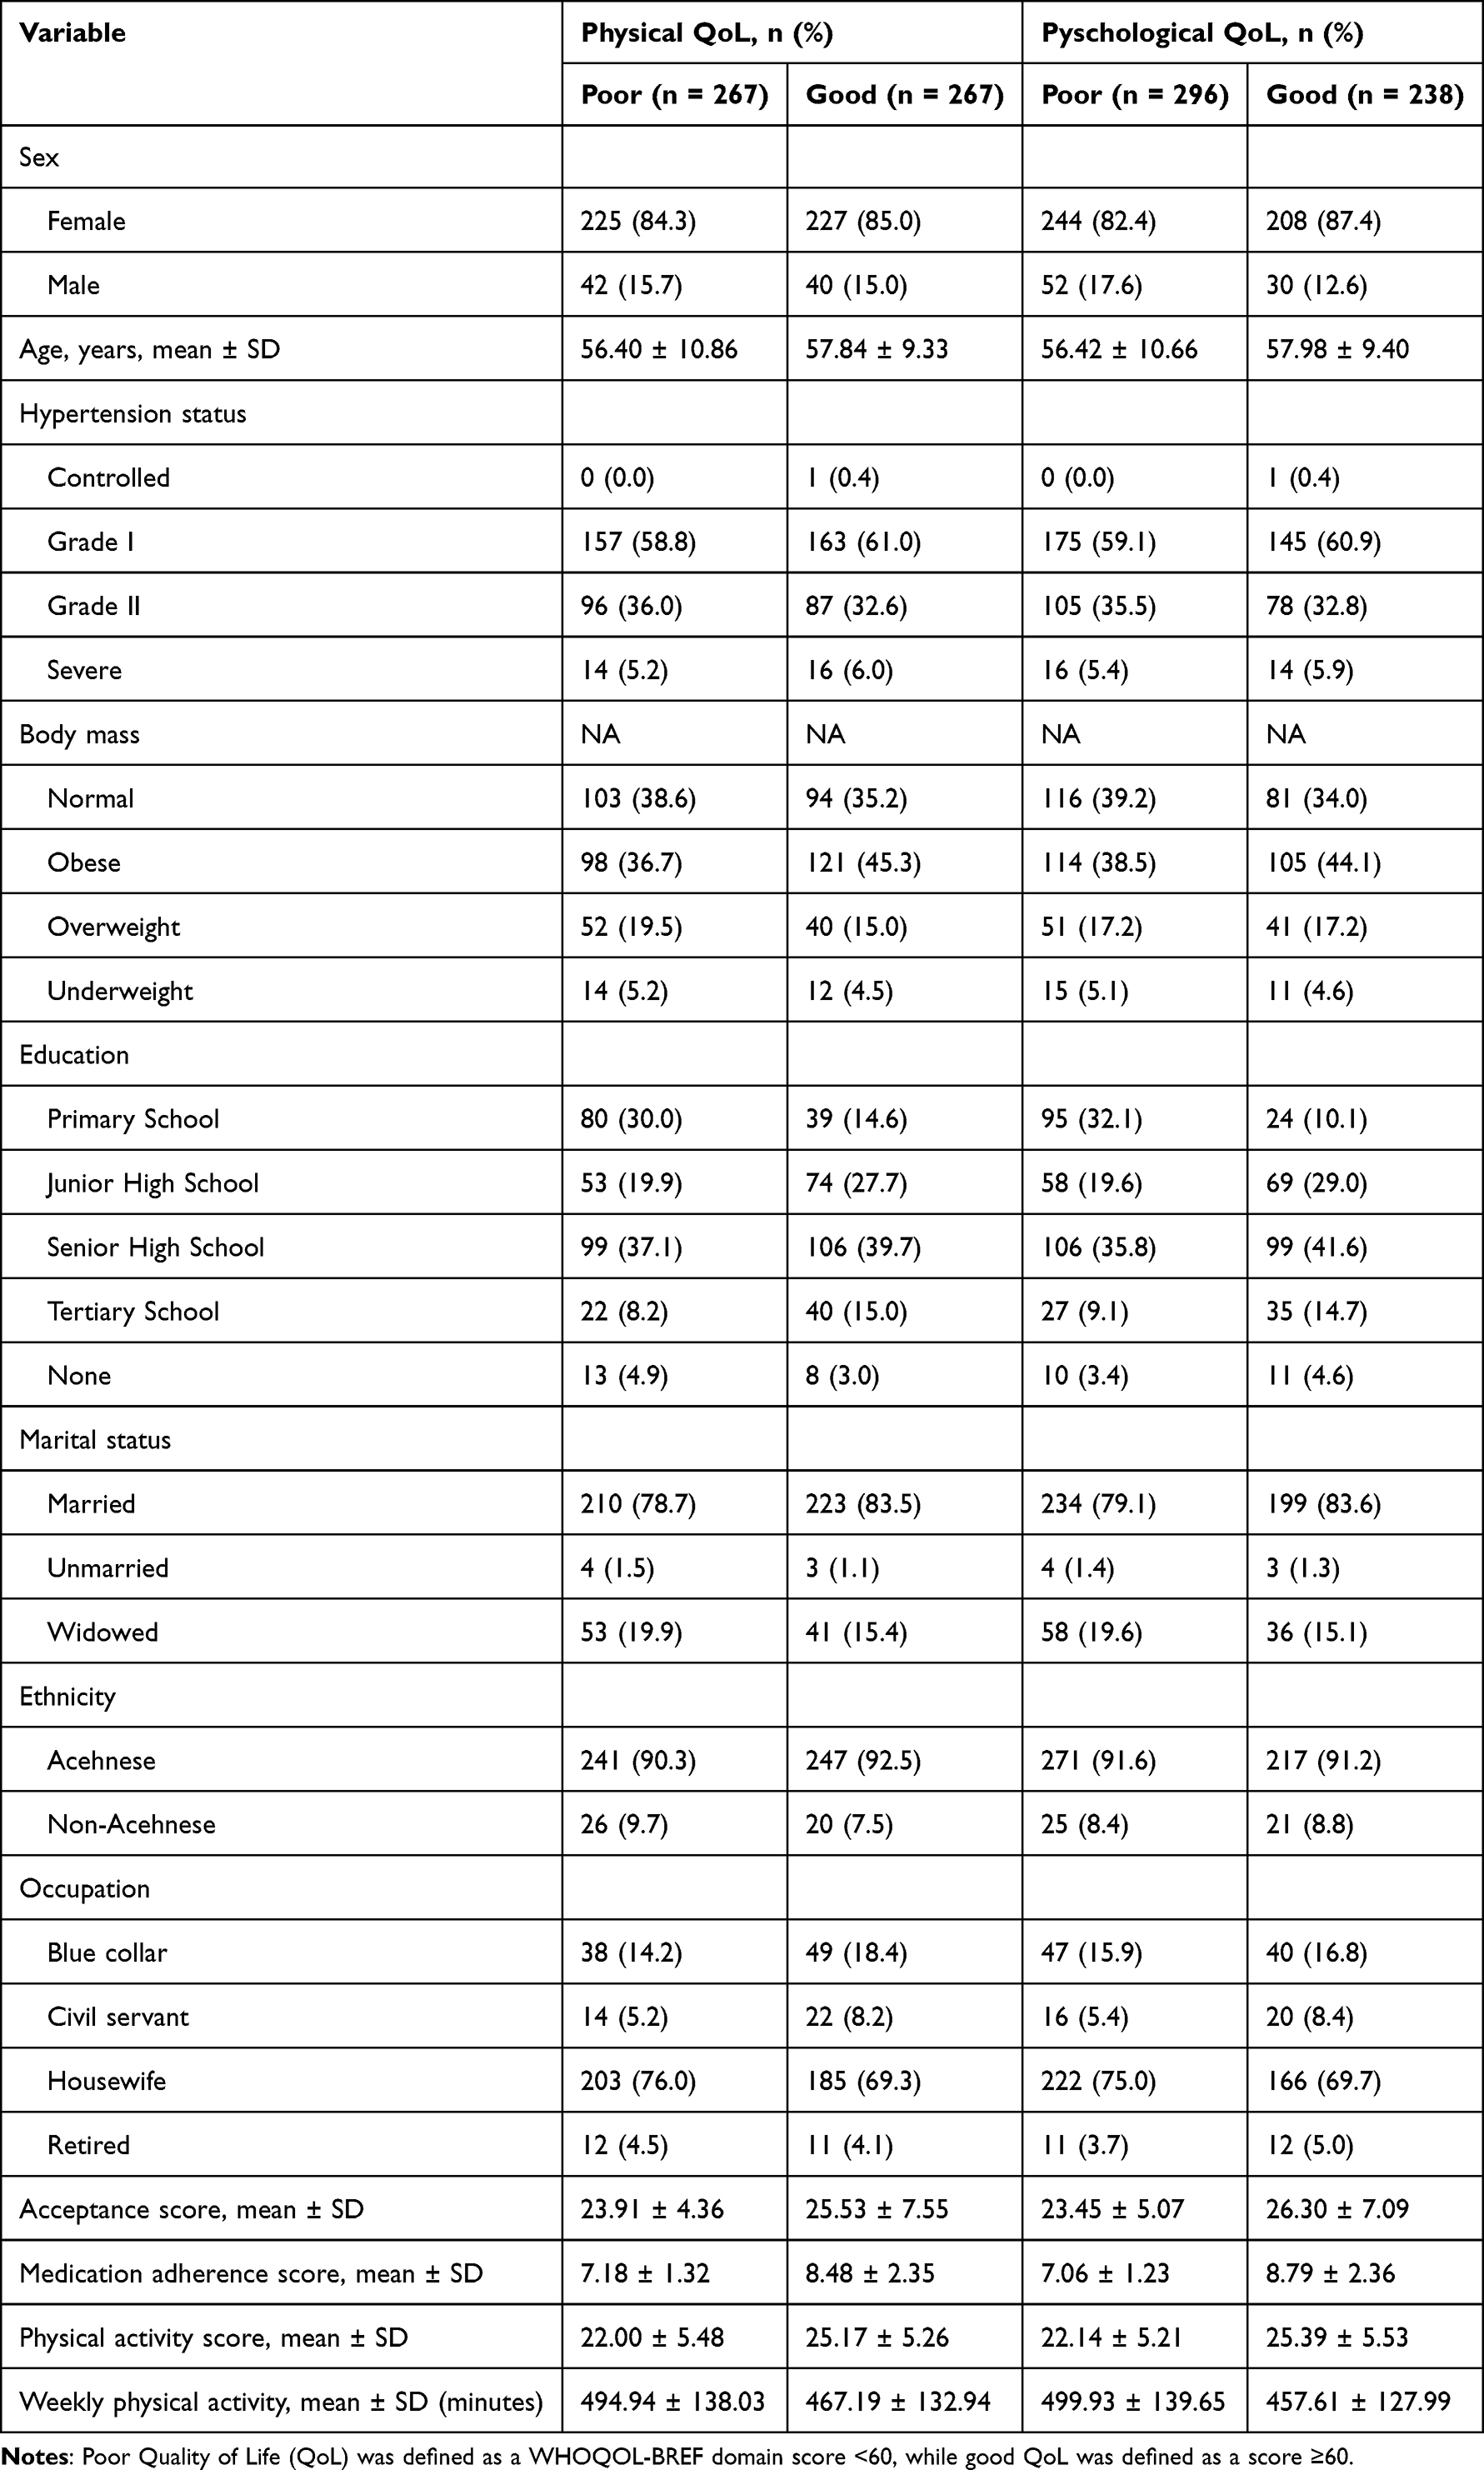 |
Table 1 Characteristics of Participants Included in the Machine Learning Models |
Model Performance
The performance of six machine learning classifiers for stratifying reduced quality of life (QoL) in individuals with hypertension is presented in Table 2. For physical QoL, ensemble tree–based models demonstrated better discrimination compared with single-tree and probabilistic approaches. Random Forest achieved the AUC of 0.850 (95% CI: 0.818–0.882), with balanced sensitivity (0.835) and specificity (0.738). Gradient Boosting and XGBoost showed similar discrimination with AUCs of 0.850 (95% CI: 0.818–0.882) and 0.851 (95% CI: 0.818–0.884), respectively. Meanwhile, AdaBoost demonstrated high sensitivity (0.918) but reduced specificity (0.663), indicating a tendency toward over-identification of reduced QoL. Naïve Bayes showed limited discriminative ability, characterized by AUC of 0.701 (95% CI: 0.655–0.744), with 50.2% sensitivity and 73.8% specificity.
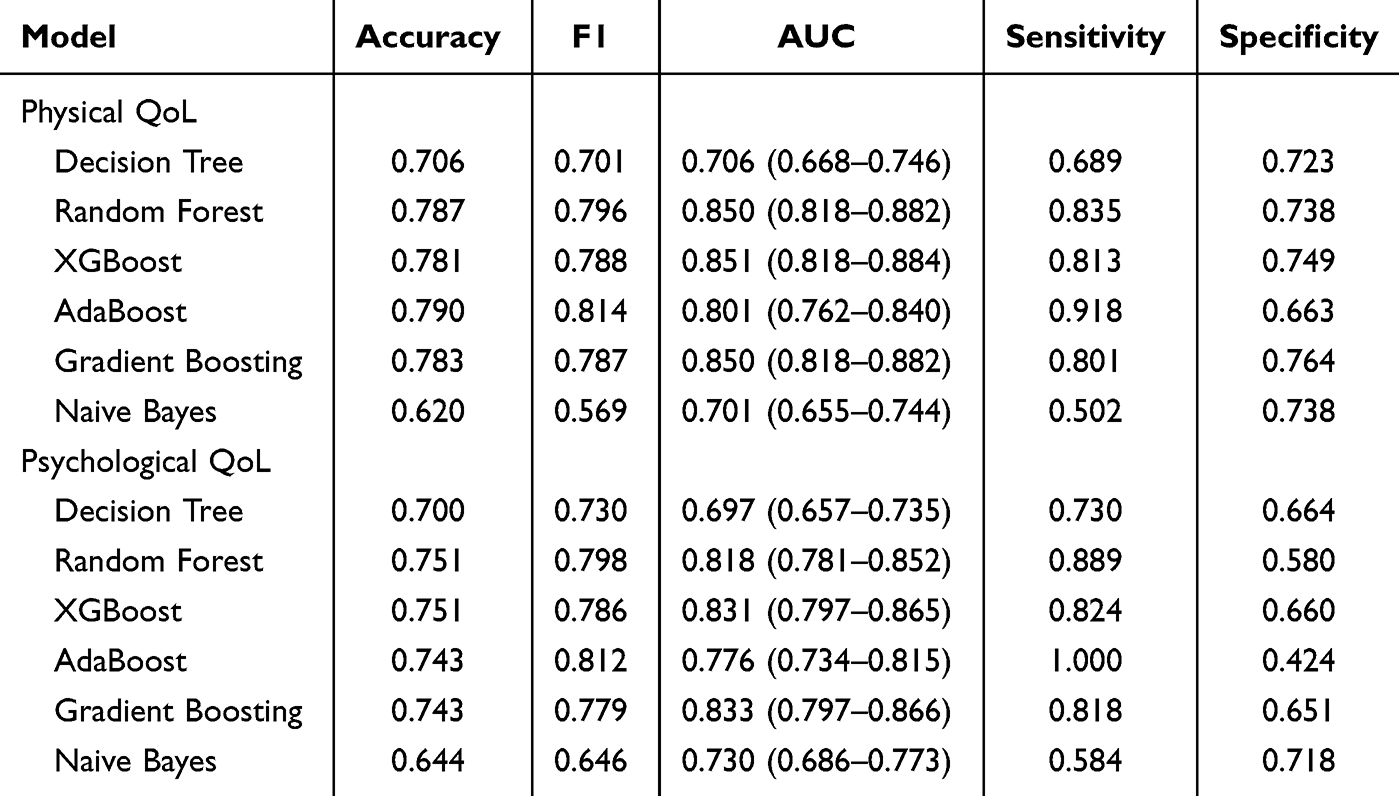 |
Table 2 Performance of Machine Learning Classifiers for Physical and Psychological QoL Risk Stratification Based on 10-Fold Cross-Validation |
For psychological QoL, the overall model performance was slightly lower but followed a similar pattern. Gradient Boosting achieved the highest AUC (0.833 [95% CI: 0.797–0.866]), followed closely by XGBoost (0.831 [95% CI: 0.797–0.865]) and Random Forest (0.818 [95% CI: 0.781–0.852]). These models demonstrated favorable sensitivity, ranging from 81.8% in Gradient Boosting to 88.9% in Random Forest, but their specificities were moderate. Decision Tree showed modest discrimination (AUC of 0.697 [95% CI: 0.657–0.735]), while AdaBoost yielded perfect sensitivity (100.0%) at the expense of low specificity (42.4%). The comparative performance of classifiers across physical and psychological QoL domains, based on the ROC and discriminatory performance parameters, is presented in Figure 1.
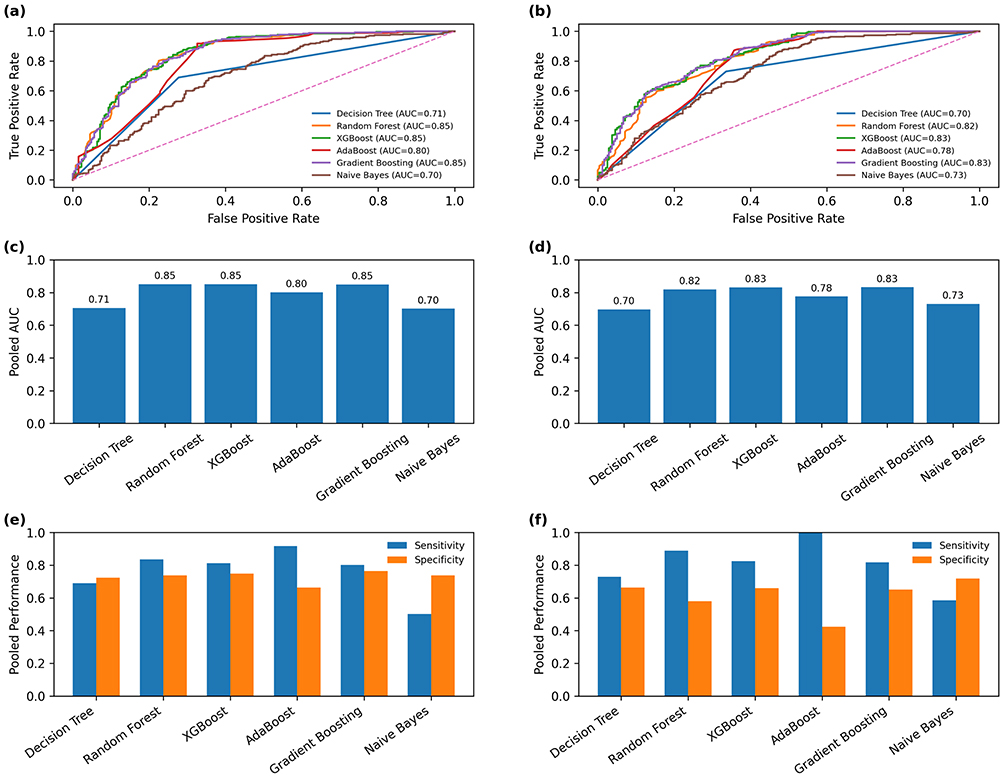 |
Figure 1 Cross-validated performance of machine learning classifiers for physical and psychological QoL classification. ROC curves generated from pooled out-of-fold predicted probabilities during stratified 10-fold cross-validation for physical (a) and psychological QoL (b). AUC values for physical (c) and psychological QoL (d). Display pooled sensitivity and specificity estimates across cross-validation folds for physical (e) and psychological QoL (f). |
Predicted Probability Distributions
The predicted probability distributions for reduced and non-reduced QoL across classifiers for both physical and psychological domains are presented in Figure 2. For Decision Tree models, probability estimates were concentrated near extreme values, resulting in limited separation between outcome classes and reflecting the modest discriminative performance observed in cross-validation metrics. Naïve Bayes exhibited pronounced probability saturation, with predictions clustered near high probabilities for reduced QoL, consistent with its high sensitivity but very low specificity.
 |
Figure 2 Predicted probability distributions for reduced and non-reduced quality of life (QoL) across machine learning classifiers. (a–f) show probability distributions for physical QoL, and (g–l) show distributions for psychological QoL. Blue bars represent non-low QoL, and Orange bars represent low QoL. Greater separation between distributions indicates improved discrimination between outcome classes. |
In contrast, ensemble tree–based models demonstrated clearer separation between low and non-low QoL distributions. Random Forest and XGBoost showed well-distributed probability estimates, with non-low QoL cases concentrated at lower predicted probabilities and low QoL cases shifted toward higher probabilities, indicating improved class discrimination. AdaBoost demonstrated a distinct probability pattern characterized by a strong shift toward high predicted probabilities for reduced QoL, explaining its high sensitivity but reduced specificity. This pattern suggests a tendency to overclassify reduced QoL cases using Adaboost, particularly in the psychological domain. Gradient Boosting exhibited the most consistent and gradual probability separation across both QoL domains, with minimal overlap between distributions.
Model Ranking Stability
The stability of model performance rankings across stratified 10-fold cross-validation for physical and psychological QoL outcomes is illustrated in Figure 3. For physical QoL, Random Forest and Gradient Boosting consistently achieved the lowest mean ranks with relatively small variability across stratified 10-fold cross-validation. Gradient Boosting achieved a mean rank of 2.4 with low variability (SD 0.52), ranking within the top two models in 60% of folds. Random Forest demonstrated comparable and slightly superior stability, achieving a lower mean rank of 2.0 with moderate variability (SD 1.33), and ranked as the top-performing model in 60% of folds and within the top two models in 60% of folds. XGBoost demonstrated comparable ranking but with slightly greater dispersion. Other models had the less stability due to higher mean ranks and/or wider variability.
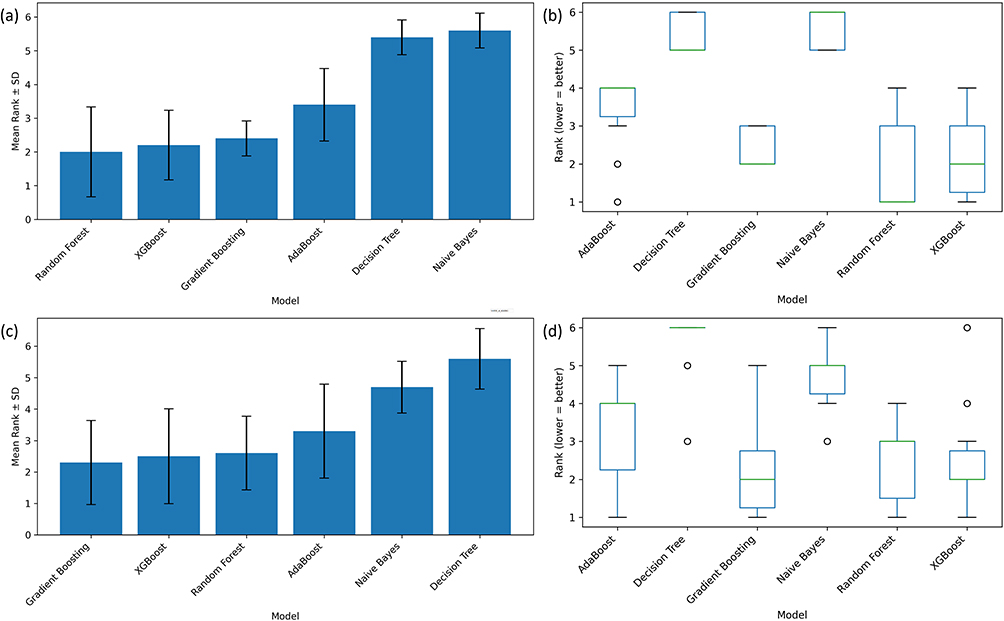 |
Figure 3 Model ranking stability across stratified 10-fold cross-validation for physical and psychological QoL classification. (a and c) show the mean rank and standard deviation of each classifier across the 10 cross-validation folds for physical and psychological QoL, respectively. A lower rank indicates better relative model performance. Smaller standard deviation indicates more stable performance across folds. (b and d) show the distribution of model ranks across folds using boxplots, where narrower boxes indicate more consistent model ranking. |
For psychological QoL, Gradient Boosting emerged as one of the most stable high-performing models, showing a favorable combination of low mean rank and limited variability. The model achieved a mean rank of 2.3, with moderate variability across folds (SD 1.34), and ranked as the top-performing model in 30% of folds and within the top two models in 70% of folds. Random Forest demonstrated comparable performance but with slightly reduced stability, exhibiting a mean rank of 2.6 and greater rank variability (SD 1.17). Although Random Forest ranked as the top-performing model in 30% of folds, it appeared within the top two models in only 30% of folds, indicating less consistent ranking across cross-validation iterations. XGBoost followed with slightly higher mean ranks and moderate variability. AdaBoost again showed wider rank dispersion, while Decision Tree and Naïve Bayes consistently ranked lower and displayed greater instability across folds. Given consistently strong performance of Random Forest and Gradient Boosting models, feature importance and SHAP analysis was carried out based on the two models, respectively.
Random Forest Feature Importance
Random Forest feature importance analysis identified acceptance score and medication adherence score as the most influential predictors of reduced QoL across both physical and psychological domains (Figure 4a and b). For physical QoL, physical activity–related variables, including total physical activity score and weekly physical activity duration, also contributed substantially, alongside age. In contrast, for psychological QoL, acceptance and medication adherence remained dominant, with age and physical activity showing moderate importance. Sociodemographic variables, including education level, marital status, occupation, sex, and ethnicity, demonstrated relatively lower contributions in both domains.
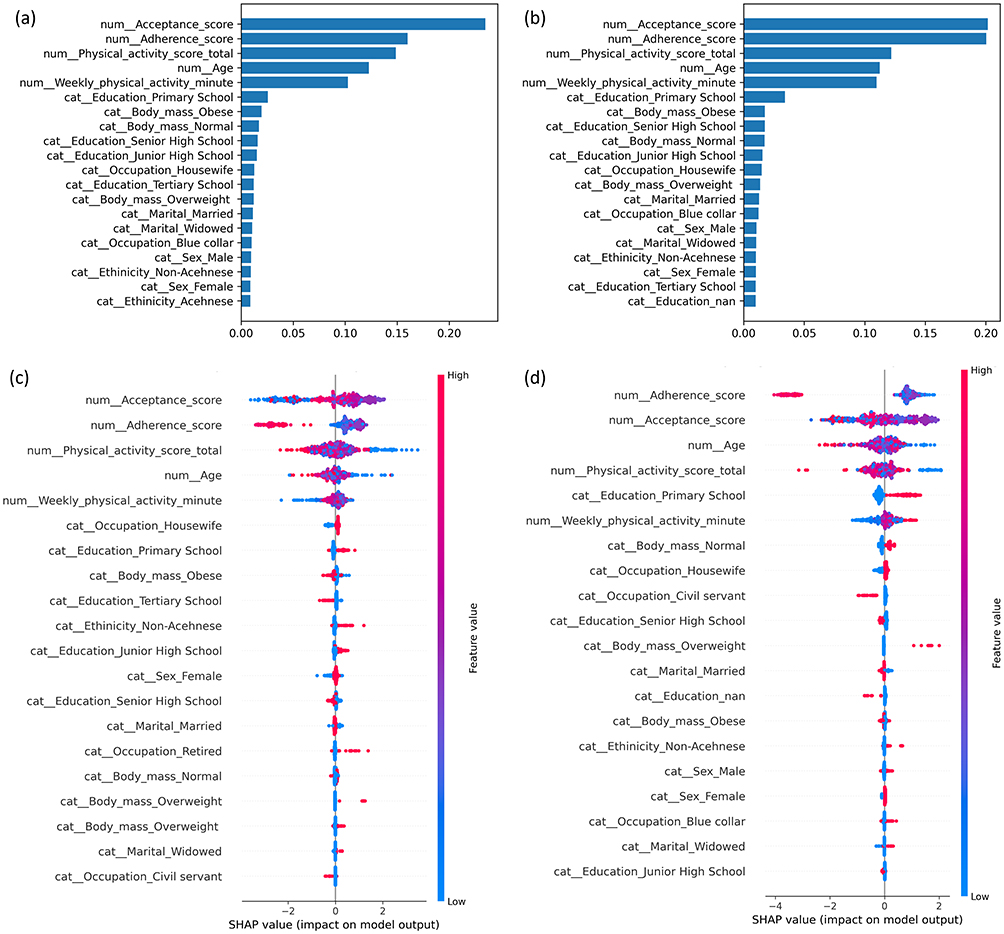 |
Figure 4 Feature importance and SHAP interpretation of predictors of reduced QoL. (a and b) show Random Forest feature importance for reduced physical and psychological QoL, respectively, where higher values indicate greater contribution to model prediction. (c and d) show SHAP summary plots from the Gradient Boosting models for reduced physical and psychological QoL, respectively. In the SHAP plots, each point represents one participant. The horizontal position shows whether a feature increased or decreased the predicted risk of reduced QoL. Positive SHAP values indicate higher predicted risk of reduced QoL, while negative SHAP values indicate lower predicted risk. The color scale represents the feature value, with higher values shown in red and lower values shown in blue. |
SHAP Explainability
SHAP analysis of the Gradient Boosting models provided insight into both the magnitude and direction of predictor effects on reduced QoL risk (Figure 4c and d). Across both physical and psychological QoL domains, acceptance score and medication adherence score emerged as the dominant contributors. Lower acceptance and poorer medication adherence were consistently associated with higher predicted risk of reduced QoL, as reflected by positive SHAP values at lower feature levels.
For physical QoL, physical activity–related variables, including total physical activity score and weekly physical activity duration, showed substantial protective effects, with higher activity levels associated with lower predicted risk. Age also contributed meaningfully, with increasing age generally associated with higher risk of reduced physical QoL. Other sociodemographic and clinical variables demonstrated comparatively small and heterogeneous effects. In psychological QoL-based classification, acceptance and medication adherence again showed the strongest influence, followed by age and physical activity. Lower educational attainment demonstrated additional contributions to increased psychological QoL risk, whereas body mass and other sociodemographic factors exhibited relatively minor effects.
Discussion
The present study employed explainable ML to stratify the risk of reduced QoL among individuals with hypertension. Ensemble tree-based models, particularly Gradient Boosting and Random Forest, demonstrated superior accuracy in distinguishing patients with reduced versus good QoL across physical and psychological domains. Gradient Boosting emerged as the most stable classifier under cross-validation. Using SHAP interpretability, the most influential predictors of low QoL were identified as low disease acceptance and poor medication adherence, which were common to both QoL domains. Furthermore, diminished physical activity contributed to worse physical QoL, whereas older age and lower educational attainment were associated with more reduced psychological QoL outcomes.
Reduced QoL can be operationalised by scoring the WHOQOL BREF items into validated domain level continuous outcomes, after which physical and psychological domain scores can be used as the patient reported outcome targets for subsequent modelling in hypertension cohorts.18 For supervised learning, a reduced QoL label can be constructed by applying a prespecified threshold to domain scores, thereby enabling binary classification of individuals with hypertension into reduced versus preserved QoL strata while preserving interpretability of what constitutes impairment in the underlying instrument.19 Tree based ensemble classifiers can then be trained on multicomponent predictors such as demographic characteristics, health behaviours, and self-management measures to learn nonlinear interactions that influence health utility and QoL in hypertension related populations, with random forest and gradient boosting style models representing common choices in this setting.15 Model generalisation can be estimated through stratified tenfold cross validation with discrimination metrics such as the area under the receiver operating characteristic (ROC) curve, and transparent reporting of the full modelling pipeline is supported by contemporary guidance for prediction models developed using regression or ML methods.14 Explainability can be added by computing SHAP for the fitted ensemble, where each feature is assigned an additive contribution that shifts the prediction for a given individual away from the baseline risk, thereby providing both local explanations for single patients and global rankings of the dominant determinants of reduced QoL.20 When incorporated into a decision support workflow, these explanations can facilitate clinically coherent interpretation and appropriate trust calibration, since explanation design and clarity have been shown to influence clinician trust and the propensity to rely on AI outputs in practice.21
Ensemble learning techniques showed robust performance in this context, aligning with their well-recognized predictive strength in clinical data classification.22 In our analysis, Gradient Boosting achieved high discrimination, comparable to recent ML models predicting HRQoL from multifactorial data (AUC of 0.81 to 0.84).23 These results underscore that advanced tree-based algorithms can effectively capture the complex interactions in patient data, outperforming simpler methods. Importantly, incorporating SHAP for model interpretation enhanced trust and transparency, reflecting the growing use of explainable ML to uncover key health risk factors in complex models.24,25
Based on the SHAP of the present developed models, medication adherence and illness acceptance emerged as dominant modifiable determinants of QoL in hypertensive patients. This finding is consistent with evidence that better adherence to antihypertensive therapy correlates with improved HRQoL.26 Conversely, low adherence has been associated with subsequent declines in patients’ mental well-being over time.27 Likewise, greater acceptance of one’s disease has been linked to higher QoL and better psychological adjustment in chronic hypertension.28 Collectively, these observations emphasize that behavioral and psychosocial factors play an important role in patients’ life quality. In clinical practice, patients with poor adherence or low illness acceptance may benefit from targeted behavioral and educational interventions, including adherence counseling, simplified medication education, motivational support, and structured self-management programs.
The present SHAP analysis also revealed domain-specific drivers of QoL heterogeneity. In the physical health domain, lower levels of physical activity were associated with increased risk of reduced QoL, concordant with clinical evidence that regular exercise improves cardiovascular health and physical HRQoL in hypertension.10 In contrast, the psychological domain was strongly influenced by demographic factors. Advancing age was linked to worse mental QoL,29 whereas higher educational attainment was associated with better psychological well-being.30 These findings align with epidemiological data indicating that older hypertensive individuals often experience lower life quality, while patients with more education tend to report higher QoL, likely due to better disease awareness and self-management.31 Such differences between physical and psychological QoL determinants highlight the importance of tailored strategies addressing both lifestyle and sociodemographic factors in comprehensive hypertension care. It is noteworthy, however, SHAP values should be interpreted as model-based feature contributions rather than evidence of causality. Moreover, given the cross-sectional observational design, the identified features should not be assumed to cause reduced QoL, but rather to help stratify patients according to predicted risk.
For practical implementation, the proposed model should be viewed as a supportive risk-stratification tool. Its potential use may be strongest when applied to already available patient databases, where routinely collected information can be used to identify patients predicted to have reduced QoL at scale. This approach may be relevant in Indonesia, where health services are increasingly moving toward digital data systems and integrated health information platforms.32 In such settings, the model could be embedded within electronic records or registry-based workflows to classify patients into predicted reduced QoL or good QoL categories, accompanied by brief explanations of the main contributing features, such as low disease acceptance, poor medication adherence, or low physical activity. This format may help healthcare providers identify patients predicted to have reduced QoL, particularly those whose prediction is driven by poor adherence, low illness acceptance, or low physical activity, who may require closer monitoring and targeted behavioral or psychosocial support. Before real-world use, external validation, data integration testing, workflow assessment, and evaluation of clinician acceptance are required.
This study has several limitations. First, the cross-sectional design limits the ability to infer causal relationships between the identified factors and QoL outcomes. Second, our sample was drawn from a specific population, which may constrain the generalizability of the findings to other settings or demographics. Third, although stratified 10-fold cross-validation was used to evaluate model performance, the moderate sample size and use of several ensemble-based algorithms may still carry a risk of overfitting. Therefore, the reported performance should be interpreted as internal validation, and external validation in independent datasets is needed before clinical implementation. Fourth, key measures such as QoL, medication adherence, and disease acceptance were based on self-reported questionnaires, introducing the possibility of response bias and measurement error. Finally, unmeasured factors (such as dietary habits or social support) were not included in our models and could also affect QoL in hypertensive patients.
Conclusion
This study showed that ensemble tree-based ML classifiers can identify individuals with reduced QoL among adults with hypertension, with Random Forest and Gradient Boosting demonstrating the most consistent performance across the physical and psychological QoL domains. The predicted probability distributions and model ranking stability further supported the stronger discrimination and more stable performance of these ensemble models compared with simpler classifiers. Feature importance and SHAP analyses consistently identified disease acceptance and medication adherence as the dominant shared contributors driving the models toward reduced QoL classification, while physical activity and age also contributed, particularly for physical QoL. These findings suggest that explainable ML may support clinically interpretable QoL risk stratification using patient-level data that are feasible to collect in hypertension care settings. In addition to identifying patients predicted to have reduced QoL, SHAP-based interpretation may help explain which features drive each prediction, thereby supporting more personalized identification of modifiable targets such as medication adherence, illness acceptance, and physical activity. However, these findings should be interpreted as internally validated, model-based risk stratification results rather than evidence of causal effects or clinical readiness. Future studies should validate these models in external and longitudinal populations, assess their integration into routine clinical or database-based workflows, and examine whether interventions targeting the identified modifiable factors lead to meaningful improvements in QoL.
Data Sharing Statement
The datasets analyzed during the current study are derived from a previously published study and are available from the corresponding author (Muhammad Iqhrammullah) upon reasonable request. The trained machine learning models, preprocessing pipelines, and analysis scripts are publicly available at: https://github.com/iqhr4m/Machine-learning-for-low-QoL-stratification-in-hypertension.
Ethics Approval and Consent to Participate
The primary study from which the data were derived was conducted in accordance with the Declaration of Helsinki and received ethical approval from the Ethics Committee of the Faculty of Nursing, Universitas Syiah Kuala, Banda Aceh, Indonesia [approval number: 11302030122]. Although the first author’s current affiliation is STIKes Muhammadiyah Lhokseumawe, ethical approval was obtained from Universitas Syiah Kuala because the primary study was undertaken while she was attending that institution. Written informed consent was obtained from all participants prior to enrolment. The present study involved secondary analysis of anonymized data and did not require additional ethical approval or participant contact.
Author Contributions
All authors made a significant contribution to the work reported, whether that is in the conception, study design, execution, acquisition of data, analysis and interpretation, or in all these areas; took part in drafting, revising or critically reviewing the article; gave final approval of the version to be published; have agreed on the journal to which the article has been submitted; and agree to be accountable for all aspects of the work.
Funding
This research did not receive external funding.
Disclosure
The authors declare that they have no competing interests in this work.
References
1. Zhou B, Carrillo-Larco RM, Danaei G. et al. Worldwide trends in hypertension prevalence and progress in treatment and control from 1990 to 2019: a pooled analysis of 1201 population-representative studies with 104 million participants. Lancet. 2021;398(10304):957–14. doi:10.1016/S0140-6736(21)01330-1
2. Mills KT, Bundy JD, Kelly TN, et al. Global disparities of hypertension prevalence and control: a systematic analysis of population-based studies from 90 countries. Circulation. 2016;134(6):441–450. doi:10.1161/CIRCULATIONAHA.115.018912
3. Shimbo D, Shah RU, Abdalla M, et al. Transforming hypertension diagnosis and management in the era of artificial intelligence: a 2023 National Heart, Lung, and Blood Institute (NHLBI) Workshop Report. Hypertension. 2025;82(1):36–45. doi:10.1161/HYPERTENSIONAHA.124.22095
4. de Gusmão JL, Mion D, Pierin AMG. Health-related quality of life and blood pressure control in hypertensive patients with and without complications. Clinics. 2009;64(7):619–628. doi:10.1590/S1807-59322009000700003
5. Cai T, Verze P, Bjerklund Johansen TE. The quality of life definition: where are we going? Uro. 2021;1(1):14–22. doi:10.3390/uro1010003
6. World Health Organization. The World Health Organization quality of life assessment (WHOQOL): position paper from the World Health Organization. Soc Sci Med. 1995;41(10):1403–1409. doi:10.1016/0277-9536(95)00112-K
7. Trevisol DJ, Moreira LB, Kerkhoff A, Fuchs SC, Fuchs FD. Health-related quality of life and hypertension: a systematic review and meta-analysis of observational studies. J Hypertens. 2011;29(2):179–188. doi:10.1097/HJH.0b013e328340d76f
8. Burnier M, Egan BM. Adherence in hypertension. Circ Res. 2019;124(7):1124–1140. doi:10.1161/CIRCRESAHA.118.313220
9. Li YT, Wang HHX, Liu KQL, et al. Medication adherence and blood pressure control among hypertensive patients with coexisting long-term conditions in primary care settings: a cross-sectional analysis. Medicine (Baltimore). 2016;95(20):e3572. doi:10.1097/MD.0000000000003572
10. Arija V, Villalobos F, Pedret R, et al. Physical activity, cardiovascular health, quality of life and blood pressure control in hypertensive subjects: randomized clinical trial. Health Qual Life Outcomes. 2018;16(1):184. doi:10.1186/s12955-018-1008-6
11. Andala S, Sofyan H, Hasballah K, Marthoenis. Knowledge and acceptance associated with medication adherence among hypertension individuals in Aceh province, Indonesia. Heliyon. 2024;10(7):e29303. doi:10.1016/j.heliyon.2024.e29303
12. Krittanawong C, Zhang H, Wang Z, Aydar M, Kitai T. Artificial intelligence in precision cardiovascular medicine. J Am Coll Cardiol. 2017;69(21):2657–2664. doi:10.1016/j.jacc.2017.03.571
13. Cho JS, Park JH. Application of artificial intelligence in hypertension. Clin Hypertens. 2024;30(1):11. doi:10.1186/s40885-024-00266-9
14. Collins GS, Moons KGM, Dhiman P, et al. TRIPOD+AI statement: updated guidance for reporting clinical prediction models that use regression or machine learning methods. BMJ. 2024:385. doi:10.1136/bmj-2023-078378
15. Wang S, Shen C, Yang S. Analysis of health-related quality of life in elderly patients with stroke complicated by hypertension in China using the EQ-5D-3L scale. J Multidiscip Healthc. 2024;17:1981–1997. doi:10.2147/JMDH.S459629
16. Fleiss JL, Tytun A, Ury HK. A simple approximation for calculating sample sizes for comparing independent proportions. Biometrics. 1980;36:343–346. doi:10.2307/2529990
17. Purba FD, Hunfeld JAM, Iskandarsyah A, et al. Quality of life of the Indonesian general population: test-retest reliability and population norms of the EQ-5D-5L and WHOQOL-BREF. PLoS One. 2018;13(5):e0197098. doi:10.1371/journal.pone.0197098
18. World Health Organization. Development of the World Health Organization WHOQOL-BREF quality of life assessment. The WHOQOL Group. Psychol Med. 1998;28(3):551–558. doi:10.1017/s0033291798006667
19. Akter N, Zerin FF, Banu B, Kanta FA. Quality of life in hypertensive patients using the WHOQOL-BREF instrument in the post-pandemic Bangladesh: a cross-sectional study. PLoS One. 2026;21(1):e0340897. doi:10.1371/journal.pone.0340897
20. Gan T, Wang S, Mo G, Li S, Lu Y, Li J. Machine learning prediction and SHAP interpretability analysis of heart failure risk in patients with hyperuricemia. Front Cardiovasc Med. 2025;12:1689607. doi:10.3389/fcvm.2025.1689607
21. Rosenbacke R, Melhus Å, McKee M, Stuckler D. How explainable artificial intelligence can increase or decrease clinicians’ trust in AI applications in health care: systematic review. JMIR AI. 2024;3:e53207. doi:10.2196/53207
22. Zheng H, Yu H, Rosenberg MW, et al. Machine learning identification of influencing factors of global Nation-Level hypertension prevalence. BMC Public Health. 2025;25(1):3987. doi:10.1186/s12889-025-25335-y
23. Abegaz TM, Ahmed M, Ali AA, Bhagavathula AS. Predicting health-related quality of life using social determinants of health: a machine learning approach with the all of us cohort. Bioeng. 2025;12(2 166). doi:10.3390/bioengineering12020166
24. Ahmed S, Kaiser MS, Hossain MS, Andersson K. A comparative analysis of LIME and SHAP interpreters with explainable ML-based diabetes predictions. IEEE Access. 2025;13:37370–37388. doi:10.1109/ACCESS.2024.3422319
25. Peng Y, Xu Z, Du S, Hou T, Yan J. SHAP-enhanced machine learning identifies modifiable obesity predictors across adolescent weight groups: a 2021 YRBSS analysis. PLoS One. 2025;20(10):e0334502. doi:10.1371/journal.pone.0334502
26. Rupakheti B, Kc B, Bista D, Kc S, Pandey KR. Treatment adherence and health-related quality of life among patients with hypertension at tertiary healthcare facility in Lalitpur, Nepal: a cross-sectional study. Patient Prefer Adherence. 2024;18:2077–2090. doi:10.2147/PPA.S476104
27. Peacock E, Joyce C, Craig LS, et al. Low medication adherence is associated with decline in health-related quality of life: results of a longitudinal analysis among older women and men with hypertension. J Hypertens. 2021;39(1):153–161. doi:10.1097/HJH.0000000000002590
28. Wahyuni L, Marthoenis M. A cross-sectional study of the impact of knowledge, medication adherence, and illness acceptance on the quality of life in hypertensive patients. Open Public Health J. 2025;18:1–10. doi:10.2174/0118749445383991250411050811
29. Zheng E, Xu J, Xu J, et al. Health-related quality of life and its influencing factors for elderly patients with hypertension: evidence from Heilongjiang Province, China. Front Public Heal. 2021;9:654822. doi:10.3389/fpubh.2021.654822.
30. Youssef RM, Moubarak II, Kamel MI. Factors affecting the quality of life of hypertensive patients. East Mediterr Heal Jt. 2005;11(1–2):109–118.
31. Alsaqabi YS, Rabbani U. Medication adherence and its association with quality of life among hypertensive patients attending Primary Health Care Centers in Saudi Arabia. Cureus. 2020;12(12):e11853. doi:10.7759/cureus.11853
32. Hanifa S, Wicaksono KE. Digital transformation of health services in Indonesia through the utilization of artificial intelligence, big data, and telemedicine: systematic literature review-VOSviewer. In:
 © 2026 The Author(s). This work is published and licensed by Dove Medical Press Limited. The
full terms of this license are available at https://www.dovepress.com/terms
and incorporate the Creative Commons Attribution
- Non Commercial (unported, 4.0) License.
By accessing the work you hereby accept the Terms. Non-commercial uses of the work are permitted
without any further permission from Dove Medical Press Limited, provided the work is properly
attributed. For permission for commercial use of this work, please see paragraphs 4.2 and 5 of our Terms.
© 2026 The Author(s). This work is published and licensed by Dove Medical Press Limited. The
full terms of this license are available at https://www.dovepress.com/terms
and incorporate the Creative Commons Attribution
- Non Commercial (unported, 4.0) License.
By accessing the work you hereby accept the Terms. Non-commercial uses of the work are permitted
without any further permission from Dove Medical Press Limited, provided the work is properly
attributed. For permission for commercial use of this work, please see paragraphs 4.2 and 5 of our Terms.