Back to Journals » Patient Preference and Adherence » Volume 15
Experimental Study on Patient Preferences Regarding the Shape and Size of Medical Tablets and Capsules Using Three-Dimensionally Printed Plastic Model Formulations
Authors Kabeya K, Satoh H ![]() , Hori S, Sawada Y
, Hori S, Sawada Y
Received 13 February 2021
Accepted for publication 30 March 2021
Published 28 April 2021 Volume 2021:15 Pages 863—870
DOI https://doi.org/10.2147/PPA.S306582
Checked for plagiarism Yes
Review by Single anonymous peer review
Peer reviewer comments 3
Editor who approved publication: Dr Johnny Chen
Kenji Kabeya,1 Hiroki Satoh,2,3 Satoko Hori,4 Yasufumi Sawada2
1Faculty of Pharmaceutical Sciences, The University of Tokyo, Tokyo, 113-0033, Japan; 2Laboratory of Drug Lifetime Management, Graduate School of Pharmaceutical Sciences, The University of Tokyo, Tokyo, 113-0033, Japan; 3Interfaculty Initiative in Information Studies, The University of Tokyo, Tokyo, 113-0033, Japan; 4Laboratory of Drug Informatics, Keio University Faculty of Pharmacy, Tokyo, 105-8512, Japan
Correspondence: Yasufumi Sawada Tel +81 3 5841 1096
Fax +81 3 5841 1097
Email [email protected]
Background: Tablets and capsules are the most common dosage forms. However, ease of use and/or swallowing influences patients’ compliance.
Objective: To identify patients’ preferences regarding the three-dimensional size of medical tablets/capsules.
Methods: Eighteen cylindrical-, oblong-, and oval-shaped model formulations having different sizes were prepared by three-dimensional printing using polylactic acid. Participants (40 patients visiting a pharmacy in Japan) evaluated the difficulty of picking up and swallowing these model formulations by touching/observing them, and completed a questionnaire. The visual analogue scale (VAS) was used to evaluate each sample, and the relationship of VAS scores to the major axis, thickness, I2 (the sum of major/minor axes) and I3 (the sum of major/minor axes and thickness) of the model formulations was evaluated by ANOVA followed by Tukey’s test.
Results: Female participants showed lower VAS scores (less difficult) for picking difficulty compared with male participants, and those taking many drugs showed higher VAS scores (more difficult) for swallowing difficulty compared with those taking fewer drugs. Otherwise, age, gender, disease status, number of drugs usually taken, and ingestion problems did not greatly influence the evaluation. Overall, larger model formulations showed less picking difficulty, but greater swallowing difficulty. Model formulations 2 mm thick or less were harder to pick up, whereas those 6 mm thick or more were harder to swallow. I3 values greater than 20– 22 mm were associated with a negative evaluation by participants.
Conclusion: Participants in this study preferred model formulations with an I3 value below 22 mm and a thickness of 2– 6 mm.
Keywords: tablet, capsule, size, shape, patient preference
Introduction
Medical tablets and capsules are the most common dosage forms in Japan because of their convenience. However, large tablets/capsules are more difficult to ingest, and may reduce patients’ compliance.1,2 Therefore, it is important to understand patients’ preferences regarding the size and shape of medical tablets and capsules. Several studies have investigated this issue,3–13 but have had various limitations: (i) most only investigated the diameter of round tablets and did not consider the three-dimensional shape of tablets, and (ii) most only compared patient preferences for different tablet/capsule sizes, and did not focus on the preferred size range or threshold size for acceptability, although this information would be useful for drug formulation design and development. We previously analyzed patients’ preferences regarding the shapes and sizes of medical tablets and capsules using data collected from medical professionals such as doctors and pharmacists by marketing specialists (MSs) of a medical wholesaler. Our results indicated that the parameter “major axis + minor axis + thickness” is effective to evaluate patients’ preference regarding size. In that study, we found that drugs with a major axis + minor axis + thickness of 21 mm or above were considered too large by patients.14 However, that study was a retrospective study of previously collected post-marketing information, and we considered that the results should be validated in a prospective study. For this purpose, we designed a clinical study of patients visiting a pharmacy.
Thus, the aims of this study were (i) to validate our previous findings by experimentally establishing participants’ preferences regarding the three-dimensional size of medical tablets/capsules, and (ii) to prospectively test the hypothesis that there is a threshold value of “major axis + minor axis + thickness” that would be associated with negative evaluation of medical tablets/capsules by participants. For this experimental study, we prepared a series of 18 cylindrical-, oblong-, and oval-shaped polylactic acid model formulations of different sizes by means of three-dimensional printing.
Materials and Methods
Study Outline and Participants
In this study, participants’ evaluations of model formulations of different shapes and sizes were compared by means of a clinical study at Eisei Pharmacy, an insurance-covered pharmacy in Tokyo (Taito-ku, Tokyo). Forty participants who met the following criteria were enrolled: (i) had received medicines at Eisei Pharmacy before, (ii) had a medication history record in Eisei Pharmacy, (iii) were able to read/listen to and understand Japanese, and (iv) had never been diagnosed with dementia. No other criterion was applied.
Experimental Design
Each experiment was conducted for 15–30 minutes for each participant, as follows:
Considered Elements
This study considered the following elements. All the information was obtained through the questionnaire or the medication history record in the pharmacy.
- The participant’s age and gender (Questionnaire).
- Whether the participant encounters difficulty in swallowing in daily life (Questionnaire).
- The participant’s medical history, current medication, and the drugs he/she feels are difficult to swallow (Questionnaire and Medication history).
- Visual analogue scale (VAS) for scoring the picking/swallowing difficulty of each model formulation (Answer sheet, Figure 1).
 |
Figure 1 VAS format in answer sheets. English explanations are shown in addition to the original Japanese format. |
Model Formulations
For the experiment, eighteen types of plastic formulations with different shapes and sizes (Table 1) were prepared by three-dimensional printing as models of real tablets and capsules. The parameter values of each model formulation were set in the following ranges: major axis 6–14 mm, thickness 2–6 mm, I2 (the sum of the major/minor axes) 12, 14, 15, 16, 18, and 20 mm, and I3 (the sum of the two axes and thickness) 16, 18, 20, 22, 24, 26 mm.
 |
Table 1 Sizes of the Model Formulations Used in This Study |
These model formulations were made of polylactic acid (PLA) and had a size error of less than 0.3 mm from the design measurement (Figure 2). They were designed with specialized software (FlashPrint: Flashforge Japan, Osaka, Japan, and Happy3D: P2G Capital Ltd., Nice, France), molded with a 3D printer (Finder: Flashforge Japan, Osaka, Japan), and polished with an electronic sander (Earth man BSD-110: Takagi, Niigata, Japan) and #180 sand paper.
 |
Figure 2 Model formulations used in this study. |
Analysis
VAS scores were measured with a stainless-steel ruler (GS15: Yamayo Measuring Tools Co. Ltd., Tokyo, Japan) using 0.1-mm increments. The distance from the left side end was measured; thus, a smaller value means a sample is easier to pick up or swallow.
The model formulations were categorized based on their values of major axis, I2, I3, or thickness. Inner-group and cross-group comparisons were conducted by ANOVA followed by Tukey’s test. In addition, participants were grouped according to age, gender, number of drugs they took, swallowing difficulty, etc., and the VAS scores were compared between groups by ANOVA followed by Tukey’s test. In this study, “cross-group comparison” means comparison between the established groups (such as Group 1 <sample no. 1, 2, 3> versus Group 2 <sample no. 4, 5, 6>) while “inner-group comparison” means a comparison between the samples of a single group (such as sample no. 1 versus no. 2 versus no. 3).
For the analyses, Microsoft Excel 2016 ver.1803 (Microsoft Corporation, Washington, USA) and SPSS Statistics 21 (IBM Japan, Tokyo, Japan) were used.
Ethical Concerns
This study was conducted with the approval (Approval number: 30–3) of the Research Ethics Committee for Human Studies of the Faculty of Pharmaceutical Sciences, Graduate School of Pharmaceutical Sciences at the University of Tokyo. Also, this study was conducted in accordance with the Declaration of Helsinki.
Written informed consent was obtained from participants prior to conducting the experiments, after an explanation of the purpose and methodology of the study. We advised participants that their personal information would be protected, that they could quit the study at any time, and that no information that could identify individuals would be published.
Results
Participants
Forty persons who visited the pharmacy during 6 days in September 2018 participated: 17 men and 23 women, aged in the 20’s to 90’s (Table 2). Six participants had difficulty with ingestion in daily life. Participants took 0–14 medications per day (mean: 4.7, median: 4). Frequently observed diseases were hypertension and diabetes, and only 3 cases had diseases that might influence their VAS score (Parkinson’s disease: 1 case, rheumatoid arthritis: 2 cases; Table 3).
 |
Table 2 Gender and Age Range of Participants |
 |
Table 3 Participants’ Diseases |
Influence of Background Factors
Participants in their 70’s showed a significantly lower VAS score for picking difficulty (24.2 ± 27.6 mm) than those in their 60’s (35.3 ± 25.0 mm) or those over 80 (34.8 ± 26.7 mm) (p<0.001). Regarding swallowing difficulty, the differences were not significant (p=0.232).
Female participants reported significantly less picking difficulty (p<0.001, Figure 3), but there was no difference in swallowing difficulty (p=0.743).
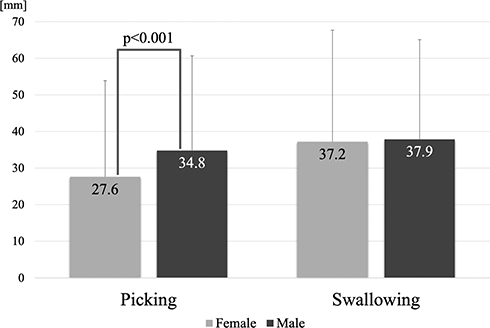 |
Figure 3 Effect of participants’ gender on VAS score. Mean + SD, 23 females and 17 males. Student’s t-test. |
The presence of ingestion difficulty had no significant influence on either picking or swallowing difficulty (picking: p=0.222, swallowing: 0=0.079), although participants with ingestion difficulty tended to show a lower VAS score (33.0 ± 27.0 mm) than the others (38.3 ± 29.4 mm).
The number of drugs that participants took significantly influenced the VAS scores. For picking difficulty, a significant difference was observed between the 3–4 drugs group and the 7 drugs or above group (34.6 versus 25.3, p<0.05). As for swallowing difficulty, the 7 drugs or above group showed a significantly higher score than the other groups (Figure 4).
 |
Figure 4 Effect of the Number of Drugs that Participants Usually Take on VAS Score. Mean + SD, *Significantly different from the others. 0–2 Drugs: n=10. 3–4 and 5–6 Drugs: n=11 each. 7 Drugs or above: n=8. |
Picking Difficulty
Overall, smaller samples showed a higher VAS score (worse evaluation of picking difficulty) than larger samples (Table 4). The major axis was not clearly related to picking difficulty (for example, some smaller samples got better evaluations than larger samples). As for thickness, there was a significant difference between 2 and 4 mm (p<0.05), and between 2 and 6 mm (p<0.1, Figure 5). No significant inner-group difference was observed. Either I2 or I3 classified the model formulations into 6 groups, but many inner-group significant differences were observed and there was no clear cross-group significance.
 |
Table 4 VAS Score of Each Sample |
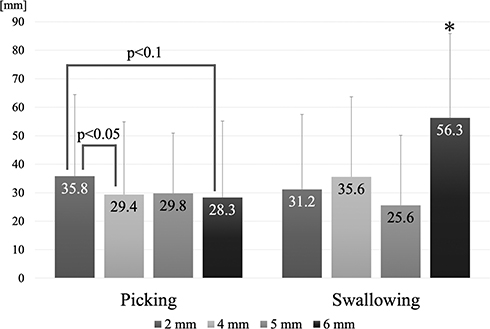 |
Figure 5 Effect of thickness on VAS score. Mean + SD, *Significantly different from the other groups. |
Regarding the shape, the capsule model formulations got worse evaluations, but significant inner-group differences were observed. Moreover, a significant difference was found only between Sample No.1 and No.3, when capsule model formulations and the other model formulations of about the same size were compared.
Swallowing Difficulty
Overall, larger model formulations showed a higher VAS score (worse evaluation of swallowing difficulty) than smaller ones (Table 4). The major axis was not clearly related to swallowing difficulty (for example, some larger model formulations got better evaluations than smaller ones). As for thickness, although significant inner-group differences were observed, the 6 mm group showed a significantly worse score than the other groups (Figure 5).
Based on I2 and the VAS score, the 6 groups could be classified into 3 subgroups with I2 = 12–16 mm, 18 mm, and 20 mm (Figure 6). However, inner-subgroup significances were also observed.
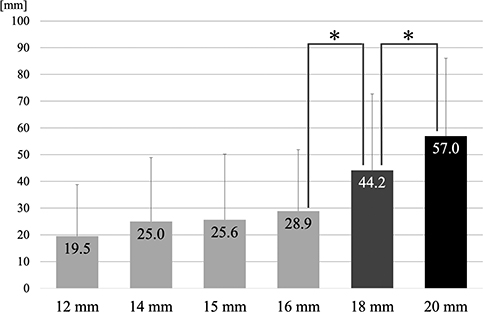 |
Figure 6 Relationship of I2 score to swallowing score. Mean + SD, *p<0.05, I2: the sum of major axis and minor axis. |
As for I3, the sum of the two axes and thickness, only Sample No.16 showed a significant inner-subgroup difference, while significant cross-group differences were observed between the 20 mm group and 22 mm and larger groups. The 6 groups could be classified into 4 subgroups: I3 = 16–20 mm, 22 mm, 24 mm, and 26 mm (Figure 7).
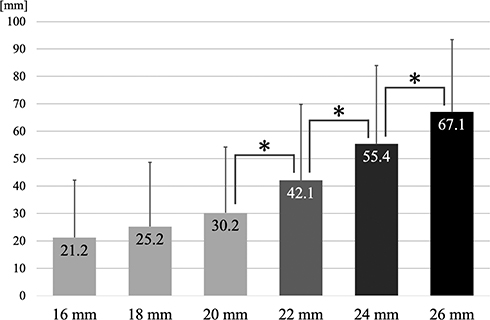 |
Figure 7 Relationship of I3 score to swallowing score. Mean + SD, *p<0.01, I3: the sum of major axis, minor axis and thickness. |
Capsule model formulations had the best evaluation for swallowing difficulty. However, inner-group significances were observed in each group. Moreover, further investigation revealed that Sample No.16 accounted for the significance of the capsule model formulations; the other capsule model formulations showed little difference.
Discussion
This study randomly recruited visitors to a pharmacy, and unsurprisingly, there were fewer young participants than elderly participants; this distribution corresponds to the distribution of outpatients who visit hospitals in Japan.15 Therefore, the participants in this study may reflect the actual population of outpatients in pharmacies. Overall, background factors such as age, gender, disease status, number of drugs usually taken, and ingestion problems did not greatly influence the evaluation of picking and swallowing difficulty, though some significant differences were observed. For example, women gave a significantly better evaluation in picking difficulty than men did (Figure 3), possibly because women’s hands are smaller than men’s.16
Consideration of Picking Difficulty
The findings on picking difficulty do not permit any clear conclusions. However, as regards thickness, the 2 mm group tended to get a higher VAS score than the other groups (Figure 5), which may imply that the model formulations with a thickness of 2 mm or below are more difficult to pick up. This is consistent with a previous study reporting that greater thickness leads to less picking difficulty.5
Regarding the difference between tablets and capsules, one might expect intuitively that capsules would be more difficult to pick up, as they might tend to roll easily. Indeed, our results with the model formulations are consistent with this idea. However, a capsule shape was more common in our smaller model formulations, while an oval tablet shape was common in the larger model formulations. Thus, the results do not necessarily support the idea that the capsule shape is inappropriate in terms of picking difficulty. Further investigation will be needed to resolve this question.
Consideration of Swallowing Difficulty
Overall, the tendency that larger model formulations are more difficult to swallow is consistent with previous studies.3–13 On the other hand, most of the previous studies considered only the major axis of the formulations, and in our case, the major axis alone did not show a clear relationship with swallowing difficulty. The reason for the apparent discrepancy may be that we used a variety of formulation shapes, which would be closer to the situation to the real world.
The thickness of medical tablets and capsules may be important, as the 6 mm group showed a significantly higher VAS score than the other groups (Figure 5). This suggests that medical tablets and capsules with thickness of 6 mm or more might be more difficult to swallow. This tendency is consistent with a previous study, which found that thicker formulations are difficult to swallow, although the possible existence of a threshold of thickness was not examined in that work.5
Notably, we found that I3, the sum of the major/minor axes and thickness, could classify the samples into six groups with no inner-group significant differences, except for sample No.16. Taking account of the VAS scores afforded four significant subgroups (I3 16–20 mm, 22 mm, 24 mm and 26 mm, Figure 7). These results suggest that that I3 is an appropriate index for evaluation of swallowing difficulty, and there appears to be a threshold value between 20 and 22 mm. This result is consistent with the conclusion of our previous study.14
Regarding the difference between tablet and capsule model formulations, only sample No.16 showed significant superiority to the other samples with similar size (the same level of I3). This may indicate that a capsule-like shape might be more effective, at least for larger drugs. However, patients generally do not prefer capsules compared with tablets in terms of ingestion.17 Our results may imply that some characteristic of capsules other than the shape, such as a stickier surface material, may be important.
This study has several limitations. First, as regards background factors, many of the participants had hypertension or diabetes, which are common lifestyle diseases, but we could not analyze the influence of disease status, because very few participants reported diseases that might influence picking or swallowing ability, such as Parkinson’s disease. Second, we used only eighteen types of model formulations, because the experiments were conducted in a pharmacy and participants could not be asked to spend a long time there. Further experiments with a greater variety of model formulations would be desirable. Third, the experiments were conducted in a single pharmacy in Tokyo. A larger, more diverse population of participants would be preferable. Finally, the model formulations may not accurately represent actual tablets, which generally have variously curved edges and are far from cylindrical, and this might have influenced the results.
Conclusions
The results of this experimental study using three-dimensionally printed plastic model formulations suggest that the parameter I3, the sum of the major/minor axes and thickness of the dosage form, is a key determinant of swallowing difficulty, and that a threshold value of I3 exists between 20–22 mm. Furthermore, our results suggest that tablets and capsules with thickness of 6 mm or above are more difficult to swallow, while those with thickness of 2 mm or below may be more difficult to pick up. Thus, our results suggest that in tablet/capsule design, the value of I3 should be less than 20–22 mm, and the thickness should be between 2–6 mm. These findings are consistent with the conclusion of our previous retrospective study, which considered patients’ preference for drug shape/size using data collected by staff of medical wholesalers.14
Ethics Approval
This study was conducted with the approval (Approval number: 30-3) of the Research Ethics Committee for Human Studies of the Faculty of Pharmaceutical Sciences, Graduate School of Pharmaceutical Sciences at the University of Tokyo. Also, this study was conducted in accordance with the Declaration of Helsinki.
Consent to Participate
Written informed consent was obtained prior to conducting the experiments. The participants were briefed regarding the purpose of this study and agreed to its purpose and methodology. In addition, we explained that their personal information would be protected, that they could quit the study at any time, and that any information that might identify individuals would not be published.
Acknowledgments
The authors thank the staff of Eisei Pharmacy (Taito-ku, Tokyo) for their great contribution in providing facilities and patient information, Mr. Keishiro Kuma and Mr. Hiroki Nakagawa in The Graduate School of Agricultural and Life Science, The University of Tokyo, for advice on building model formulations with a 3D printer, and all the participants in this study and their families.
Funding
This research did not receive any specific grant from funding agencies in the public, commercial, or not-for-profit sectors.
Disclosure
Hiroki Satoh, Satoko Hori (until March 2018), and Yasufumi Sawada are members of a laboratory funded by 11 companies including Toho Pharmaceutical Co. Ltd. Hiroki Satoh reports personal fees from Torii Pharmaceutical Co., Ltd., Neopharma Japan Co., Ltd., Yoshida Pharmaceutical Company Limited, outside the submitted work. The authors report no other conflicts of interest in this work.
References
1. Tsushima Y. Tablets easily to be taken-dosage form developed for the elderly patients. Farumashia. 1997;33:1119–1123.
2. Imai Y. Relationship between medication management at home and burden of care for the elderly with dementia. J Ther. 2005;87:433–442.
3. Kurata N, Enomoto A, Kato H, Kataoka S. Medicines that are appropriate for elderly persons-evaluation of the size of oral disintegrating tablets that can be ingested. Jpn J Pharm Health Care Sci. 2010;36(6):397–405. doi:10.5649/jjphcs.36.397
4. Sato H, Saito S, Hayashi T. Research on tablet shapes with excellent swallowability. Int J Affect Eng. 2010;9:137–143.
5. Sato H, Saito S, Ikeda M. Research on tablet shapes that are easier for seniors to take. Int J Affect Eng. 2011;10:417–423.
6. Miura H, Kariyasu M. The Effect of Tablet Size on Medication Administration in the Frail Elderly: A Medication Simulation Study. Geriatr Gerontol Int. 2007;44:627–633.
7. Oshima T, Hori S, Maida C, Miyamoto E. Effect of size and shape of tablets and capsules on ease of grasping and swallowing (1): comparison between elderly and students. Jpn J Pharm Health Care Sci. 2006;32(8):842–848. doi:10.5649/jjphcs.32.842
8. Goto H, Ogata H. About the size of the formulation and ease of administration. Yakuzaigaku. 1990;50:230–238.
9. Miura H, Kariyasu M. Relationship between the size of tablets and subjective evaluation on easiness of taking medicine. Jpn J Med Pharm Sci. 2007;57:829–834.
10. Hashimoto T. Survey on the actual conditions of medication use and attitudes toward dosage forms among the elderly.Ther Res. 2006;27:1219–1225.
11. Ranmal SR, Cram A, Tuleu C. Age-appropriate and acceptable paediatric dosage forms: insights into end-user perceptions, preferences and practices from the Children’s Acceptability of Oral Formulations (CALF) Study. Int J Pharm. 2016;514(1):296–307. doi:10.1016/j.ijpharm.2016.07.054
12. Sugihara M, Hidaka M, Saito A. Investigation of identifiability in dosage form and packaging. J Nippon Hosp Pharm Assoc. 1986;12:322–328.
13. Sugihara M, Awazu S, Ueda K, Takeda Y, Fukumuro K. Silver Science Study, Showa 62th Study Report. Ministry of Health and Welfare; 1988.
14. Kabeya K, Sato H, Hori S, Miura Y, Sawada Y. Threshold size of medical tablets and capsules: based on information collected by Japanese medical wholesaler. Patient Prefer Adherence. 2020;14:1251–1258. doi:10.2147/PPA.S253663
15. Ministry of Health, Labour and Welfare. Kanja Chosa no Gaiyo. Available from: https://www.mhlw.go.jp/toukei/saikin/hw/kanja/14/dl/kanja.pdf.
16. Digital Human Research Group, The National Institute of Advanced Industrial Science and Technology (AIST). Available from: https://unit.aist.go.jp/hiri/dhrg/ja/dhdb/hand/data/statistics.html.
17. Abe H, Soma W, Arita K, Arita T. Jpn J Med Pharm Sci. 2013;69(4):633–635.
 © 2021 The Author(s). This work is published and licensed by Dove Medical Press Limited. The
full terms of this license are available at https://www.dovepress.com/terms
and incorporate the Creative Commons Attribution
- Non Commercial (unported, 3.0) License.
By accessing the work you hereby accept the Terms. Non-commercial uses of the work are permitted
without any further permission from Dove Medical Press Limited, provided the work is properly
attributed. For permission for commercial use of this work, please see paragraphs 4.2 and 5 of our Terms.
© 2021 The Author(s). This work is published and licensed by Dove Medical Press Limited. The
full terms of this license are available at https://www.dovepress.com/terms
and incorporate the Creative Commons Attribution
- Non Commercial (unported, 3.0) License.
By accessing the work you hereby accept the Terms. Non-commercial uses of the work are permitted
without any further permission from Dove Medical Press Limited, provided the work is properly
attributed. For permission for commercial use of this work, please see paragraphs 4.2 and 5 of our Terms.