Back to Journals » Clinical Ophthalmology » Volume 15
Examination of Age-Related Retinal Vascular Changes in the Macula Using Optical Coherence Tomography Angiography of the Eyes After Cataract Surgery
Authors Yoshikawa Y, Shoji T ![]() , Kanno J, Ibuki H, Ozaki K, Ishii H, Inami H, Shinoda K
, Kanno J, Ibuki H, Ozaki K, Ishii H, Inami H, Shinoda K ![]()
Received 11 June 2021
Accepted for publication 19 August 2021
Published 1 September 2021 Volume 2021:15 Pages 3687—3695
DOI https://doi.org/10.2147/OPTH.S323882
Checked for plagiarism Yes
Review by Single anonymous peer review
Peer reviewer comments 3
Editor who approved publication: Dr Scott Fraser
Yuji Yoshikawa, Takuhei Shoji, Junji Kanno, Hisashi Ibuki, Kimitake Ozaki, Hirokazu Ishii, Hiromi Inami, Kei Shinoda
Department of Ophthalmology, Saitama Medical University, Iruma, Saitama, Japan
Correspondence: Kei Shinoda
Department of Ophthalmology, Saitama Medical University, 350-0495 Morohogo 38, Iruma, Saitama, Japan
Tel +81 49-276-1250
Fax +81 49-295-8002
Email [email protected]
Purpose: Optical coherence tomography angiography (OCTA) allows noninvasive observation of the retinal vasculature, and image analysis can be used to calculate the retinal vessel density and foveal avascular zone (FAZ) area. A previous study showed that macular vessel density and the signal strength index (SSI) of OCTA images increased significantly after cataract surgery. However, the effect of aging on OCTA analysis remains unclear. This study aimed to investigate age-related changes in macular vascularization while excluding the effects of cataracts.
Patients and Methods: OCTA imaging of the macula was performed in adult patients who had undergone cataract surgery between February 2018 and May 2019 and in young healthy participants between April 2017 and April 2018.
Results: The median (quartiles) age of the overall study population was 59.0 (27.0, 69.0) years, and no severe refractive error was observed (axial length: 24.2 ± 1.3 [mean ± SD] mm; spherical equivalent: 0.75 [− 2.25, 0.00] diopter). When we investigated the relationship between macular vessel density and age after excluding the effects of cataracts, we found that the macular vessel density showed age-related changes even in the absence of the effects of the SSI. However, the FAZ area was not affected by age.
Conclusion: Macular vessel density decreased with age, even when the effects of cataracts were excluded. The effects of age and cataracts should be considered when designing studies and interpreting OCTA findings of the retinal vasculature.
Keywords: optical coherence tomography angiography, macular vessel density, foveal avascular zone, aging, cataract surgery
Introduction
Compared to fluorescein fundus angiography, optical coherence tomography angiography (OCTA) allows noninvasive observation of the retinal microvasculature and visualization of the retinal capillary network in layers.1 The en face image obtained by many OCTA devices can be divided into two layers, a superficial capillary plexus and a deep capillary plexus, using segmentation software built into the devices for image analysis. Removal of the projection artifact of superficial large retinal vessels in deep en face images has become possible in recent years. This approach allows accurate evaluation of the superficial and deep retinal microvasculatures.2,3 In this regard, studies have been conducted in not only macular diseases4 but also a wide range of conditions, such as retinochoroidal diseases,5 glaucomas,6 and optic nerve diseases.7 However, OCTA images are known to have noise and artifacts2 owing to poor fixation and opacity of the intermediate optic media; these factors adversely affect the accuracy of image analysis. Moreover, different parameters, such as age, sex, hypertension, diabetes, smoking status, and medication, have been shown to have significant impacts on quantitative OCTA metrics.8 In addition, macular vessel density and the signal strength index (SSI) of OCTA images increase significantly after cataract surgery, and the lens opacity significantly influences retinal blood flow measurements.9
Although recent evidence indicates that vessel density in the macula region decreases with age and SSI, it is unclear whether this deterioration is due to a true decrease in retinal microvascular density or attenuation of the OCTA signal due to cataract progression. Because OCTA has rapidly become a popular technology, how retinal microvascularity changes with age is a very important clinical issue. Therefore, in the present study, we examined the relationship between vessel density and age in eyes that had undergone cataract surgery by removing the effect of lens opacity. We performed OCTA examination of the macular area in patients who had undergone cataract surgery with intraocular lens implantation and in young healthy participants. Using this approach, we investigated age-related changes in macular vascularization while excluding the effects of cataracts.
Materials and Methods
Participants
This study was conducted in accordance with the Declaration of Helsinki and was approved by the Saitama Medical University Hospital Ethics Committee. (No;19028.01).
We prospectively recruited and collected data from 44 eyes of 22 young healthy volunteers between April 2017 and April 2018. For the post-cataract surgery group, we retrospectively collected the data of 28 eyes that had no ocular diseases other than cataracts and underwent successful cataract surgery between February 2018 and May 2019. When OCTA examination was performed on both eyes, the right eye was analyzed (Figure 1). Written informed consent was obtained from all participants. Ophthalmological examinations were performed at the Department of Ophthalmology at Saitama Medical University Hospital and included visual acuity examination, slit-lamp examination, non-contact intraocular pressure (IOP) examination (Tonoref II, Nidek Co., Ltd., Aichi, Japan), axial length (AL) examination, corneal thickness test (Optical Biometer OA-2000, Tomey Corp., Nagoya, Japan), OCT (Spectralis HRA 2, Heidelberg Engineering, Heidelberg, Germany), and OCTA (PLEX® Elite 9000, Carl Zeiss Meditec, Jena, Germany). Slit-lamp examination confirmed the absence of inflammation in the anterior chamber or vitreous and absence of posterior capsular opacification.
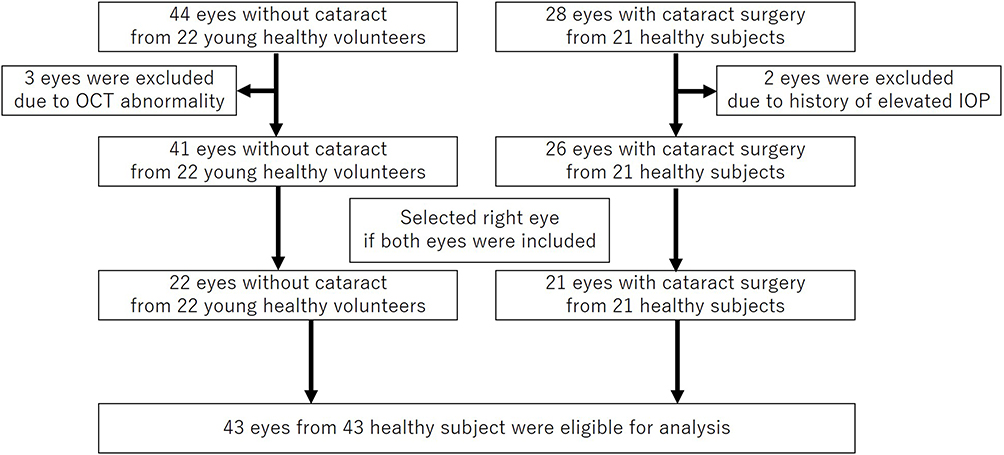 |
Figure 1 We prospectively recruited and collected data from 44 eyes of 22 young healthy volunteers between April 2017 and April 2018. Three of these eyes showed abnormalities in the circumpapillary retinal nerve fiber layer thickness and were excluded. As a result, 41 eyes from 22 participants were included. For the post-cataract surgery group, we retrospectively collected the data of 28 eyes that had no ocular diseases other than cataracts and underwent successful cataract surgery between February 2018 and May 2019. The optical coherence tomography angiography examination was performed on 28 eyes of 21 patients, and two eyes with a history of postoperative ocular hypertension were excluded. No eyes had postoperative optical coherence tomography abnormalities, such as macular edema. As a result, 26 eyes from 21 patients were included. When OCTA examination was performed on both eyes, the right eye was analyzed; therefore, 43 eyes in 43 participants were analyzed. |
On the day of the OCTA examination, OCT examination was also performed, and the following measurements were recorded: circumpapillary retinal nerve fiber layer (cpRNFL) thickness, macular ganglion cell layer–inner plexiform layer (mGCL-IPL) thickness, macular inner plexiform layer–outer plexiform layer (mIPL-OPL) thickness, and whole retinal thickness. We excluded patients who were suspected of having glaucomatous changes or optic nerve damage following OCT examination and those with eye diseases, such as macular edema, diabetic retinopathy, other macular diseases, and pseudoexfoliation syndrome.
OCTA
In this study, swept-source (SS) OCTA was performed on a 3×3 mm macular area centered on the fovea. The OMAG method, which measures changes in both the phase and amplitude, was used as the algorithm for creating vascular signals.10 Additionally, OCTA en face image stratification was performed using segmentation software built into the device. The slab between the internal limiting membrane and the IPL was defined as the superficial retinal layer (SRL), and that between the IPL and the OPL was classified as the deep retinal layer (DRL). The OCTA en face images were extracted. The OCTA en face images of the DRL were analyzed using the projection artifact removal software built into the device.
Image Analysis
Each OCTA en face image was analyzed using ImageJ software (http://rsb.info.nih.gov/ij/index.html). We calculated the foveal avascular zone (FAZ) area (mm2) with AL correction using ImageJ and an original macro language (Kanno-Saitama Macro [KSM] program). KSM is an automated analysis program that extracts the FAZ area, and detailed methods have been published previously.11 The extracted FAZ area showed excellent reproducibility and was comparable to that by manual measurement. Macular vessel density was binarized for the 3×3 mm OCTA image using the Otsu method,12 which showed excellent reproducibility.13 Furthermore, the ratio for the whole 3×3 mm area of vessel signals, excluding the automatically extracted FAZ region, was quantified as the macular vessel density (%) (Figure 2).
 |
Figure 2 Optical coherence tomography angiography (OCTA) image (left), binarization image with the Otsu method for calculating the macular vessel density (mVD; middle), and the image obtained with the Kanno-Saitama Macro (KSM) method for calculating the foveal avascular zone (FAZ; right) area (upper, superficial layer; lower, deep layer). |
Statistical Analysis
We assessed the distribution of numerical variables by inspecting histograms and using the Shapiro–Wilk W-test of normality. Normally distributed variables (mean ± SD) were analyzed using the independent t-test. Non-normally distributed variables (median [quartiles]) were analyzed using the Mann–Whitney U-test. Categorical variables were compared using Fisher’s exact test. The correlations among macular vessel density, FAZ area, age, and retinal thickness were evaluated using the Pearson correlation coefficient. The relationships between macular vessel density or FAZ area and variables such as age, AL, IOP, OCT-derived retinal thickness, and self-reported history of systemic disease were analyzed using univariate and multivariate models. P-values < 0.05 were considered statistically significant. All statistical analyses were performed using JMP version 10.1 software (SAS Institute Inc., Cary, NC, USA) and STATA version 16 software (StataCorp LP, College Station, TX,USA).
Results
In the group of young healthy participants, three eyes showed abnormalities in the cpRNF thickness and were excluded. As a result, 41 eyes from 22 participants were included. In the post-cataract surgery group, the OCTA examination was performed on 28 eyes of 21 patients, and two eyes with a history of postoperative ocular hypertension were excluded. No eyes had postoperative OCT abnormalities, such as macular edema. As a result, 26 eyes from 21 patients were included. When OCTA examination was performed on both eyes, the right eye was analyzed; therefore, 43 eyes in 43 participants were analyzed (Figure 1).
The median age of all participants was 59.0 (27.0, 69.0) years, and no severe refractive error was observed (AL: 24.2 ± 1.3 mm, spherical equivalent: −0.75 [−2.25, 0.00] diopter). The retinal thickness in the OCT examination was 97.1 ± 10.8 µm for cpRNFL, 57.5 (54.6, 61.0) µm for mGCL-IPL, 82.3 (79.7, 86.8) µm for mIPL-OPL, and 293.6 ± 11.9 µm for the whole retina. The SSI (minimum value: 0; maximum value: 10) was 8 in all cases. For the post-cataract surgery group, the median period between OCTA examination and cataract surgery was 8.0 (5.0, 11.0) weeks. Macular vessel density of the SRL and DRL was significantly higher in young healthy participants than in post cataract surgery participants (p < 0.001). However, there was no significant difference between young healthy participants and Post cataract surgery participants in terms of the FAZ area for the SRL (p=0.217) and DRL (p=0.677). Of all the participants, 20.9% had hypertension as an underlying disease, and 6.9% had diabetes (Table 1). As shown in Figure 3, macular vessel density of both SRL and DRL showed a significant negative correlation with age (SRL: R2 = 0.317, p < 0.001; DRL: R2 = 0.437, p < 0.001). However, the FAZ area of both SRL and DRL did not show a significant correlation with age (SRL: R2 = 0.016, p = 0.426; DRL: R2 = 0.011, p = 0.493).
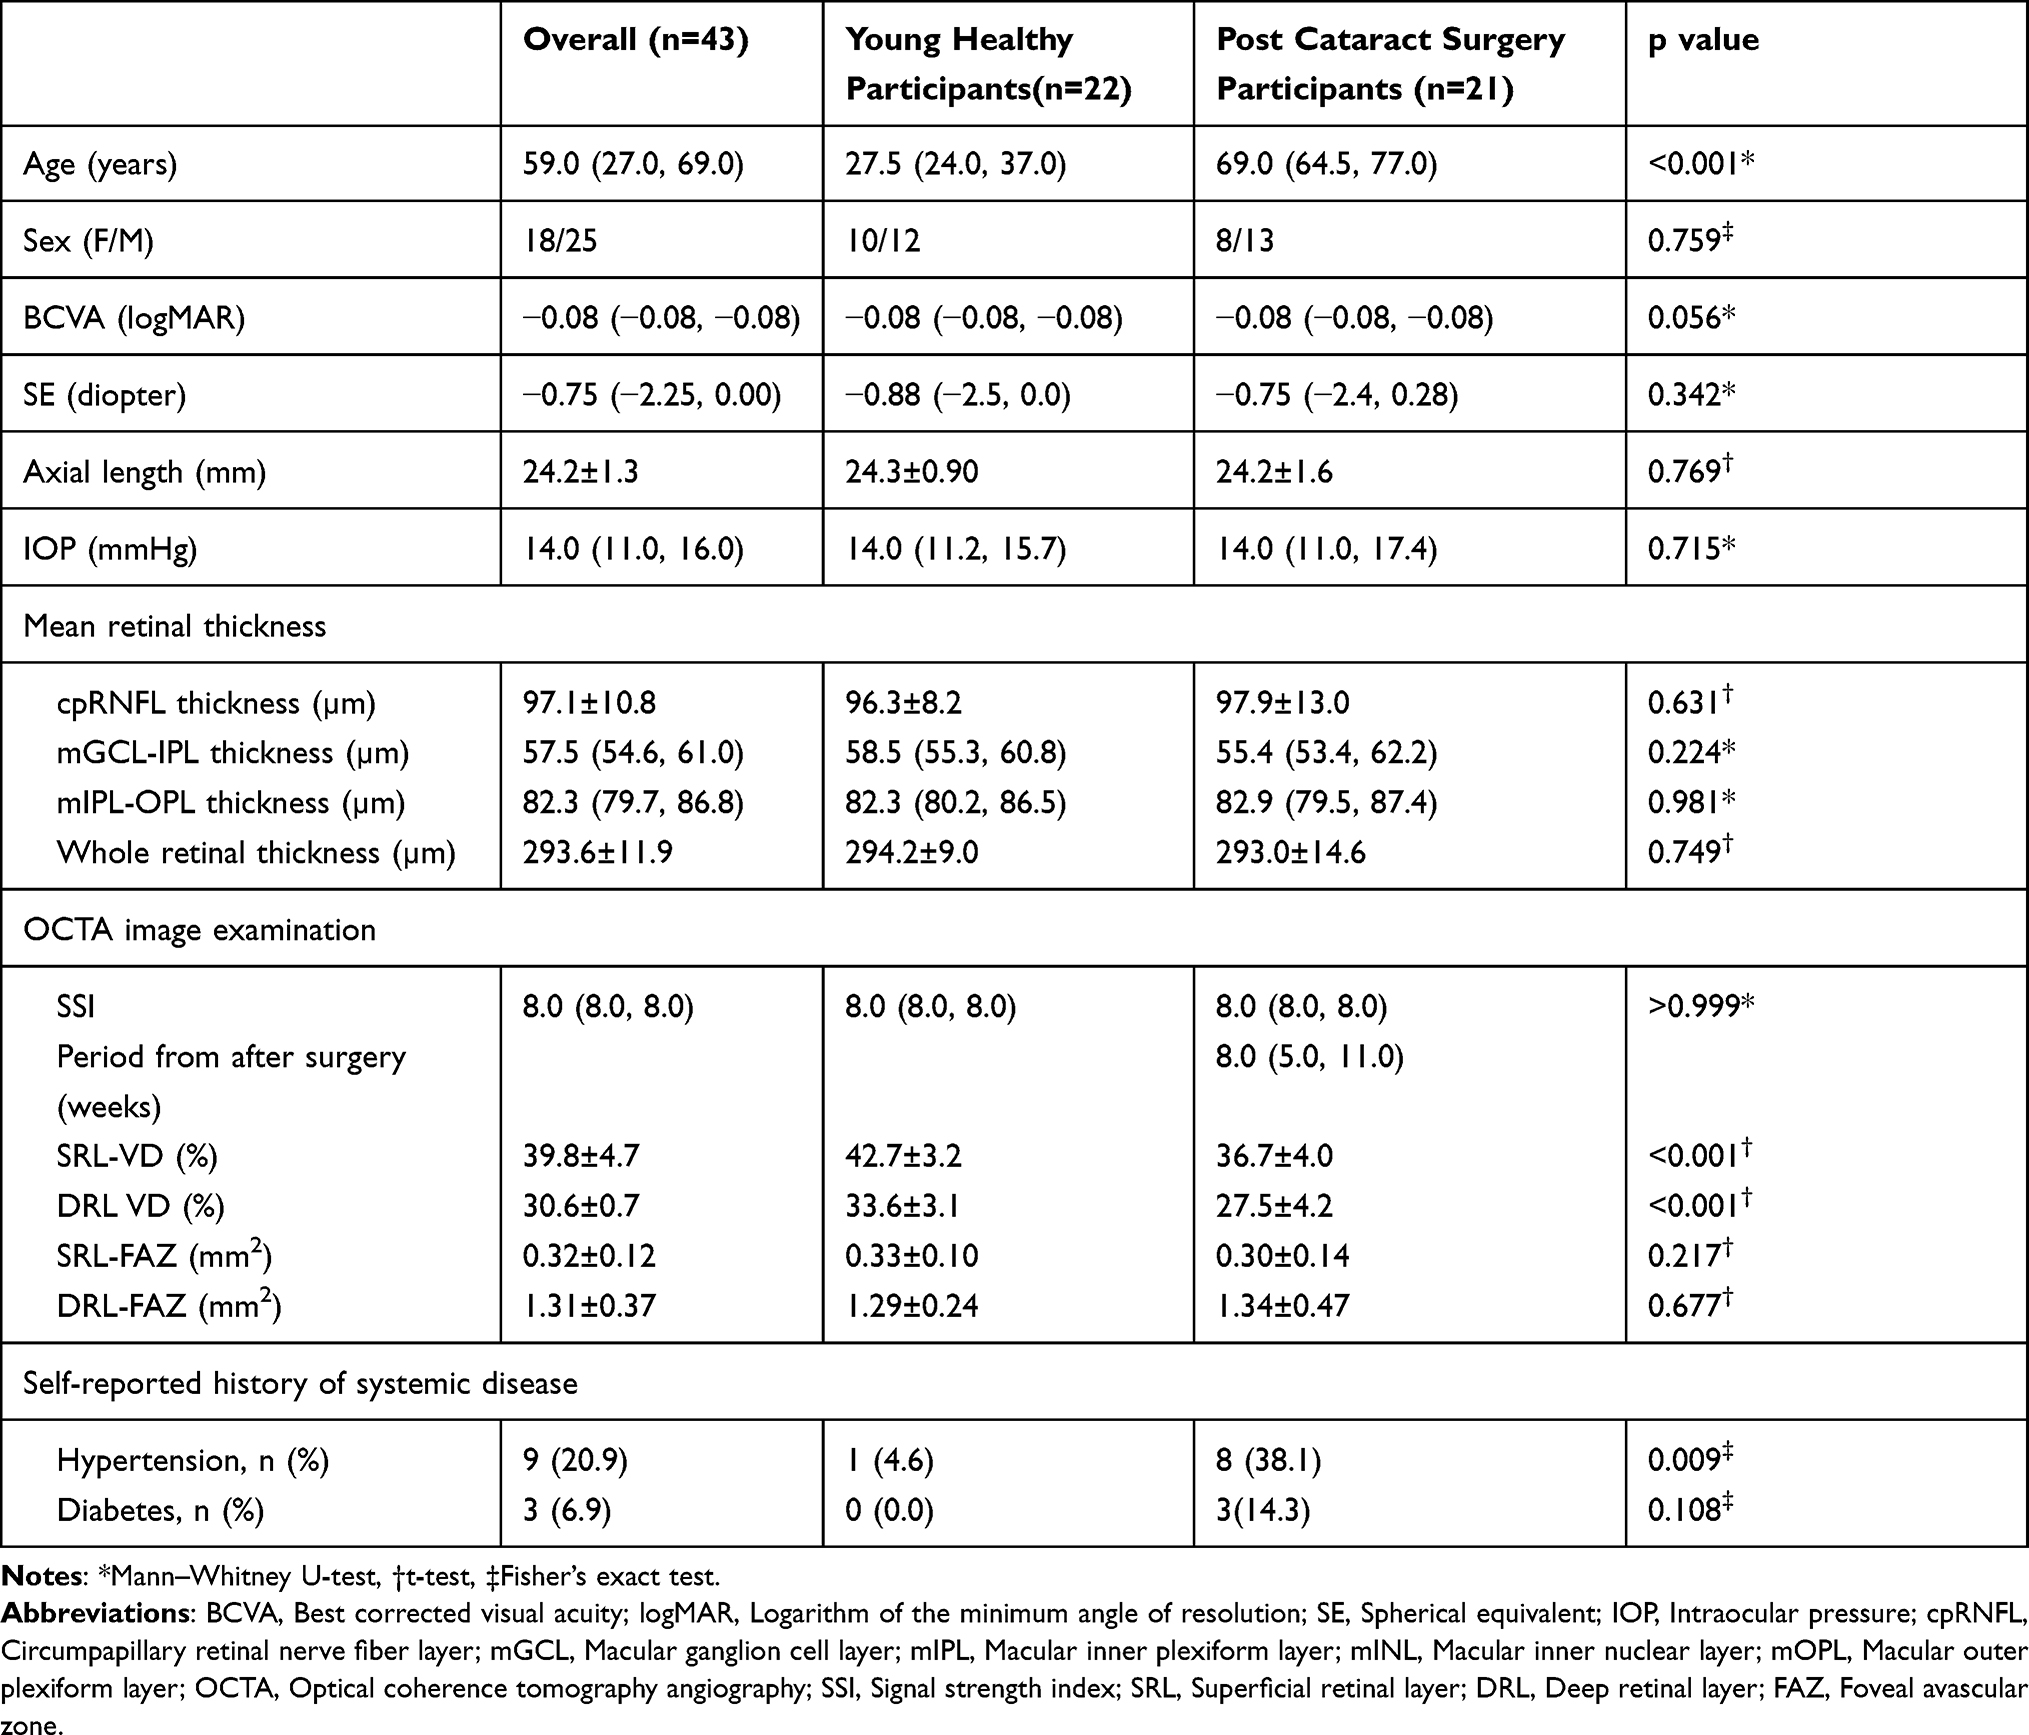 |
Table 1 Characteristics of Study Participants |
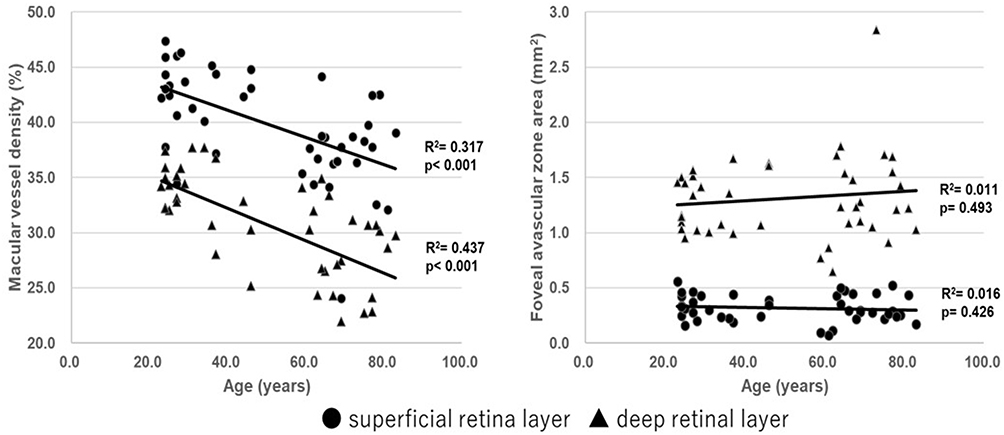 |
Figure 3 Regression analysis of macular vessel density and foveal avascular zone (FAZ) area with age in the superficial and deep retinal layers. Retinal macular vessel density in both the superficial retinal layer (SRL) and deep retinal layers (DRL) showed significant negative correlations with age (SRL: R2 = 0.317, p < 0.001; DRL: R2 = 0.437, p < 0.001). However, the FAZ area in the superficial and deep retinal layers was not correlated with age (SRL: R2 = 0.016, p =0.426; DRL: R2 = 0.011, p = 0.493). |
Multivariate analysis showed that macular vessel density in the SRL had significant correlations with age (β = −0.098, p < 0.001), sex (β = 3.594, p = 0.001), and self-repoted history of hypertension (β = −1.701, p = 0.013) (Tables 2 and 3). Macular vessel density in the DRL showed significant correlations with age (β = −0.132, p < 0.001) and AL (β = 0.900, p = 0.042), but not with self-reported history of hypertension (β = 0.648, p=0.653) or diabetes (β = 1.449, p=0.523). The FAZ area in the SRL did not show any significant correlations in the univariate analysis. The FAZ area in the DRL tended to correlate with the AL (β = −0.085, p = 0.055) but did not showed significant correlation with age (β = 0.001, p=0.581).
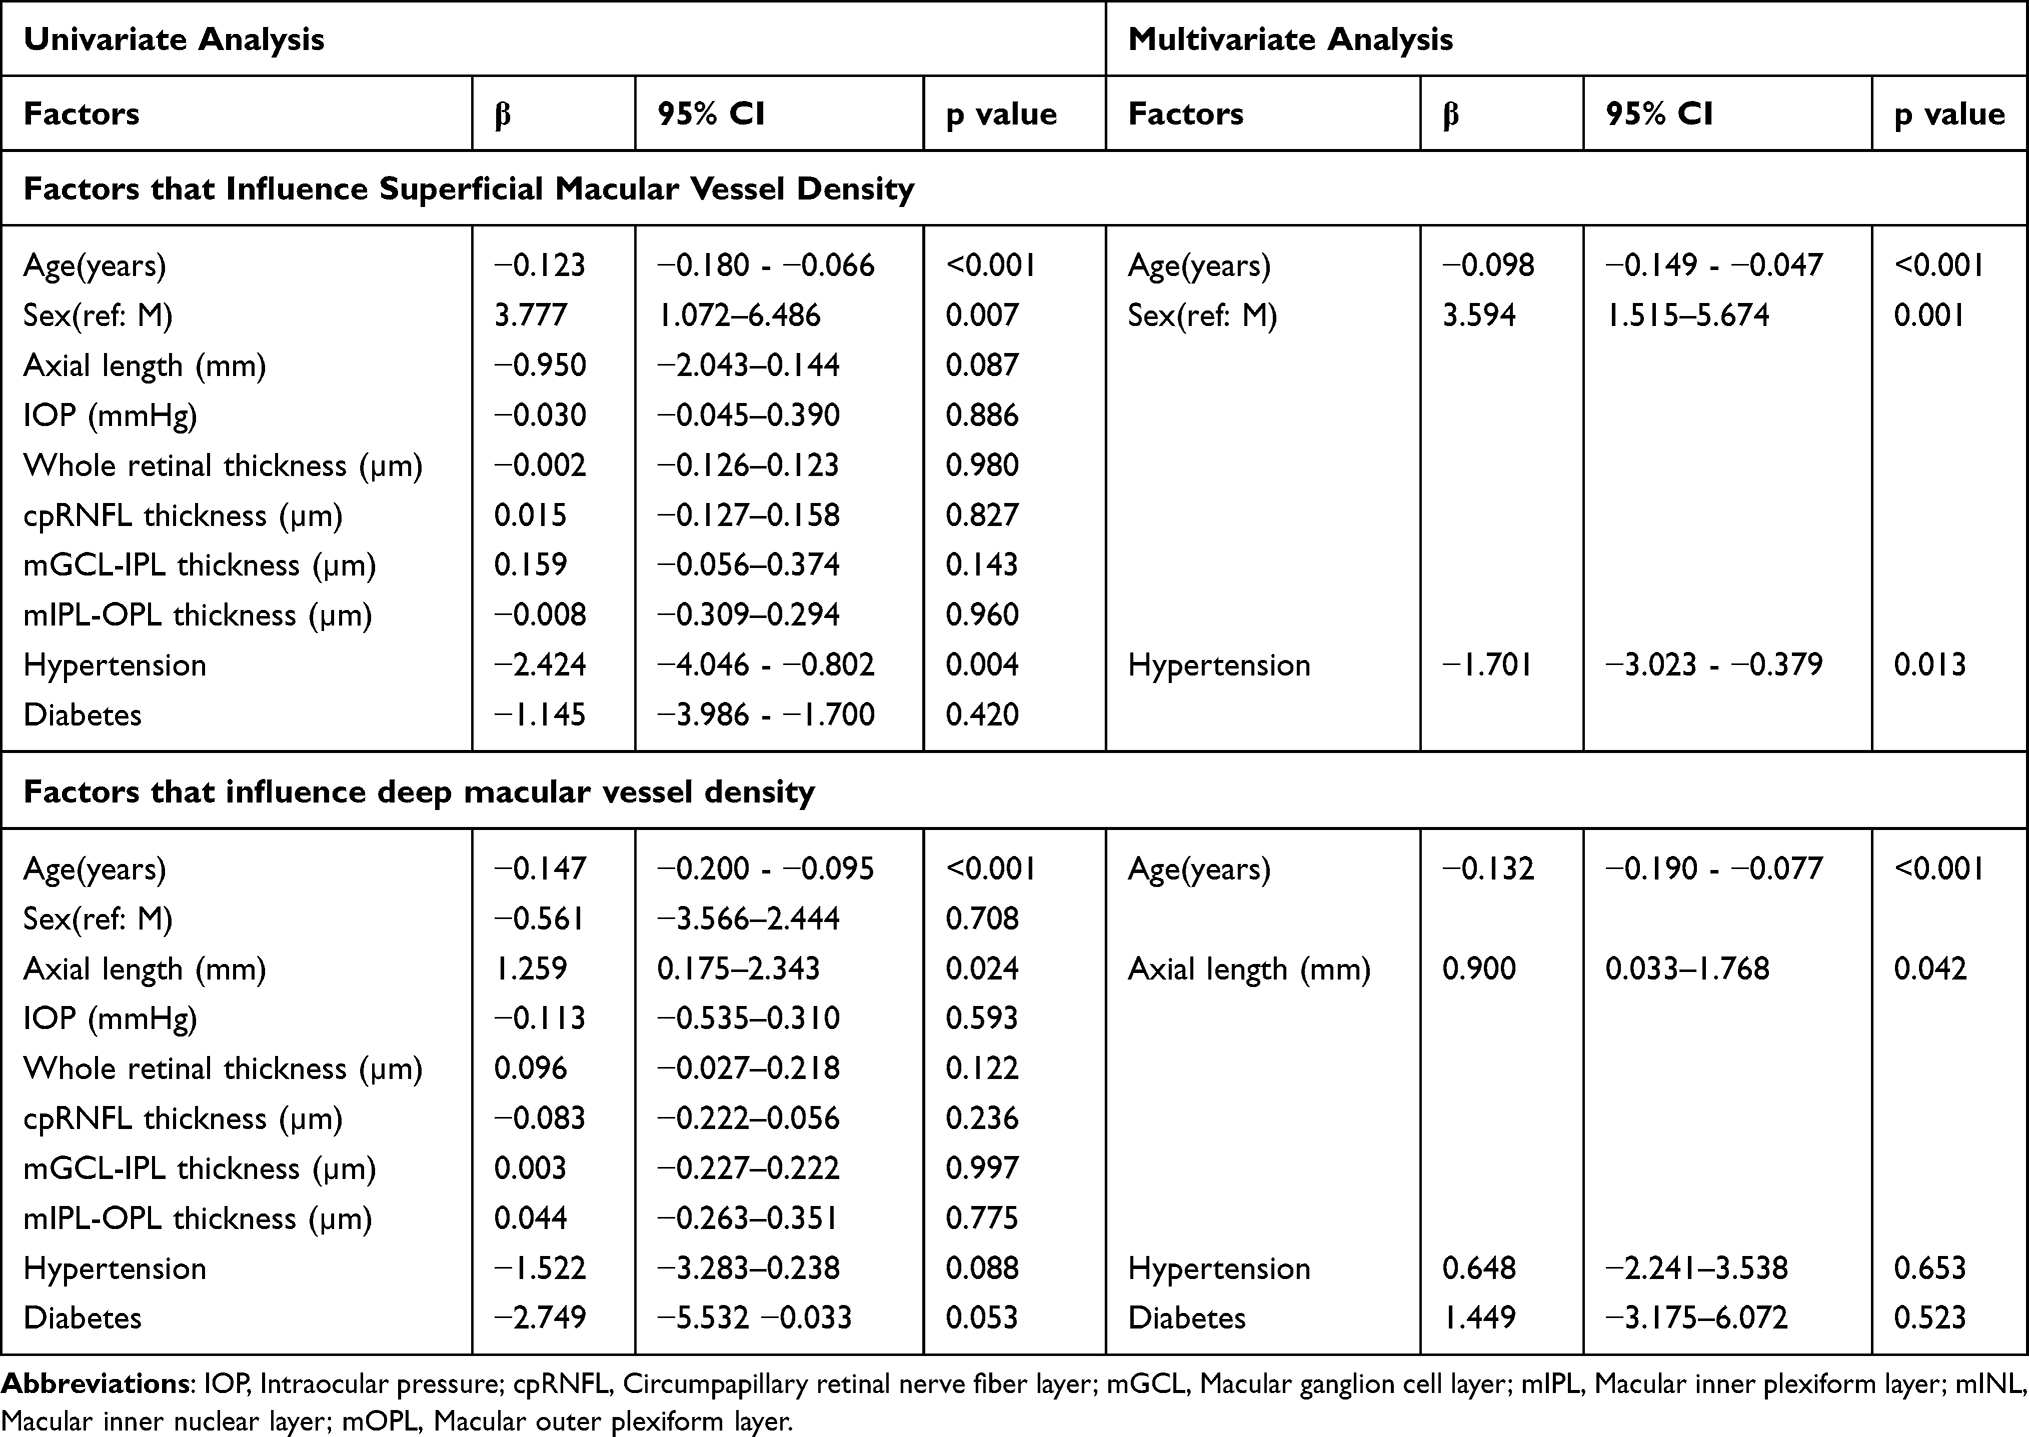 |
Table 2 Univariate and Multivariate Analyses of Factors Influencing Macular Vessel Density in the Superficial and Deep Retinal Layers |
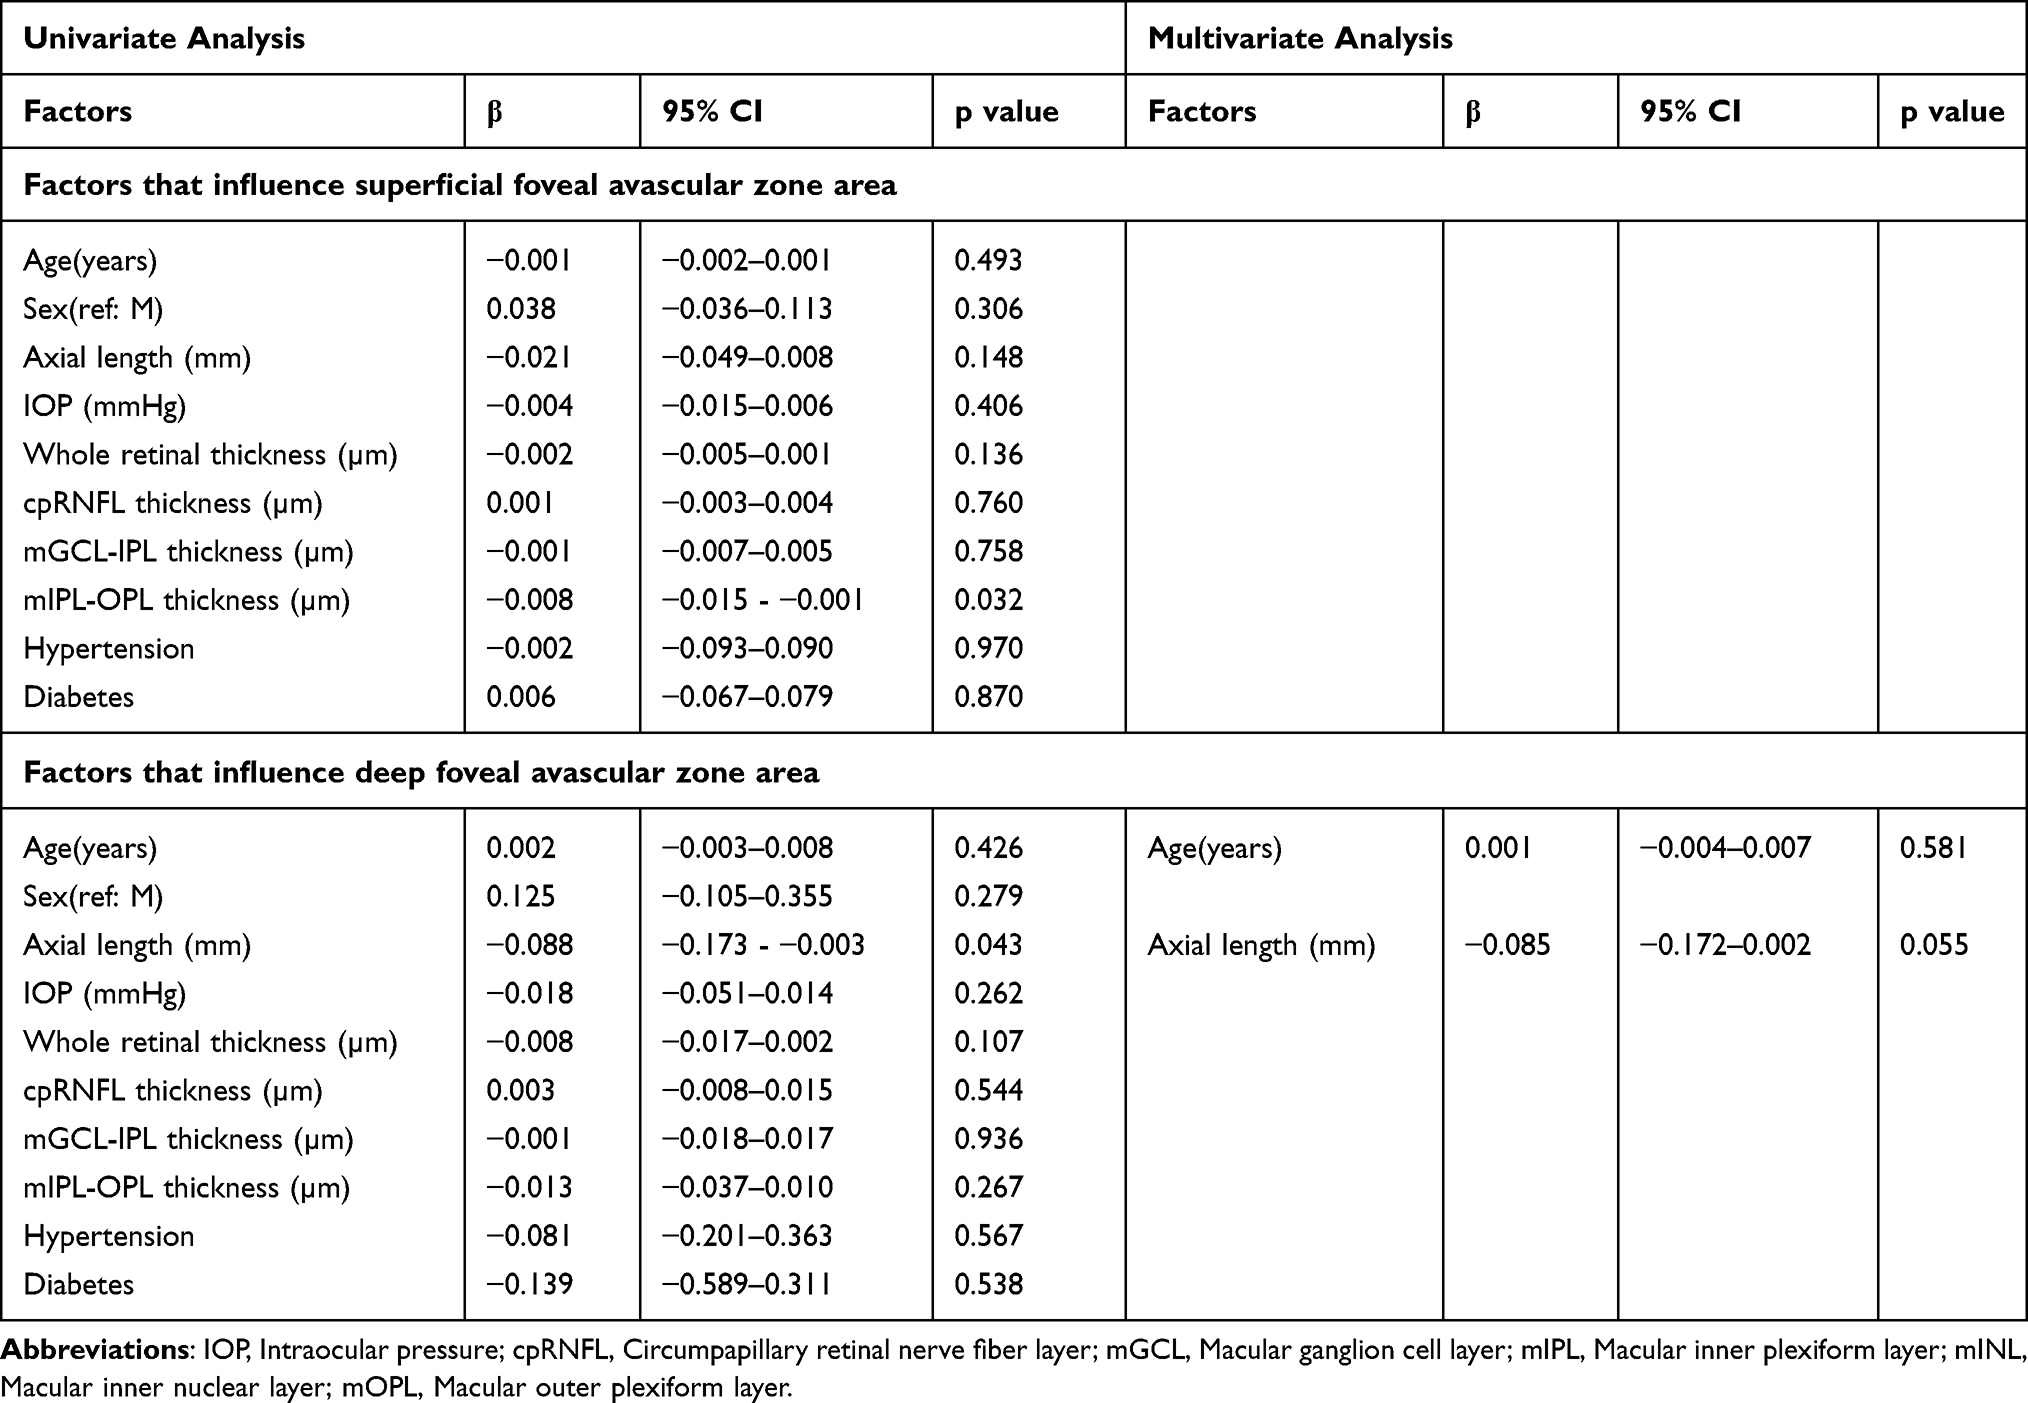 |
Table 3 Univariate and Multivariate Analyses of Factors Influencing the Foveal Avascular Zone Area in the Superficial and Deep Retinal Layers |
Macular vessel density of the SRL was significantly higher in women than in men (42.0 ± 3.9% vs 38.2 ± 4.6%; p = 0.007). However, macular vessel density of the DRL was not significantly different between men and women (30.8 ± 4.9% vs 30.3 ± 4.7%, p = 0.708). Furthermore, there was no significant difference between men and women in terms of the FAZ area of the SRL (male, 0.30 ± 0.13; female, 0.34 ± 0.11; p = 0.306) and DRL (male, 1.26 ± 0.44; female, 1.38 ± 0.22; p = 0.279).
Discussion
Although accumulating evidence indicates that vessel density in the macula region decreases with age and SSI, it is unclear whether this deterioration is due to a true decrease in retinal microvascular or attenuation of the OCTA signal due to cataract progression. In the present study, we showed that the macular vessel density decreased with age, even after adjusting for the effect of the signal intensity change induced by the cataracts. However, the FAZ area was not affected by age.
A previous study found that macular vessel density decreased with age,14 whereas another study showed that it was not correlated with age.15 OCTA image analysis is known to be affected by signal strength; particularly in the elderly, the signal intensity decreases because of fixation and opacity of the intermediate optic media, mainly due to cataracts. Macular vessel density15 and peripapillary vessel density16 are positively correlated with the SSI. Hence, the influence of SSI cannot be ignored in the quantitative analysis of vessel density. A previous study9 showed that SSI was significantly improved, and macular vessel density was significantly increased 1 week after cataract surgery; that study concluded that the lower density values before surgery were associated with lower image quality owing to media opacities, and the impact of cataracts on the OCTA assessment should always be considered. In our study, there was no significant difference in the SSI between young healthy eyes and post-cataract surgery eyes. Thus, it is possible to examine the factors affecting the macular microvascular architecture while excluding the effects of the SSI.
A large-scale study by You et al15 demonstrated that the parafoveal retinal vessel density in the SRL had significant correlations with sex and SSI and borderline correlations with age and AL, while the parafoveal vessel density in the DRL had significant correlations with SSI, AL, and creatinine levels. Although we did not perform blood tests in our study, we found that the other correlations were similar even when the effects of SSI were excluded. In addition, Coscas et al demonstrated that macular vessel density was high in both the SRL and DRL in women.16 Consistently, the present study found that the macular vessel density in the SRL was higher in women and showed a significant correlation with sex. However, macular vessel density in the DRL did not show a significant difference based on sex. Spectral-domain OCTA was used in the study by Coscas et al, and no projection artifact removal was performed to analyze the deep retina.17 The use of SS-OCTA and projection artifact removal software is recommended for DRL analysis, and further large studies with SS-OCTA and projection artifact removal software are needed.
The present study also demonstrated that the FAZ area was not affected by aging, even when the effect of the SSI was excluded. Consistently, most studies have shown no significant correlation of the FAZ area with age.18 However, one previous study observed that the superficial FAZ area had a positive correlation with age.19 Thus, a consensus has not been reached. In addition, one study showed that the FAZ area had sex-related differences and was larger in women than in men, and the FAZ area did not change with age in men but did so in women.20 Notably, the present study did not reveal a correlation of the FAZ area with age probably because it included more men than women. Moreover, Suda et al suggested that AL correlation in image analysis is important when the FAZ area is measured using OCTA.21 Linderman et al reported that the FAZ area had a negative correlation with the AL when the AL correction in image analysis was not considered; however, this correlation existed when the AL correction was considered.22 In our study, the FAZ area of the DRL showed a weak negative correlation with the AL. However, the number of cases was insufficient since there were only one and two cases with short AL of ≤ 22 mm and long AL of ≥ 26.5 mm, respectively. Thus, the range of values for the AL might be inadequate to draw more definitive conclusions. Additional studies including a larger number of eyes with various AL should be performed to confirm these findings. Furthermore, one previous study showed that the FAZ area was highly variable between individuals.23 This might be one of the reasons why the FAZ did not show age-dependent changes in this study. Longitudinal studies may be more suitable for detecting age-dependent changes in parameters with such large individual differences.
The study has several limitations. First, the sample size was small. Thus, further large population studies are needed. Second, systemic factors other than a self-reported history of hypertension and diabetes were not investigated. Third, the median period between OCTA examination and cataract surgery was 8 weeks, which might not have been sufficient; therefore, surgery-related effects, such as inflammation, cannot be ruled out. Fourth, topical anti-inflammatory medication, topical steroidal and non-steroidal anti-inflammatory drugs, and antibiotic medications were routinely used after surgery; therefore, surgery-related effects, such as postoperative medication, cannot be ruled out. However, OCT confirmed no pathological findings, including macular edema, and the slit-lamp exam recognized no intracameral or intravitreal inflammation or posterior capsular opacification. Liu et al24 reported that there was no significant difference in parafoveal vessel density between 1 week and 3 months postoperatively. Thus, the impact of a short postoperative observation period on the assessment of macular vessel density might be minimal. We believe that OCTA images in this period are acceptable as a clinically realistic model that is not affected by lens opacity. Fifth, each OCTA examination was performed only once, and fluctuations within the day or between days were not considered. However, the OCTA device and binarization method used in this study were confirmed to show high reproducibility in previous studies11,13 and were thus considered suitable for the analysis in the present study. Sixth, because the SS-OCTA device, Plex Elite 9000, does not have built-in software to analyze OCT parameters, we could not measure OCT and OCTA parameters with the same devices.
Conclusions
This study showed that the macular vessel density decreased with age, even when the effects of cataracts were excluded. However, the FAZ area might not be affected by age. Our findings suggest that the effects of age and cataracts should be considered when designing studies and interpreting OCTA findings of the retinal vasculature.
Abbreviations
OCTA, Optical coherence tomography angiography; FAZ, Foveal avascular zone; SSI, Signal strength index; AL, Axial length; cpRNFL, Circumpapillary retinal nerve fiber layer; mGCL-IPL, Macular ganglion cell layer–inner plexiform layer; mIPL-OPL, Macular inner plexiform layer–outer plexiform layer; SS, Swept-source; SRL, Superficial retinal layer; DRL, Deep retinal layer; KSM, Kanno-Saitama Macro; mVD, Macular vessel density.
Data Sharing Statement
All data generated or analyzed during this study are included in this article. Further inquiries can be directed to the corresponding author.
Ethics Approval and Informed Consent
This study was approved by the ethics committee of Saitama Medical University. Written informed consent was obtained for publication of this article and the accompanying images from the patients.
Acknowledgments
The authors thank Editage for the English language review.
Funding
This study was not supported by any funding.
Disclosure
The authors declare no conflicts of interest.
References
1. Spaide RF, Klancnik JM, Cooney MJ. Retinal vascular layers imaged by fluorescein angiography and optical coherence tomography angiography. JAMA Ophthalmol. 2015;133(1):45–50.
2. Spaide RF, Fujimoto JG, Waheed NK. Image artifacts in optical coherence tomography angiography. Retina. 2015;35(11):2163–2180.
3. Zhang Q, Zhang A, Lee CS, et al. Projection artifact removal improves visualization and quantitation of macular neovascularization imaged by optical coherence tomography angiography. Ophthalmol Retina. 2017;1(2):124–136.
4. Wu JS, Chen SN. Optical coherence tomography angiography for diagnosis of choroidal neovascularization in chronic central serous chorioretinopathy after photodynamic therapy. Sci Rep. 2019;9(1):9040.
5. Wintergerst MW, Herrmann P, Finger RP. Optical coherence tomography angiography for evaluation of sattler’s layer in Vogt-koyanagi-Harada disease. Ophthalmic Surg Lasers Imaging Retina. 2018;49(8):639–642.
6. Yoshikawa Y, Shoji T, Kanno J, Kimura I, Hangai M, Shinoda K. Optic disc vessel density in nonglaucomatous and glaucomatous eyes: an enhanced-depth imaging optical coherence tomography angiography study. Clin Ophthalmol. 2018;12:1113–1119.
7. Fard MA, Fakhraee G, Ghahvechian H, Sahraian A, Moghimi S, Ritch R. Macular vascularity in ischemic optic neuropathy compared to glaucoma by projection-resolved optical coherence tomography angiography. Am J Ophthalmol. 2020;209:27–34.
8. Brücher VC, Storp JJ, Eter N, Alnawaiseh M. Optical coherence tomography angiography-derived flow density: a review of the influencing factors. Graefes Arch Clin Exp Ophthalmol. 2020;258(4):701–710.
9. Yu S, Frueh BE, Steinmair D, et al. Cataract significantly influences quantitative measurements on swept-source optical coherence tomography angiography imaging. PLoS One. 2018;13(10):e0204501.
10. Bojikian KD, Chen CL, Wen JC, et al. Optic disc perfusion in primary open angle and normal tension glaucoma eyes using optical coherence tomography-based microangiography. PLoS One. 2016;11(5):e0154691.
11. Ishii H, Shoji T, Yoshikawa Y, Kanno J, Ibuki H, Shinoda K. Automated measurement of the foveal avascular zone in swept-source optical coherence tomography angiography images. Transl Vis Sci Technol. 2019;8(3):28.
12. Otsu N. A threshold selection method from gray-level histograms. IEEE Trans Systems Man Cybernet. 1979;9(1):62–66.
13. Shoji T, Yoshikawa Y, Kanno J, et al. Reproducibility of macular vessel density calculations via imaging with two different swept-source optical coherence tomography angiography systems. Transl Vis Sci Tech. 2018;7(6):31.
14. Fernández‐Vigo JI, Kudsieh B, Shi H, et al. Normative database and determinants of macular vessel density measured by optical coherence tomography angiography. Clin Exp Ophthalmol. 2019;48(1):44–52.
15. You QS, Chan JC, Ng AL, et al. Macular vessel density measured with optical coherence tomography angiography and its associations in a large population-based study. Invest Ophthalmol Vis Sci. 2019;60(14):4830–4837.
16. Lim HB, Kim YW, Nam KY, Ryu CK, Jo YJ, Kim JY. Signal strength as an important factor in the analysis of peripapillary microvascular density using optical coherence tomography angiography. Sci Rep. 2019;9:16299.
17. Coscas F, Sellam A, Glacet-Bernard A, et al. Normative data for vascular density in superficial and deep capillary plexuses of healthy adults assessed by optical coherence tomography angiography. Invest Ophthalmol Vis Sci. 2016;57(9):OCT211–23.
18. Leng Y, Tam EK, Falavarjani KG, Tsui I. Effect of age and myopia on retinal microvasculature. Ophthalmic Surg Lasers Imaging Retina. 2018;49(12):925–931.
19. Iafe NA, Phasukkijwatana N, Chen X, Sarraf D. Retinal capillary density and foveal avascular zone area are age-dependent: quantitative analysis using optical coherence tomography angiography. Invest Ophthalmol Vis Sci. 2016;57(13):5780–5787.
20. Gómez-Ulla F, Cutrin P, Santos P, et al. Age and gender influence on foveal avascular zone in healthy eyes. Exp Eye Res. 2019;189:107856.
21. Suda M, Yoshikawa Y, Terauchi G, et al. Magnification effect of foveal avascular zone measurement using optical coherence tomography angiography. Biomed Hub. 2020;5(2):79–86.
22. Linderman R, Salmon AE, Strampe M, Russillo M, Khan J, Carroll J. Assessing the accuracy of foveal avascular zone measurements using optical coherence tomography angiography: segmentation and scaling. Transl Vis Sci Technol. 2017;6(3):16.
23. Dubis AM, Hansen BR, Cooper RF, Beringer J, Dubra A, Carroll J. Relationship between the foveal avascular zone and foveal pit morphology. Invest Ophthalmol Vis Sci. 2012;53(3):1628–1636.
24. Liu J, Liu Q, Hua Y, et al. Microvascular changes in macular area after phacoemulsification and its influencing factors assessed by optical coherence tomography angiography. Ther Clin Risk Manag. 2021;17:405–414.
 © 2021 The Author(s). This work is published and licensed by Dove Medical Press Limited. The
full terms of this license are available at https://www.dovepress.com/terms
and incorporate the Creative Commons Attribution
- Non Commercial (unported, 3.0) License.
By accessing the work you hereby accept the Terms. Non-commercial uses of the work are permitted
without any further permission from Dove Medical Press Limited, provided the work is properly
attributed. For permission for commercial use of this work, please see paragraphs 4.2 and 5 of our Terms.
© 2021 The Author(s). This work is published and licensed by Dove Medical Press Limited. The
full terms of this license are available at https://www.dovepress.com/terms
and incorporate the Creative Commons Attribution
- Non Commercial (unported, 3.0) License.
By accessing the work you hereby accept the Terms. Non-commercial uses of the work are permitted
without any further permission from Dove Medical Press Limited, provided the work is properly
attributed. For permission for commercial use of this work, please see paragraphs 4.2 and 5 of our Terms.