Back to Journals » Psychology Research and Behavior Management » Volume 15
Evoked Acute Stress Alters Frontal Midline Neural Oscillations Affecting Behavioral Inhibition in College Students
Received 21 July 2022
Accepted for publication 27 September 2022
Published 7 October 2022 Volume 2022:15 Pages 2915—2926
DOI https://doi.org/10.2147/PRBM.S382933
Checked for plagiarism Yes
Review by Single anonymous peer review
Peer reviewer comments 2
Editor who approved publication: Dr Igor Elman
Xiaoguang Wu,1,* Siyu Di,1,* Chao Ma1,2
1Normal College, Shihezi University, Shihezi, People’s Republic of China; 2Center of Application of Psychological Research, Shihezi University, Shihezi, People’s Republic of China
*These authors contributed equally to this work
Correspondence: Chao Ma, Normal College, Shihezi University, Shihezi, 832000, People’s Republic of China, Tel +86 13935269606, Fax +86 0993-2057553, Email [email protected]
Purpose: The current research of the effect of acute stress on individual behavioral inhibition remains divergent. The present study aims to explore the effects of acute stress on behavioral inhibition in college students and to understand the neural oscillatory characteristics of their behavioral inhibition process.
Patients and Methods: We invited 27 college students (12 males and 15 females) to participate in the study. The experiment was conducted using the Trier Social Stress paradigm to evoke an acute stress state and an out-of-speech reading to set a neutral state. Participants completed a two-choice Oddball task in the acute stress state and the neutral state, respectively. We used a 64-channel EEG cap to record EEG data from university students during the experimental task. In combination with the ERO technique, we compared the reaction time, the number of errors, and the power of the alpha (8– 13 Hz) and theta (4– 8 Hz) frequency bands at the midline of the frontal lobe for subjects in both states. The correlation between the area under the stress area line and the alpha as well as theta frequency bands was also analyzed.
Results: We found that in the two-choice Oddball task, the response inhibition time was shorter, the number of response errors decreased, and the alpha-band power values decreased in the acute stress state compared to the neutral state. For the standard stimulus, the theta-band power increase in the acute stress state.
Conclusion: Our results suggest that evoked acute stress promotes behavioral inhibition in college students by affecting their frontal midline neural oscillations.
Keywords: stop single task, two-choice oddball, time-frequency analysis, inhibitory control
Introduction
Inhibitory control, one of the three core executive functions, is thought to underlie both working memory and cognitive flexibility.1 Inhibitory control can not only suppress dominant response impulses and provide the basis for attention as well as decision-making, but help individuals to achieve future goals by managing competing-stimuli and inhibiting non-target stimuli.2 Therefore, enhancing inhibitory control is of great importance for individuals to accomplish their goals. Inhibitory control can be further divided into cognitive and behavioral inhibitory abilities. Cognitive inhibition ability refers to the inhibition of mental processes such as attention and memory at the cognitive level. Behavioral inhibition refers to the inhibition of external cue dominance or automatic responses in order to achieve correct reflection of the target only.3
Behavioral inhibition is measured mainly using the go/no-go task and the stop signal task (SST).4,5 Although these two tasks are simple and easy to use, they still have some problems. However, the first is that the behavioral indicators of these two tasks are not complete. In the go/no-go task, since the reaction time of the subjects could not be counted in the no-go task, only the error rates of the two tasks could be compared.6 The SST task, on the other hand, can only compare response-time metrics because it controls for the correctness of the subjects. Secondly, when conducting electrophysiological studies, both tasks are disturbed by the motor component, ie, the action of the finger keys, thus affecting the degree of interpretation of their electrophysiological results. To address the above existing problems, Yuan et al modified the two-choice Oddball paradigm for evoking behavioral inhibition in subjects based on the classical Oddball task.7 The modified two-choice Oddball paradigm has the following characteristics. First, in the two-choice Oddball task, subjects are required to respond to two types of stimuli with keystrokes. One type is the standard stimulus, which appears more often and corresponds to more responses. The other category is the deviant stimulus, which occurs less frequently and corresponds to fewer responses. Second, the response time difference between the standard and deviant stimuli is used as a behavioral inhibition index, while effectively addressing the interference of the motor component on the electrophysiological results. The two-choice Oddball paradigm is used to evoke behavioral inhibition in subjects in this study.
Stress refers to the adaptive response of the organism in response to an external threat when the individual is exposed to it. A number of studies have examined the effects of positive and negative emotions on behavioral inhibition, but results on the effects of acute stress on individual behavioral inhibition remain divergent. This disagreement may be due to differences in stressors, stress levels, task difficulty, and the interval between stress and experimental manipulation. Acute stress has been demonstrated in certain research to increase people’s behavioral inhibition. Dierolf, for instance, employed the Trier Social Stress Test (TSST) paradigm to measure subject response inhibition using a go/no-go task after creating acute stress states in men of various ages, and he discovered that the stress group had shorter inhibition periods and smaller N2d wave amplitudes.8–10
Whereas other studies have suggested that acute stress impairs an individual’s response inhibition.11,12 When Jiang et al used the same paradigm as Dierolf to study individual response inhibition, they found an increase in response time and a significant increase in P3d wave amplitude in the stress group. Other researchers have concluded that stress does not significantly affect response inhibition.13,14 The majority of recent research on how acute stress affects behavioral inhibition has been on time-domain studies, which have the benefit of high temporal precision and can give an understanding of how cognitive changes in participants’ behavioral inhibition processes develop over time. Time-domain (TD) analysis, on the other hand, can only use the time-locked and phase-locked signals in the EEG signal, ignoring the electrical signals that are not strictly phase-locked. As a result, time-frequency (TF) analysis is necessary to provide additional information about the data present in the EEG.
Time-frequency analysis, one of the methods used to assess event-related potentials, has been shown to correlate its frequency bands with common components in ERPs. In their study of individual behavioral inhibition using the go/no-go task, Jeremy et al found that theta-band and delta-band power values derived from time-frequency analysis were significantly correlated with the N2 and P3 components of the time-domain analysis results. It was also observed that the P3 amplitude increased significantly in the no-go task, and the power in the delta-and theta-bands also increased dramatically.15 It has been shown that the alpha-band (8–13 Hz, 100–400ms) is thought to be associated with cessation of activity or inhibition. This frequency band increases the signal-to-noise ratio within the cerebral cortex by inhibiting useless or conflicting cognitive processes. As the task becomes more demanding, more inhibition is required and the power value decreases.16 Theta-band (4–8 Hz, 200–400 ms) is thought to be associated with a complex set of cognitive processes, including alertness, arousal or readiness, action detection, and coping with conflict.17,18 When investigating the effects of acute stress on meaningful memory control, researchers found that stress impaired individuals’ memory control, as evidenced by a significant decrease in their theta-band power.19 Matti et al investigated neural oscillations in individuals completing a mental arithmetic task during a stressful state and found a delayed increase in the middle prefrontal theta-band and a decrease in power values in the stressful state compared to the neutral state.20 Therefore, in this paper, we combined ERO (Event-related Oscillations) analysis and selected alpha-and theta-band power as indicators of behavioral inhibition to explore the effects of acute stress on individual behavioral inhibition.
In summary, does evoked acute stress influence behavioral inhibition in college students by affecting neural oscillations? How do the alpha and theta bands change? The present study used the TSST paradigm to evoke acute psychological stress in subjects, who completed a two-choice Oddball task in a neutral state and a stressful state respectively while recording EEG signals and subjective emotional ratings.21 Acute stress has been shown to affect an individual’s ability to inhibit behavior, but there is disagreement about its direction of action. According to the relevant descriptions in resource-limited theory, perceptual processing capacity and behavioral control capacity are used as a limited resource for the entire executive control process. When individuals deal with environmental threats, some of their cognitive resources are taken up, which in turn impairs their ability to deal with the task.22 The present study hypothesizes that moderate stress would occupy individuals’ cognitive resources and thus impair their behavioral inhibition. Specifically, the duration of behavioral inhibition increases under acute stress, the number of errors rises, and the power of the theta band decreases as well as the power of the alpha band increases.
Materials and Methods
Subjects and Procedure
A priori analysis was conducted by G Power 3.1 software (f=0.3, α=0.05, 1-β=0.80, ANOVA: repeated measures, two levels within subjects), and the results were calculated to show a sample size of 24. A convenience sampling method was adopted to recruit 30 college student subjects, 15 of each gender, to complete the task in both acute stress and neutral states by posting a recruitment announcement on campus. Inclusion criteria: age 18 to 25 years, right-handed, no major physical illness, no history of neurological or psychiatric disorders, no previous participation in relevant trials, non-restricted dieters, no color weakness or color blindness, body mass index in the normal range (18.5–23.9), and normal vision or more positive vision. Exclusion criteria: Trait Anxiety Inventory23 Scores (26.1±3.8) were higher than 48 (moderate anxiety or higher) and Beck Depression Inventory24 Scores (6.7±3.1) were higher than 14 (moderate depression or higher). At the end of the trial, one subject failed to record all data due to an instrument error, and the other two subjects had excessive signal noise due to physical activity during the trial, which were deleted. 27 cases were actually enrolled, including 12 males and 15 females, aged 18–25 years old, with a mean age of (20±2) years. The study was reviewed and approved by the local medical ethics committee, and the subjects all voluntarily participated in the trial and signed the informed consent form.
Trials were conducted using a 2-state (stress, neutral) X 2-stimulus cues (deviant stimulus, standard stimulus) within-subjects trial design. Subjects were contacted one day in advance and told not to participate in strenuous exercise and not to eat for 2h before the test. Subjects were asked verbally before the test whether they had complied with the above requirements. Upon arrival at the laboratory, subjects first washed their hair, sat quietly for 20 min, and then filled in their personal information and administered the first SSAI (short version of the State Anxiety Inventory). The second SSAI was administered after the subjects wore the equipment and completed the practice test. Afterwards, the subjects performed the TSST paradigm or reading for 15 min and were required to take the 3rd measurement after completion. After stress/neutral state was evoked, subjects were asked to complete a two-choice oddball task and EEG data were recorded, and a 4th measurement was taken after the task was completed. After subjects rested for 20 min, SSAI was measured for the 5th time, followed by the TSST or reading task, and measured for the 6th time. After subjects completed the last two-choice Oddball task, EEG data were recorded and the 7th measurement was taken. After the subjects finished washing, the 8th measurement was administered. The 1st measurement was used as a baseline for mood, and the last measurement was used as a response to the subject’s mood recovery after completing the task. The results of the middle 6 measurements were used to assess subject status while calculating the area under the stress and neutral zone lines. See Figure 1.
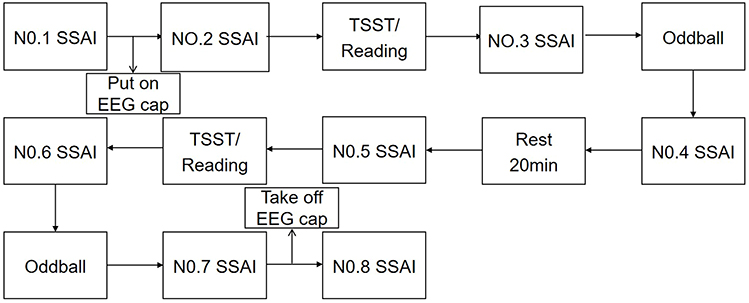 |
Figure 1 Flow diagram of experiment. |
Task
A two-choice Oddball task was used to evoke response inhibition, and the stimulus materials were the letter pictures “W” and “M”. The appearance of the standard stimulus “M” required the subject to press “F”, while the deviant stimulus “W” required the subject to press “J”. The whole test procedure was prepared by E-prime 2.0, and the stimuli were presented by a DELL 23-inch LCD monitor with a picture size of 356 pixel. The test consisted of 280 trials, including 200 standard stimuli and 80 deviant stimuli. Each trial started with a red “+” gaze dot in the center of the screen for 800ms, followed by a random blank screen for 500~1500ms. Then a standard/deviant stimulus appeared randomly with a presentation time of 1000ms, and subjects were required to respond correctly in time. After the button is pressed, there is a 1000ms blank screen. The whole process is recorded using E-prime 2.0 for trial response time and number of errors. See Figure 2.
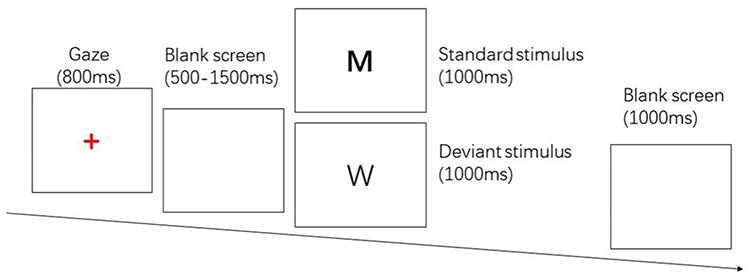 |
Figure 2 Two-choice oddball task. |
Stress-Evoking
The modified version of the Trier Social Stress Test was used to evoke an acute stress state, which consisted of the free speech and mental arithmetic.21 In the acute stress state, subjects were simulated to participate in a multi-competitive recruitment event. Subjects were given 2 min to organize their language and then completed a self-presentation of about 5 min. When the subjects had less than 5 min for self-presentation, each of the three experimenters asked the subjects about the prepared questions. The whole speech process was videotaped and later evaluated according to the subjects’ performance in the task. After completing the free speech task, subjects were also asked to complete a mental arithmetic task of subtracting 17 consecutively from 2023. No feedback was given for correct calculations, and subjects were reminded to stop and restart from 2023 for incorrect calculations. Subjects rested for 20 min after completing the stress task and the trial, and continued with the neutral task (reading a book or newspaper for 15 min).
Subjective Measurements
The short version of the State Anxiety Inventory (SSAI)25 was used in this study to measure individuals’ state anxiety. The scale consists of a total of eight items, including sadness, disgust, anger, distracted, nervous, upset, relaxed, and calm, and is scored on a seven-point scale from 1 (very non-conforming) to 7 (very conforming). The last two items scored inversely, with higher total scores representing higher levels of state anxiety.
EEG Recording
EEG signals were acquired using an EEG acquisition system from Neuroscan. The EEG cap was a 64-conductor acquisition cap and the amplifier was synAmps.2 Vertical EEG electrode points were placed 2 cm above and below the left eye and horizontal EEG electrode points were placed 2 cm lateral to both eyes. EEG data were collected using Curry 7 software, and the average value of bilateral mastoids (M1 and M2) was used as a reference. The impedance values between all electrode points and the scalp were less than 10 kΩ at the beginning of the test. The sampling frequency was 1000 Hz/conductance. EEG was acquired in DC mode, and EEG data were filtered online during the test using a DC-50 Hz band-pass filter.
EEG Processing
At the end of continuous data acquisition, EEGLAB 13.0 was used for offline processing. Waves below 0.05 Hz, and above 30 Hz were removed by EEGLAB. The sampling rate was reduced to 500 Hz/conductor. Segmentation was performed with stimulus onset as the zero point, 1000 ms before stimulus onset and 2000 ms after stimulus onset. After segmentation, independent component analysis2 was used to remove artifacts such as electrooculography. And then the extremes of voltage greater than ±100 μV were removed.
Time-Frequency Analyses
Using the Study function in EEGLAB 13.0, a Study file was created and 4 condition numbers were set for the paired sample test. The EEG data were transformed using wavelet variation, spherical substitution using adjacent electrode points for replacement electrodes, using sliding hanging window (1–30Hz, 1Hz steps), with the lowest frequency (1Hz) set at 3 cycles and the highest frequency (30Hz) set at 25 cycles with a scaling factor of 0.8. The time window for time-frequency analysis was −443 −1441ms, 942 sampling points.
According to previous studies, behavioral inhibition is mainly related to theta and alpha frequency bands in the frontal lobe region,20 therefore the average power of oscillations at six electrode points in the central frontal region of the scalp (F1, FZ, F2, FCZ, FC1, FC2) was selected for analysis. Using the plotting tool in the study, the spectrum of electrode point Fz was plotted and the whole-brain data was topographically mapped.
Statistical Analyses
A 3 (time points: pre-stress, while-stress and post-stress.) × 2 (state: stress, neutral) repeated measures ANOVA was performed using the SSAI scale scores as an indicator of stress. Paired-samples t-tests were performed on the area under the line for the two state zones. Paired-samples t-tests were conducted for time points 1 and 8. A 2 (stimulus: standard, deviation) × 2 (state: stress, neutral) repeated-measures ANOVA was performed on the correct response time and number of errors for the two types of stimuli. Paired-samples t-tests were performed with the difference in correct response times for the two types of stimuli. A 2 (state: stress, neutral) × 2 (stimulus: standard, deviation) repeated-measures ANOVA was performed for alpha-and theta-band power. The measures conformed to a normal distribution and were expressed as mean ± standard deviation, and P values for all repeated-measures ANOVAs were Greenhouse spherical corrected. Statistical analysis was performed using SPSS 26.0 software. Pearson product difference correlation analysis was performed between the area under the stress curve and the response time difference, the number of errors, and the average power of alpha and theta frequency bands under two stimuli.
Results
Subjective Measurements
Both the time point main effect [F (4, 104) = 59.28, p<0.001] and the main effect of the state [F(1, 26)=100.89, p<0.001] were statistically significant on the SSAI scale scores. SSAI scores were higher at the time of stress and at the post-stress time point compared to the pre-stress time point. Scores were higher in the stressful state compared to the neutral state. The interaction between state and time points was statistically significant on scores [F (4, 104) = 53.71, p<0.001]. Post hoc tests showed that scores were significantly higher in the acute stress state than in the neutral state at time points 3/6 and 4/7 (P<0.001). See Table 1. A paired samples t-test of the area under the two state curves showed that the area under the stress state curve was greater than that under the neutral state [(52.1±10.5) vs (42.1±9.6), t=9.23, P< 0.001], and the results of the paired samples t-test at time points 1(NO.1 SSAI) and 8(NO.8 SSAI) showed no statistically significant differences (P>0.05). See Table 2.
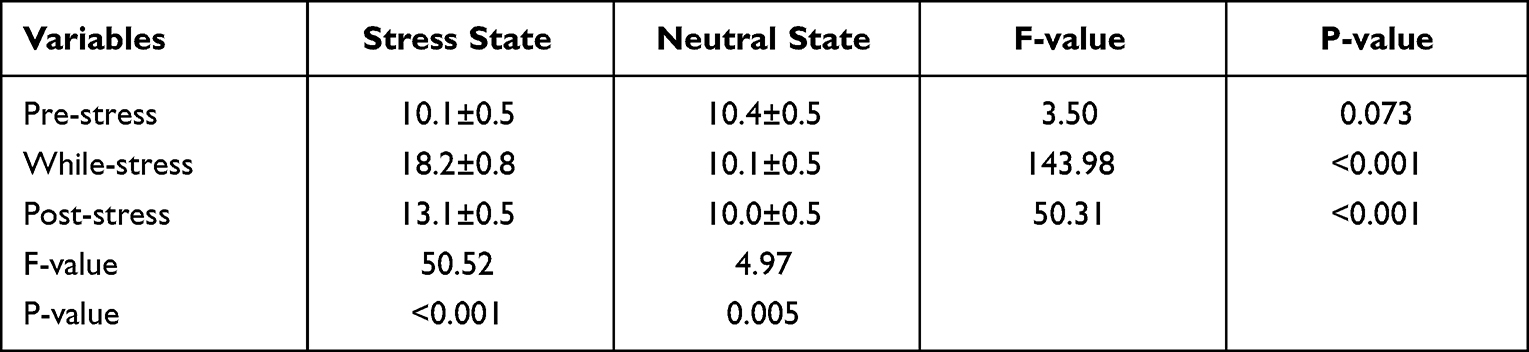 |
Table 1 Comparison of SSAI Scale Scores Between Subjects in Stress and Neutral States at Different Time Points [( |

 |
Table 2 Comparison of the Power of the Alpha and Theta Frequency Bands of the Two Stimuli in the Stress and Neutral States [( |

Behavior
The main effect of the state [F (1,26) = 10.26, P<0.001] was statistically significant, and the stress state reaction time [(441.1±9.1) ms] was longer than the neutral state [(422.3±10.6) ms]. The stimulus main effect [F (1,26) =138.15, p<0.001] was statistically significant, and the deviant stimulus reaction time [(485.2±12.7) ms] was longer than the standard stimulus reaction time [(377.7±7.7) ms]. The stimulus-state interaction was statistically significant [F (1,26) =4.70, p=0.039]. Subjects had longer reaction times in the stress state than in the neutral state in response to the standard stimulus (P<0.001), whereas the difference in reaction times between the stress and neutral states was not statistically significant in response to the deviant stimulus (P> 0.05). Subjects had longer reaction times in both the stress and neutral states than in the standard stimulus (P<0.001). A paired-samples t-test of the difference in reaction time (RT) between subjects in the stress and neutral states showed that the difference in RT was greater in the neutral state (119.90±70.69) ms than in the stress state (96.29±34.20 ms, t=2.17, P=0.03). See Figure 3.
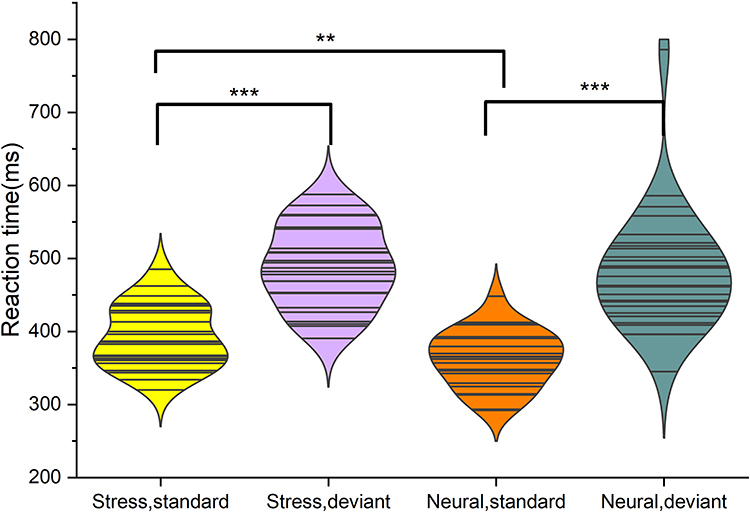 |
Figure 3 Standard stimuli: response time is longer in the stress state than in the neutral state; deviant stimuli: no statistically significant difference in response time between the stress and neutral states. Stress and neutral states: reaction time of deviant stimuli was longer than that of standard stimuli. *P<0.05; **P<0.01; ***P<0.001. |
In terms of number of errors, the main effect of the state [F (1,26) =4.56, p=0.042] was statistically significant, and the number of errors in the stress state (2.0±0.4) was smaller than in the neutral state (2.4±0.5). The main effect of stimulus [F (1,26) =32.95, p<0.001] was statistically significant, and the standard stimulus (1.6±0.4) error times less than deviant stimuli (2.8±0.5). The stimulus type-state interaction was not statistically significant (P>0.05). See Figure 4.
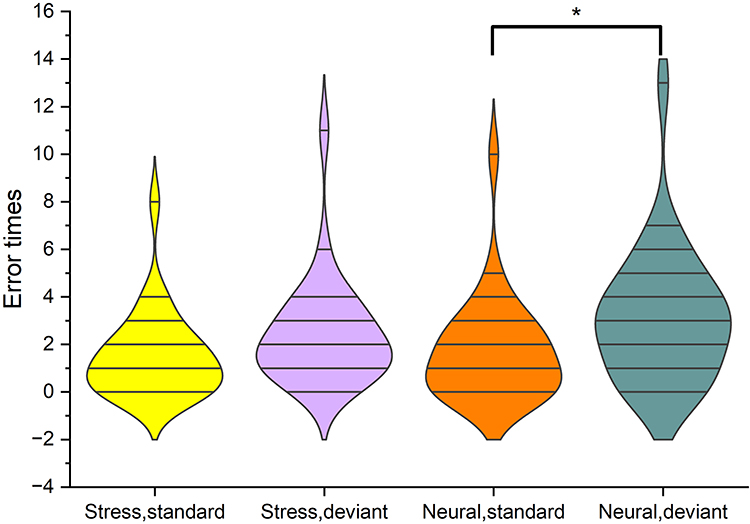 |
Figure 4 Number of errors: less in the stress state than in the neutral state. Number of errors in the neutral state: standard stimuli less than deviant stimuli. *P<0.05. |
EEG
(1) Alpha-band: The results showed a significant main effect of stimulus type, F (1,26) = 19.01, p< 0.001, η2 = 0.42. And deviant stimulus (−0.79 ± 0.49) dB is significantly smaller than standard stimulus (−1.52 ± 0.45) dB. The main effect of state was significant, F (1,26) = 19.25, p< 0.001, η2 = 0.42. And the stress state (−0.78 ± 0.45) dB was significantly smaller than the neutral state (−1.55 ± 0.49) dB.
(2) Theta-band: The results showed a significant main effect of stimulus type, F(1,26 = 127.92, p< 0.001, η2 = 0.83. And the deviant stimulus (4.99 ± 0.37) dB was significantly greater than standard stimulus (1.65 ± 0.23) dB. The stimulus type-state interaction was significant, F(1,26) = 10.13, p = 0.004, η2 = 0.27. Post hoc tests showed no significant difference between the two states when responding to deviant stimuli (P>0.05). In contrast, the stress state (1.93 ± 0.21) dB was significantly greater than the neutral state (1.38 ± 0.26) dB in response to the standard stimulus (P<0.001). See Figure 5.
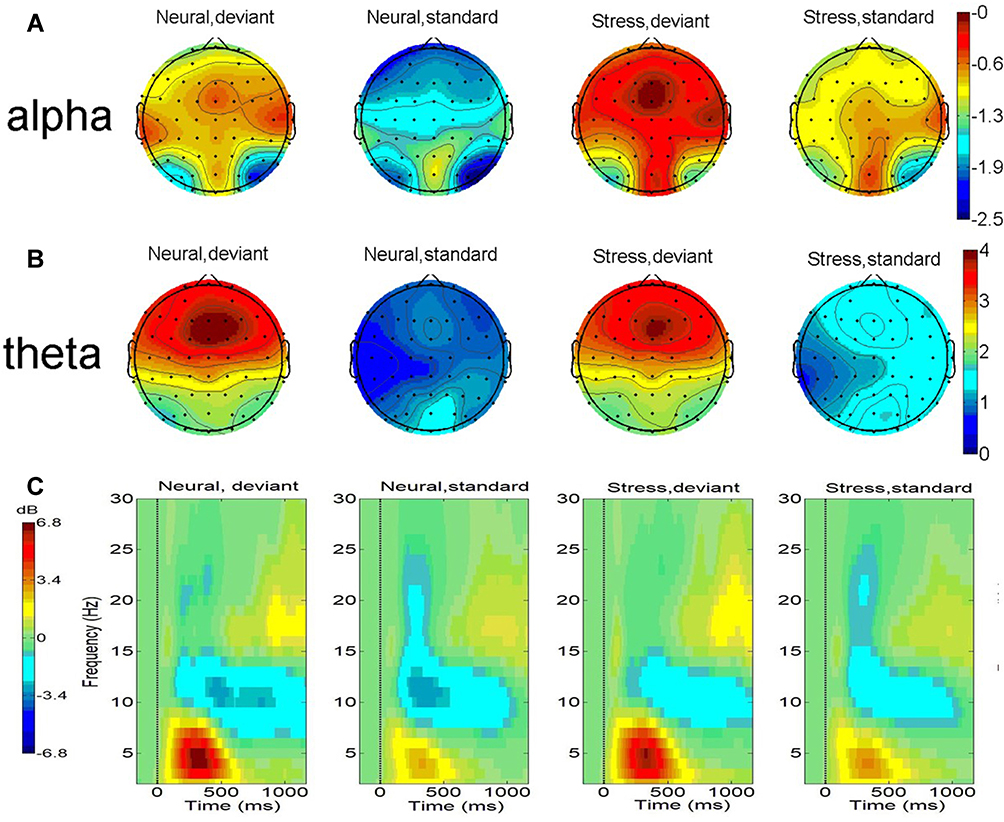 |
Figure 5 (A) Topographical maps of alpha power (dB, 8–13Hz, 100–400ms); (B) theta power (dB, 4–8Hz, 200–400ms); (C) time -frequency plots at the electrode Fz. (1) Deviant stimuli evoked smaller alpha power compared to standard stimuli and stressed states elicited smaller alpha power compared to neutral states. (2) Deviant stimuli evoked greater theta power compared to standard stimuli and standard stimuli under the stress state triggered greater theta power. |
Relation
The area under the stress curve (46.3±11.2) was negatively correlated with the response time difference [(110.8±53.3) ms] (r=−0.61, P<0.05), positively correlated with the mean power in the alpha-band [(−1.3±2.4) dB] and the mean power in the theta-band [(3.2±1.4) dB] (r=0.39, 0.48, both P< 0.05), and no statistically significant correlation with the number of errors (r=−0.14, P>0.05).
Discussion
In order to understand the direction of the effect of acute stress on behavioral inhibition, combined with the ERO technique, this paper validates the results of existing studies in terms of changes in neuronal cell potentials. The results revealed that the TSST paradigm successfully evoked the stress state in the subjects. Under the acute stress state, the RT difference between the two types of stimuli was significantly reduced and the number of response errors was remarkably lower, as well as the stress size was remarkably negatively correlated with the response time difference. However, the total reaction time was dramatically higher in the stress state than in the neutral condition. The alpha power significantly decreased and the theta band power specifically increased in the acute stress state. The correlation results showed that the area under the stress zone line was negatively correlated with the reaction time difference, and positively related to the average power in the alpha-band and the theta-band. The above results suggest that acute stress promotes behavioral inhibition in individuals.
The significant differences in subjective emotion perception scores and area under the curve between the two states indicate that the TSST paradigm was successful in evoking stress in the subjects. This result is in line with previous studies. When Dierolf et al used the TSST paradigm to evoke a stressful state in their study of the effects of acute stress on behavioral inhibition in young and older adults, they found a significant increase in negative subjective emotion scores in the stress group compared to the normal group.10 The difference in the mood at time points 1 and 8 was not significant, indicating that there was no significant effect on the subjects’ mood after the end of the experiment, in line with ethical requirements. The behavioral results showed that the number of response times and errors were significantly higher for deviant stimuli compared to standard stimuli, indicating successful behavioral inhibition elicitation. The findings are consistent with those of Wang et al,26 who found significantly lower correct rates and longer reaction times for deviant stimuli when using a two-choice Oddball paradigm to study behavioral inhibition in cybersex-addicted men. The number of errors in the stressful state and the RT difference between the two types of stimuli was significantly reduced, which is consistent with previous studies.27,28 This result suggests that the time spent on behavioral inhibition was shortened and behavioral inhibition was elevated. Notably, although the time spent on behavioral inhibition was shortened during the stressful state, the overall response time was prolonged. Researchers have suggested that the central executive system consists of three relatively independent components,29 namely, Inhibition, Shifting, and Updating. Of these, inhibition and shifting relying on the involvement of attentional control functions, and refreshing requiring the involvement of memory functions. Researchers have found that acute stress impairs meaningful memory control and working memory and memory retrieval in individuals.19,30 It is hypothesized that the time spent on refreshing increases under stress, which in turn lengthens the total reaction time. There was no significant correlation between the magnitude of stress and the number of errors, presumably because of the low sensitivity of the error count metric.6
For the alpha-band, the alpha power was significantly lower in the stress state than in the neutral state. Previous studies have suggested that the alpha-band is typically an event-related response. For example, its alpha power is significantly higher when the individual’s eyes are closed than when they are open, and that visual stimuli cause a decrease in its power value.30 For an explanation of ERD (event-related desynchronization), researchers have suggested that it can act as a manifestation of cortical activity (release of inhibition) that puts the brain into a state of arousal.31 Klimesch et al. Suggested that the alpha frequency band controls cognitive processing by suppressing task-irrelevant/competing for information or disinhibiting task-relevant information.32 This is manifested by the presence of ERD in brain regions activated in the task, while task-irrelevant and potentially competing regions show ERS (event-related synchronization). The results of the present study show a significant reduction in alpha-band power in frontal regions during the stressful state compared to the neutral state. This indicates that in the acute stress state, the subjects’ frontal regions are more active in cortical activity and the inhibitory functional areas are in an excited state. This result is consistent with the results during the reaction. It can be noted that the total reaction time is significantly higher in the stress state than in the neutral state, ie, the behavioral inhibition process is not yet completed in the stress state, and the frontal areas are still in an excited state with ERD. It has been shown that adult ADHD patients show higher power in the alpha band compared to healthy individuals, and it is suggested that this may be related to their poorer behavioral inhibition performance.33,34
For the theta-band, individuals have significantly greater theta band power in the stressful state than in the neutral state when responding to standard stimuli. Previous studies have found that the theta band in the frontal midline is often associated with cognitive control processes.17,35 Jarrod et al. Found that target conditions requiring more cognitive control elicited higher power theta activity in the frontal midline compared to control conditions.36 Wang et al. Used a two-choice Oddball task to study the behavioral inhibition of individuals at different altitudes, they found that theta power of deviant stimuli was significantly higher than that of standard stimuli, with individuals at higher altitudes requiring longer response times and electrophysiologically exhibiting lower P3 amplitude and theta power.37 The results of the present study are consistent with this, with deviant stimuli triggering higher power theta bands in the frontal midline compared to standard stimuli. The findings indicate that the theta band power was increased under stress in response to the standard stimulus, while there was no statistically significant difference between the two states in response to the deviant stimulus. The results suggest that more cognitive resources were invested in the response to the standard stimulus under stress, whereas no significant difference was found between the two states when responding to the deviant stimulus. This result is inconsistent with the findings of Matti et al. Whose study of individual cognitive abilities using a mental arithmetic task found that individuals in a stressful state had reduced frontal midline theta power21 and increased reaction times compared to the neutral condition. It is speculated that the gap may be due to different task paradigms. The two-choice Oddball task in the present study trials required only simple responses to stimuli and low cognitive resource demands. In contrast, the mental arithmetic task required constant computational processing during the trial, which was more cognitively taxing and required more cognitive resources to complete the task, leading to a decrease in the cognitive resources available to the subjects. According to the relevant description in the dual competition theory,22 when individuals are in a high-threat environment, the high threat has processing priority and will consume limited cognitive resources first, and then when the task with high trial content difficulty is processed, their cognitive resources are reduced and behavioral inhibition resources are impaired. In contrast, when the task difficulty is low and cognitive resources are sufficient, environmental threat enhances subjects’ arousal, enhances sensory sensitivity, helps to inhibit dominant responses, and promotes subjects’ response inhibition.38
In contrast to previous studies, we found disagreement in the direction of the effect of acute stress on individual behavioral inhibition. We speculate that the difference may be due to the difference between the experimental paradigm and the stress paradigm or the time difference between the stress and the experimental manipulation. In this study, compared with the go/no-go paradigm and stop-single task, which are mostly used in previous studies of behavioral inhibition, we used a two-choice Oddball task to ensure two behavioral indicators of reaction time and correctness, while reducing the interference of motor components on electrophysiological signals and improving the persuasiveness of EEG results. In addition, to reduce the decrease of stress effect caused by the time difference between stress and experimental manipulation, we adopted the operation of implementing Oddball experiment immediately after the stress state. Meanwhile, this study used ERO analysis method to understand the effects of acute stress on individual behavioral inhibition from the perspective of nerve cell potential changes, complementing the non-strictly phase-locked potential information lacking in ERP analysis. We found that the effects caused by the stress state were not the same in the face of different stimuli. Interactions emerged both at response time and theta band power. Specifically, the standard stimulus required longer reaction times and greater theta-band power in the stress state. The underlying mechanism identified in the study is to show that when individuals face dominant responses, acute stress enhances frontal area arousal by increasing theta-band power in the midline frontal area, which further increases behavioral inhibition after frontal area activation and ultimately reduces the duration of behavioral inhibition.
The present study also has certain shortcomings. In this study, only the subjective emotion rating method was used to rate the stress state. Although the subjective rating method is also a way to assess stress states and is easy to operate, there is still individual subjective bias. Therefore, objective indicators, such as heart rate and cortisol, need to be included in future studies.
Conclusion
In summary, evoked acute stress promoted the response inhibition function of individuals. Specifically, acute stress reduced response inhibition time and response error rate, decreased alpha-band power, and elevated theta-band power in college students. There was a significant negative correlation between the degree of stress and response time difference. Therefore, it is suggested that when individuals have sufficient cognitive resources, they can moderately increase tension to increase the level of physiological arousal and help improve response inhibition.
Abbreviations
ERO, event-related oscillations; SST, stop single task; RT, reaction time; TD, time-domain; TF, time-frequency; SSAI, Short State Anxiety Inventory; ERD, event-related desynchronization; ERS, event-related synchronization; TSST, Trier Social Stress Test.
Ethics Statement
This study complies with the Declaration of Helsinki and approved by Science and Technology Ethics Committee of the First Affiliated Hospital of Shihezi University School of Medicine.
Acknowledgments
This research was supported by the Graduate Education Innovation Program of Xinjiang Uygur Autonomous Region, China (XJ2022G097).
Disclosure
The authors report no conflicts of interest in this work.
References
1. Diamond A. Executive functions. Ann Rev Psychol. 2013;643(1):135–168. doi:10.1146/annurev-psych-113011-143750
2. Hughes C. Changes and challenges in 20 years of research into the development of executive functions. Infant Child Dev. 2011;20(3):251–271. doi:10.1002/icd.736
3. Bryce D, Szucs D, Soltesz F, Whitebread D. The development of inhibitory control: an averaged and single-trial Lateralized Readiness Potential study. Neuroimage. 2011;57(3):671–685. doi:10.1016/j.neuroimage.2010.12.006
4. Smith JL, Johnstone SJ, Barry RJ. Movement-related potentials in the Go/NoGo task: the P3 reflects both cognitive and motor inhibition. Clin Neurophysiol. 2008;119(3):704–714. doi:10.1016/j.clinph.2007.11.042
5. Xia L, Mo L, Wang J, Zhang W, Zhang D. Trait anxiety attenuates response inhibition: evidence from an ERP Study using the Go/NoGo Task. Front Behav Neurosci. 2020;14. doi:10.3389/fnbeh.2020.00028
6. Albert J, Lopez-Martin S, Carretie L. Emotional context modulates response inhibition: neural and behavioral data. Neuroimage. 2010;49(1):914–921. doi:10.1016/j.neuroimage.2009.08.045
7. Yuan Jiajin XM, Jemin Y, Hong L. Application of the two-choice Oddball paradigm to the study of behavioral inhibition control. Sci China Life Sci. 2017;47(10):1065–1073.
8. Farbiash T, Berger A. Brain and behavioral inhibitory control of kindergartners facing negative emotions. Dev Sci. 2016;19(5):741–756. doi:10.1111/desc.12330
9. Qi M, Gao H, Liu G. Effect of acute psychological stress on response inhibition: an event-related potential study. Behav Brain Res. 2017;323:32–37. doi:10.1016/j.bbr.2017.01.036
10. Dierolf AM, Schoofs D, Hessas EM, et al. Good to be stressed? Improved response inhibition and error processing after acute stress in young and older men. Neuropsychologia. 2018;119:434–447. doi:10.1016/j.neuropsychologia.2018.08.020
11. Roos LE, Knight EL, Beauchamp KG, et al. Acute stress impairs inhibitory control based on individual differences in parasympathetic nervous system activity. Biol Psychol. 2017;125:58–63. doi:10.1016/j.biopsycho.2017.03.004
12. Jiang C, Rau PP. The detrimental effect of acute stress on response inhibition when exposed to acute stress: an event-related potential analysis. Neuroreport. 2017;28(14):922–928. doi:10.1097/WNR.0000000000000859
13. Kofman O, Meiran N, Greenberg E, Balas M, Cohen H. Enhanced performance on executive functions associated with examination stress: evidence from task-switching and Stroop paradigms. Cogn Emot. 2006;20(5):577–595. doi:10.1080/02699930500270913
14. Hu K, Bauer A, Padmala S, Pessoa L. Threat of bodily harm has opposing effects on cognition. Emotion. 2012;12(1):28. doi:10.1037/a0024345
15. Harper J, Malone SM, Bachman MD, Bernat EM. Stimulus sequence context differentially modulates inhibition-related theta and delta band activity in a go/no-go task. Psychophysiology. 2016;53(5):712–722. doi:10.1111/psyp.12604
16. Klimesch W, Doppelmayr M, Röhm D, Pöllhuber D, Stadler W. Simultaneous desynchronization and synchronization of different alpha responses in the human electroencephalograph: a neglected paradox? Neurosci Lett. 2000;284(1):97–100. doi:10.1016/S0304-3940(00)00985-X
17. Cavanagh JF, Zambrano-Vazquez L, Allen JJB. Theta lingua franca: a common mid-frontal substrate for action monitoring processes. Psychophysiology. 2012;49(2):220–238. doi:10.1111/j.1469-8986.2011.01293.x
18. Cohen MX, Cavanagh JF. Single-trial regression elucidates the role of prefrontal theta oscillations in response conflict. Front Psychol. 2011;2:30. doi:10.3389/fpsyg.2011.00030
19. Quaedflieg C, Schneider TR, Daume J, Engel AK, Schwabe L. Stress impairs intentional memory control through altered theta oscillations in Lateral Parietal Cortex. J Neurosci. 2020;40(40):7739–7748. doi:10.1523/JNEUROSCI.2906-19.2020
20. Gärtner M, Grimm S, Bajbouj M. Frontal midline theta oscillations during mental arithmetic: effects of stress. Front Behav Neurosci. 2015;9. doi:10.3389/fnbeh.2015.00096
21. von Dawans B, Trueg A, Voncken M, et al. Empathy modulates the effects of acute stress on anxious appearance and social behavior in social anxiety disorder. Front Psychiatry. 2022;13. doi:10.3389/fpsyt.2022.875750
22. Baumeister RF, Bratslavsky E, Muraven M, Tice DM. Ego depletion: is the active self a limited resource. J Pers Soc Psychol. 1998;74(5):1252–1265. doi:10.1037/0022-3514.74.5.1252
23. Dai X. Handbook of Common Psychological Assessment Scales. Beijing: People’s Military Medical Publishing House; 2014.
24. Jackson-Koku G. Beck Depression Inventory. Occup Med. 2016;66(2):174–175. doi:10.1093/occmed/kqv087
25. Marteau TM, Bekker H. The development of a six-item short-form of the state scale of the Spielberger State—Trait Anxiety Inventory (STAI). Br J Clin Psychol. 1992;31(3):301–306. doi:10.1111/j.2044-8260.1992.tb00997.x
26. Wang J, Dai B. Event-related potentials in a two-choice oddball task of impaired behavioral inhibitory control among males with tendencies towards cybersex addiction. J Behav Addict. 2020;9(3):785–796. doi:10.1556/2006.2020.00059
27. Grillon C, Robinson OJ, O’Connell K, et al. Clinical anxiety promotes excessive response inhibition. Psychol Med. 2017;47(3):484–494. doi:10.1017/S0033291716002555
28. Pessoa L, Padmala S, Kenzer A, Bauer A. Interactions between cognition and emotion during response inhibition. Emotion. 2012;12(1):192–197. doi:10.1037/a0024109
29. Nigg JT. On inhibition/disinhibition in developmental psychopathology: views from cognitive and personality psychology and a working inhibition taxonomy. Psychol Bull. 2000;126(2):220. doi:10.1037/0033-2909.126.2.220
30. Quesada AA, Wiemers US, Schoofs D, Wolf OT. Psychosocial stress exposure impairs memory retrieval in children. Psychoneuroendocrinology. 2012;37(1):125–136. doi:10.1016/j.psyneuen.2011.05.013
31. Woertz M, Pfurtscheller G, Klimesch W. Alpha power dependent light stimulation: dynamics of event-related (de) synchronization in human electroencephalogram. Cogn Brain Res. 2004;20(2):256–260. doi:10.1016/j.cogbrainres.2004.03.014
32. Klimesch W, Sauseng P, Hanslmayr S. EEG alpha oscillations: the inhibition–timing hypothesis. Brain Res Rev. 2007;53(1):63–88. doi:10.1016/j.brainresrev.2006.06.003
33. Deiber MP, Hasler R, Colin J, et al. Linking alpha oscillations, attention and inhibitory control in adult ADHD with EEG neurofeedback. Neuroimage Clin. 2020;25(102145):102145. doi:10.1016/j.nicl.2019.102145
34. Poil SS, Bollmann S, Ghisleni C, O’Gorman RL, Klaver P, Ball J. Age dependent electroencephalographic changes in attention-deficit/hyperactivity disorder (ADHD). Clin Neurophysiol. 2014;125(8):1626–1638. doi:10.1016/j.clinph.2013.12.118
35. Cavanagh JF, Frank MJ. Frontal theta as a mechanism for cognitive control. Trends Cogn Sci. 2014;18(8):414–421. doi:10.1016/j.tics.2014.04.012
36. Eisma J, Rawls E, Long S, Mach R, Lamm C. Frontal midline theta differentiates separate cognitive control strategies while still generalizing the need for cognitive control. Sci Rep. 2021;11(1). doi:10.1038/s41598-021-94162-z
37. Wang J, Zheng L, Wang Z, et al. Alteration of behavioral inhibitory control in high-altitude immigrants. Front Behav Neurosci. 2021;15:712278. doi:10.3389/fnbeh.2021.712278
38. Pessoa L. How do emotion and motivation direct executive control? Trends Cogn Sci. 2009;13(4):160–166. doi:10.1016/j.tics.2009.01.006
 © 2022 The Author(s). This work is published and licensed by Dove Medical Press Limited. The
full terms of this license are available at https://www.dovepress.com/terms
and incorporate the Creative Commons Attribution
- Non Commercial (unported, 3.0) License.
By accessing the work you hereby accept the Terms. Non-commercial uses of the work are permitted
without any further permission from Dove Medical Press Limited, provided the work is properly
attributed. For permission for commercial use of this work, please see paragraphs 4.2 and 5 of our Terms.
© 2022 The Author(s). This work is published and licensed by Dove Medical Press Limited. The
full terms of this license are available at https://www.dovepress.com/terms
and incorporate the Creative Commons Attribution
- Non Commercial (unported, 3.0) License.
By accessing the work you hereby accept the Terms. Non-commercial uses of the work are permitted
without any further permission from Dove Medical Press Limited, provided the work is properly
attributed. For permission for commercial use of this work, please see paragraphs 4.2 and 5 of our Terms.