Back to Archived Journals » Comparative Effectiveness Research » Volume 6
Evidence-based research: understanding the best estimate
Authors Bauer J, Spackman S, Fritz R, Bains A, Jetton-Rangel J
Received 1 June 2016
Accepted for publication 4 July 2016
Published 7 September 2016 Volume 2016:6 Pages 23—31
DOI https://doi.org/10.2147/CER.S114035
Checked for plagiarism Yes
Review by Single anonymous peer review
Peer reviewer comments 3
Editor who approved publication: Professor Francesco Chiappelli
Janet G Bauer,1 Sue S Spackman,2 Robert Fritz,2 Amanjyot K Bains,3 Jeanette Jetton-Rangel3
1Advanced Education Services, 2Division of General Dentistry, 3Center of Dental Research, Loma Linda University School of Dentistry, Loma Linda, CA, USA
Introduction: Best estimates of intervention outcomes are used when uncertainties in decision making are evidenced. Best estimates are often, out of necessity, from a context of less than quality evidence or needing more evidence to provide accuracy.
Purpose: The purpose of this article is to understand the best estimate behavior, so that clinicians and patients may have confidence in its quantification and validation.
Methods: To discover best estimates and quantify uncertainty, critical appraisals of the literature, gray literature and its resources, or both are accomplished. Best estimates of pairwise comparisons are calculated using meta-analytic methods; multiple comparisons use network meta-analysis. Manufacturers provide margins of performance of proprietary material(s). Lower margin performance thresholds or requirements (functional failure) of materials are determined by a distribution of tests to quantify performance or clinical competency. The same is done for the high margin performance thresholds (estimated true value of success) and clinician-derived critical values (material failure to function clinically). This quantification of margins and uncertainties assists clinicians in determining if reported best estimates are progressing toward true value as new knowledge is reported.
Analysis: The best estimate of outcomes focuses on evidence-centered care. In stochastic environments, we are not able to observe all events in all situations to know without uncertainty the best estimates of predictable outcomes. Point-in-time analyses of best estimates using quantification of margins and uncertainties do this.
Conclusion: While study design and methodology are variables known to validate the quality of evidence from which best estimates are acquired, missing are tolerance margins, or upper and lower performance requirements and clinician critical values, within which best estimates behave and are validated. Understanding the best estimate behavior toward true value may provide clinicians and patients confidence in decision making under uncertainty.
Keywords: metric, outcomes, quantification of margins and uncertainties, true value, performance margins
Introduction
One goal of evidence-based dentistry is to provide clinicians and patients with best evidence or best estimates of intervention outcomes that are directed to uncertainties in decision making when developing personal oral health care plans. These plans are comprehensive based on outcomes that allow for decision making to include service options regarding the whole person: the physical, behavioral, social, and spiritual well-being, not just disease, morbidities, and mortality. Best estimates are usually focused on decision data, augmented with clinician’s expertise and experience within informed consent. However, a common complaint of clinicians is that best estimates are often, out of necessity, from a context of less than quality evidence or needing more evidence to provide accuracy. In lieu of nothing, clinicians also desire an outcome estimate even if it is not a best estimate to provide a context with which to do shared decision making within informed consent. Yet, clinicians need to translate to patients the confidence that can be attributed to any outcome estimate discussed.
Purpose
The purpose of this article is to understand the best estimate behavior, so that clinicians and patients may have confidence in its quantification and validation. While study design and methodology are variables known to validate the quality of evidence from which best estimates are acquired, missing are tolerance margins, or upper performance requirement (UPR) and lower performance requirement (LPR), within which best estimates behave and are validated. Given this context, clinicians may be able to judge at one point in time the performance of the outcome (competency in clinical applications) of a subject of interest against the manufacturer’s performance requirements or, in its stead, clinician’s expertise and experience from systematic reviews.
Methods
Decision data
Decision data are the effectiveness of outcomes selected for the PICOTS template at time of query when comparing one intervention with its comparison. Each outcome measure or metric may be provided as risk ratios (RRs), odds ratios (ORs), or probabilities (%), and less often, number needed to treat. For example, medical clinicians may be more comfortable speaking about outcomes in terms of OR or RR and dental clinicians in terms of probabilities. Whichever is preferred, these measures are interchangeable.
However, Gigerenzer et al1 make the case for statistical illiteracy as follows: “widespread inability to understand the meaning of numbers [and that statistical illiteracy] is common to patient, journalists, and physicians.” Without a clear understanding of the numbers, each may be manipulated into nonintended interpretations that may also undermine informed consent and shared decision making. Rather, reports of statistical findings fundamentally need to be reported at a “minimal statistical literacy” level where absolute measures dominate over relative measures.
Efforts by Consolidated Standards of Reporting Trials (CONSORT), TREND, and STROBE have recommended studies that report findings in absolute as well as relative effect measures (for example, RR, OR, and percentage).2 Their reasons are that relative measures may allow for misinterpretation of the magnitude, direction, and estimation and interpretation of outcomes, especially in comparison with other studies.3 Absolute measures have the advantage of reporting the sample size, the size of the sample that shows the effect of the outcome, and the size of the sample that does not show the effect of the outcome. From these data, relative effect measures may be chosen and calculated by readers, researchers, or both and reported along with the absolute measures.4
Best estimate
In evidence-based research, a best estimate is a quantification of many observable events, but not all events, of an outcome regarding a subject of interest, along with quantification of that portion of unknown knowledge explainable as uncertainty or error in measurement. Thus, knowledge about a subject of interest is epidemiological (observational) and not epistemological (causation). In stochastic environment, we are not able to observe all events in all situations to know without uncertainty a subject of interest and its predictable outcomes. To discover best estimates and quantify uncertainty, critical appraisals of the literature, gray literature and its resources, or both are accomplished using primary source articles, or primary source systematic review (PSSR), and systematic reviews of PSSRs, or clinically relevant, complex systematic reviews.5 Thus, best estimates of outcomes focus on evidence-centered care; it is all about the evidence and decision making and not engaging providers or patients. This engagement comes later in the whole dynamic of understanding a clinical practice guideline.
Gathering evidence
In the 1970s, A Cochrane advocated for critical summaries of randomized controlled trials to support clinical decision making.6 Randomized (triple-blinded) clinical trials with allocation concealment, follow-up, and peer-review consensus are considered the consensual gold standard for clinical trials, superior to any other study design in studying intervention causation. A randomized clinical trial (RCT) is an experiment that may prove causation and, therefore, is most important to clinical practice. It is, then, of the highest importance that reporting of RCTs be standardized. This gold standard is called “rational therapeutics”7 and is qualified by: CONSORT, QUOROM, and STARD (Agency),8 with CONSORT and consensus statements of these standards being most recommended.9
RCTs are not all equal in their quality of evidence; some are stronger, and others are weaker. Evidence-based research, then, is concerned with the validity and reliability of the evidence. The validity of the evidence lies in the precision and accuracy of the measuring instrument or scale and its calibration. So the reviewer of the study ought to consider the measuring instrument as to its “true to value” with other such measuring instruments, its ability to predict an outcome, and its ability to measure what it was intended to measure. Reliability concerns how confident the reviewer can be that the findings of the clinical trial will reproduce the same or similar results in other trials.
Many instruments have been developed to assess reliability and validity of the evidence. From the archives of the Agency for Healthcare Research and Quality, 19 historical assessment instruments were identified. In use, the Jadad,10 Timmer (for assessing abstracts),11 Amstar12 and its revision and validation, R-AMSTAR,13 PRISMA,14 and GRADE15 assessments arose. GRADE and its expansion and validation Ex-GRADE16 have become the most prominent with their consensual acceptance as standard use in systematic reviews by the Cochrane Collaboration. GRADE assesses clinical trials from the highest confidence in quality of evidence to the lowest. In comparison with the consensual gold standard, all other trials are either equal or downgraded.
The importance of all scales lies in quality evidence produced from studies or study designs that may or may not control for bias. In observational studies, unlike RCTs, the population sample may be large, making results more generalizable with large magnitudes of effect. They provide a look into reality and practice. With this, however, biases, such as selection bias, not accounting for attrition, and confounding bias, arise as there are no controls or randomization of subjects into experimental categories. Clinical trials may suffer from these biases as well; however, proper assumptions and modeling may reduce these biases producing higher levels of confidence in results.5 The criteria used to perform assessments are categorized into downgrades of quality based on
- Limitations in the design and implementation;
- Indirectness of evidence;
- Unexplained heterogeneity or inconsistency of results;
- Imprecision of results;
- High probability of publication bias.
Strength of evidence
Once ratings are achieved, these can be used to establish the strength of the evidence or recommendation. However, there is controversy regarding using summary ratings from scales (to render summary scores) or checklists that provide insight into the quality of evidence in studies. Cochrane Collaboration uses checklists as found in GRADE. The difference is that scoring the evidence is simpler and may fit technologies to facilitate simulated annealing or data analytics. Cochrane Collaboration,17 however, dispels this as lacking in transparency. As a behavior, transparency allows for open reviews that communicate in descriptive terms how evidence meets each specific criterion and for evaluators to account for accuracy in the review. For technology to mimic this process, natural language processing, while relatively new, may lend assistance to automation in review assessments. Once quality of the evidence has been established, then the best estimate of an outcome may be determined.
Analysis
Used as the query structure for systematic reviews, the PICOTS input template (Figure 1) allows for pairwise comparisons of intervention options based on an outcome measure. In the PICOTS template, “P” or population is the attributes (demographics, medical and dental conditions, socioeconomic factors, etc) of the individual patient, “I” or primary intervention (PI) concerns the uncertainty for which the query is being initiated, “C” or comparison intervention (CI) is a known intervention, “O” or outcome is the outcome measure that is used to study the comparison between the two interventions (options), “T” or time is the time interval for which the outcome is valid (immediate, 1 year, 2 years, etc), and “S” or setting is the practice venue within which the outcome performance is studied; settings may include community practice, clinics, nursing homes, hospitals, etc. Thus, this structure queries for and acquires best evidence, one intervention of a subject of interest compared to another measured at one point in time and inclusive of the stated patient characteristics for which the two interventions are studied. The outcome is a measure, given in absolute or relative values. This measure specifies the effectiveness of one option compared to another option in determining best therapies, regimens, and accommodations, as well as equipment, devices, and disposables. Thus, the PICOTS template will provide criteria, termed inclusion criteria, to perform the search of the professional literature for quality studies whose estimates of effectiveness may be unified into one best estimate that professionals and patients may use to compare treatment or purchase options in defining personal oral health care plans or products that will improve performance effectiveness.
 | Figure 1 PICOTS template. Note: Example of a template in which to input a query based on the clinical question. |
Why pairwise comparisons? Usually this is how the evidence is matched in studies acquired through a search of the professional literature. Pairwise comparisons (Figure 2) of the PI and CI are defined as direct comparisons. Some studies do multiple comparisons, comparing more than two options along with the PI and CI for the same outcome measure. However, queries for these types of studies relevant to the query or clinical question are few. In other words, clinicians may wish to query for multiple comparisons using an outcome measure but be restricted in finding the relevant information. The PICOTS template restricts clinicians to only two comparisons. The literature may not provide the requested multiple comparisons for an outcome measure; instead, the literature may provide only two comparisons at a time for the selection of multiple comparisons queried for in different articles. Thus, direct comparisons of more than two interventions studying the same outcome measure may be hard to find. Regardless, data exist to make and quantify multiple comparisons, albeit two at a time and based on any one outcome measure. This is the usual case when searching the literature. Let us take a Cochrane Oral Health Group Review regarding the subject of interest, “Tooth-colored resin fillings compared with amalgam fillings for permanent teeth at the back of the mouth.”18
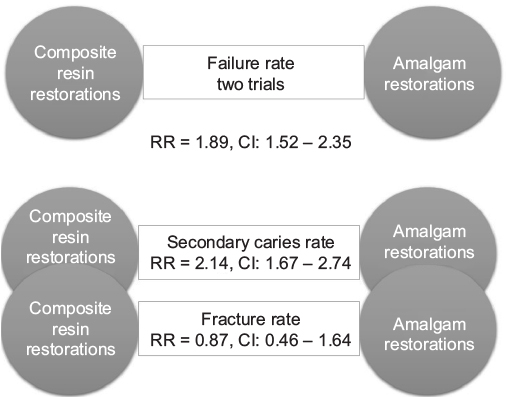 | Figure 2 Direct pairwise comparisons. Notes: Direct pairwise comparisons provide direct or head-to-head comparisons of intervention outcomes and primary and comparison interventions, based on an outcome metric. The geometry or network of these comparisons displays the directions of the comparison with its best estimate. Evidence was gathered from trials that compared these two interventions queried for the outcome, failure rate. Other outcomes would have been queried separately using another outcome metric and are secondary to the primary outcome for which the query was made. Abbreviations: RR, risk ratio; CI, confidence interval. |
The review addressed the failure rate of composite resin compared to amalgam restorations in permanent posterior teeth, in service for a minimum of 3 years (the “T” in the PICOTS template). This was the clinical question inputted into the PICOTS template. The search bibliome included 2,205 references of which ten articles were selected, but only two of the seven clinical trials were determined “quality studies” and unified to provide a best estimate of the studied outcome measure, failure rate, used for the subsequent clinical practice guideline. It would appear from the review that trials were rejected because of their lack of similarity in study design; however, all had a high risk of bias. Thus, the evidence left to quantify a best estimate was for 921 children having permanent posterior teeth. Findings were reported as relative RRs, a relative value not an absolute value. The report suggested that composite resin restorations had significantly higher rates of failure, lower success rate, than amalgam restorations, RR =1.89 with a 95% confidence interval of 1.52–2.35.
Best estimates of pairwise comparisons are calculated using meta-analytic methods because most evidence found to match clinical queries occurs in direct, pairwise comparisons; when found, multiple comparisons use network meta-analysis (NMA).19 NMA brings together the estimates of outcome measures reported using direct comparisons (the two specified in the PICOTS template) and combines them with the estimates of outcome measures reported as indirect comparisons. Indirect comparisons are comparisons of either the PI or CI compared with some other interventions that were studied using the same outcome measure. For the Cochrane example, the meaning of indirect comparisons is that “quality” articles may have found amalgam comparisons with glass ionomer restorations using the same outcome measure of success rate; in addition, it could mean that other comparisons were found that included direct filling gold, cast gold, and porcelain restorations. Similarly, quality articles may have found similar comparisons for composite restorations. The method to visualize and make sense of these multiple comparisons is to pictorially represent the comparisons in a network, so that every comparison may be visualized within a then developed network. A unified analysis is performed to determine the best estimate from all the comparisons.20 For the aforementioned example, the search bibliome to form a Best Case Series for the analysis may have included trials that compared amalgam or composite restorations to glass ionomer restorations, for example, with the outcome measure of success rate.
The Baldwin network (Figure 3) is a simple three-node depiction of the evidence in the Cochrane Best Case Series bibliome, given that comparisons with glass ionomer restorations were also included in the analysis. This, then, is made available for an NMA. First, the geometry is evaluated for its nodes: which nodes have direct comparison evidence and which nodes have indirect comparison evidence. Visualizing this network, the graph shows more comparison data between glass ionomer restorations and amalgam (n=8). Thus, data contributing to a best estimate from these comparisons are said to be well represented. This is followed by composite restorations (n=5) that are said to be less represented, followed by direct comparisons between amalgam and composite restorations that are least represented. Overall, there are 15 possible comparisons that can be made between the three restorative treatment options the outcome of which is success rate. It is possible, then, that more data exist to quantify a best estimate using NMA. However, there are statistical assumptions that need to be considered to support confidence that the best estimate from the 15 possible comparisons is robust enough to be called “best estimate”. Indirect comparisons may affect the strength of the network as a whole, its power, and reliability in the overall analysis. If we included other trials that were excluded in the Cochrane systematic review, the whole network may have had more comparisons but with heterogeneity and statistical incoherence issues that are criteria important to calculating and having confidence in the best estimate. So the inclusion or exclusion of multiple comparisons would depend on the network as to whether it makes sense to include all selected evidence or the results need to be interpreted with caution, a similar conclusion the reviewers reached for their direct, pairwise comparison in the Cochrane review. With pairwise meta-analysis, there are two models by which one can have confidence in the estimate produced. The fixed effect model assumes that no heterogeneity exists, whereas the random effects model assumes unexplained heterogeneity, as occurs in indirect comparisons, and thus is the more common choice. This is true for NMA.
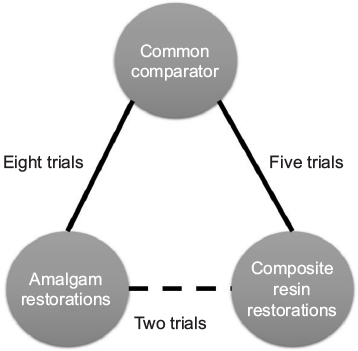 | Figure 3 Network meta-analysis: Baldwin geometric network. Notes: Network meta-analysis regards multiple comparisons that are combined in a unified analysis. These comparisons include the direct type that allows estimates of head-to-head comparisons, with the indirect type, ones with estimates that are acquired through indirect comparisons. In other words, the unified analysis includes estimates of all interventions queried, even though some have never been compared head to head. |
Reducible uncertainty
For past knowledge, PSSRs or clinically relevant, comprehensive systematic reviews are tools used in acquiring best estimate of outcome measures for competing intervention options and their uncertainty. This may also apply to primary source articles used in the PSSR. However, how do evidence-based researchers and clinicians know when best estimates are close to true value? For example, we are looking at a composite resin restorative material to develop clinical practice guidelines for expected performance using a point-in-time analysis. There may be several points in time that we would want to look at for different reasons: at placement to provide clinicians with estimates as to procedural competency, at subsequent restorative performance over a given duration, and up to and when failure of the restoration is expected to give material competency. So let us look at one of these points, that is, selecting the Cochrane Oral Health Group Review 3-year subsequent to placement for its intuitive ease in explanation. To begin, let us say all studies tested marginal fracture as the variable for survival rate.
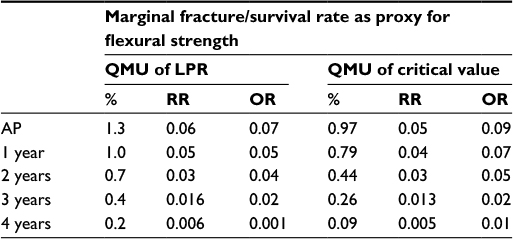
Manufacturers provide the margins of performance of their materials, in this case a composite resin restorative material and its marginal fracture performance competency. The LPR of the material is determined by a distribution of tests to quantify its performance at functional failure. The survival effect, effect size estimate of each sample, is averaged across the numerous test samples to provide a mean, distribution, and standard error with the assumption that all samples are taken from the population and are normally distributed. The same is done for the UPR. Figure 4 displays the margins (LPR and UPR), best estimates of these margins (15% and 40%, LPR and UPR, respectively), and best estimate of the composite resin restorative material (30%) acquired from PICOTS query and subsequent systematic review methodology. Also shown is the range of uncertainty of the acquired best estimate from UPR. Thus, for performance in practice, clinicians may observe that the best estimate from this point-in-time analysis is nearing true value in comparison with LPR, material failure. Table 1 is an example of this type of supplied information.
 | Figure 4 Best estimate behavior. Notes: This display is of the margins or thresholds of the best estimate in calculating its behavior toward true value. This behavior is computed from best evidence acquired at one point in time. With increases in knowledge, this best estimate is updated to demonstrate a change in behavior due to new knowledge possibly improving the outcome estimate of a subject of interest. Abbreviations: LPR, lower performance requirement; UPR, upper performance requirement. |
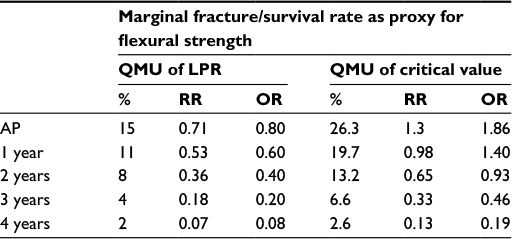 | Table 1 Manufacturer margins of proprietary material(s) Notes: Manufacturers provide UPRs and LPRs for their proprietary materials. Critical values are obtained from the literature. For example, a manufacturer has provided the estimates, %, RR, and OR for its composite material. The QMU has been calculated for each estimate type that was provided. If we look at 3-year estimates for the example in the text and its RR estimates, then the QMU for the LPR would be 0.18 and the QMU of the critical value is 0.33. So from this table, the QMU of the best estimate would be compared as to its value being the same as LPR, critical value, somewhere in between, or greater than both. Abbreviations: AP, at placement; LPRs, lower performance requirements; OR, odds ratios; QMU, quantification of margins and uncertainties; RR, risk ratio; UPRs, upper performance requirements. |
The critical value (CV) is the value at which clinicians have established as failure to function clinically, and replacement is the treatment option. On clinical assessment, this value is the clinician diagnosis of failure not the manufacturer’s LPR at the time of material failure. Thus, CV is reported as mean and standard deviation. For this composite resin restorative material, RRs are calculated for success rate of the composite restorative material. The “manufacturer” of the material specifies that the UPR is RR =2.28 and the LPR is RR =0.18 at 3 years. The CV at which the clinician will declare unacceptable performance is RR =0.33; any value below RR =0.33 will always be judged clinically unacceptable and restorations ordered replaced by the clinician. This value is its clinician-determined specification of least acceptable.
Researchers, however, require an additional step to provide clinicians confidence that these values are indeed significantly different from LPR. This is done by quantification of margins and uncertainties (QMU) that best estimates are progressing toward true value with additional clinical testing, or performance of this composite resin restorative material in practice, material competency.
Discussion
Point-in-time analysis of QMU21 is based on the calculation of a k-factor, that is, defined as margin divided by uncertainty in a study population regarding an outcome metric (Figure 5). Thus, the k-factor is the population mean (µ) minus LPR divided by the population variance. Since researchers estimate the population mean from study samples, the estimate of the k-factor is the mean of study samples ( ) minus LPR divided by standard deviation (s) of the study samples (Figure 6).
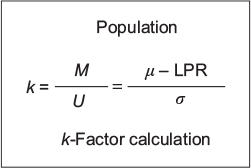 | Figure 5 Formula for quantification of margins and uncertainties: k-factor calculation for a population. Notes: Calculation of k-factor is defined as margin (M) divided by uncertainty (U) in a study population regarding an outcome metric. Thus, the k-factor is the population mean (μ) minus LPR (M) divided by the population variance (U). Abbreviation: LPR, lower performance requirement. |
 | Figure 6 Formula for quantification of margins and uncertainties: k-factor calculation for a sample. Notes: Calculation of k^-factor is defined as margin (M^) divided by uncertainty (U^) in a study population regarding an outcome metric. Thus, the estimate of the k^-factor is the mean of study samples ( Abbreviation: LPR, lower performance requirement. |
 ) minus LPR divided by standard deviation (s) of the study samples.
With QMU of the LPR and UPR, as well as the best estimate from the systematic review, researchers may demonstrate that the QMU best estimate is separate (significantly different) from the distribution of LPR (Figure 7), or is part (not significantly different) from the distribution of LPR (Figure 8). If significantly different, then the best estimate is at a performance greater than LPR. This can all be stated by using this one number (QMU) with which clinician may have confidence in the reported best estimate acquired from systematic reviews. For example, if our illustrative data were real data using the outcome of success rate, then we would calculate the QMU for the LPR, CV, Cochrane sample estimate, and the UPR. The result, then, demonstrates that the Cochrane sample’s distribution is not a part of the distribution of LPR and CV (Table 2): QMU for Cochrane best estimate (margin - LPR) is 0.103, that is:
- Greater than QMU LPR (QMU =0.016),
- Greater than QMU CV (QMU =0.013).
 | Figure 7 QMU: significant differences between estimates. Notes: QMU evaluates reduction of the uncertainty when new knowledge updates the best estimate. QMU also provides confidence that best estimate is significantly different from LPR. Abbreviations: LPR, lower performance requirement; QMU, quantification of margins and uncertainties; UPR, upper performance requirement. |
 | Figure 8 QMU: no significant difference between LPR and best estimate. Notes: QMU evaluates reduction of the uncertainty when new knowledge updates the best estimate. QMU also provides confidence that best estimate is not significantly different from LPR. Abbreviations: LPR, lower performance requirement; QMU, quantification of margins and uncertainties. |
 | Table 2 Quantification of margins and uncertainties Notes: The QMU for the Cochrane best estimate (0.103) has been calculated against LPR (0.106) and critical value (0.013). The results show that it is greater than LPR and critical value. Therefore, Cochrane best estimate demonstrates a better performance competency compared to LPR and critical value. However, when compared to UPR (0.20), QMU Cochrane best estimate (0.34) is less than UPR. Thus, Cochrane best estimates is less than UPR and its performance competency lies somewhere between critical value and UPR, all at 3-year service duration. Abbreviations: AP, at placement; LPR, lower performance requirement; OR, odds ratios; QMU, quantification of margins and uncertainties; RR, risk ratio; UPR, upper performance requirement. |
Also the Cochrane sample’s distribution QMU (UPR - margin) is 0.034 determined from its calculation against UPR distribution, or true value of competency of the material at its UPR. Thus, the reported best estimate QMU is less than QMU UPR (0.20). The clinician, then, may state that the reported best estimate is not a part of the distribution of UPR. The clinician’s conclusion is that the acquired best estimate stands alone as not a part of LPR, CV, or UPR, but with current best knowledge reported lies at an optimum point somewhere between UPR and CV. Thus, the material has clinical competence in restoring carious dental lesions because its 3-year performance lies somewhere between least acceptable performance and true value. Again, if QMU of the material is higher, then there is confidence that the new estimate acquired from the systematic review is better, or material competency is better, than comparison with the LPR; if QMU of the material is lower, the material has lesser performance competency than its other comparison requirements. Acceptable QMUs established for each point-in-time analysis would be useful in developing a simple strength of recommendation scale (as in systematic reviews) for clinicians in determining material competency (in this case). It also serves to assist clinicians in comparing previously reported best estimates of competency compared to newly reported best estimates in the light of new knowledge, truly an improvement in clinician decision making as to competency performance of a subject of interest involved in clinical decision making.
Once clinical competency has been determined at a point-in-time analysis and demonstrated no change in QMU with newly reported knowledge, then best estimates of outcomes become “insensitive” to any remaining uncertainty. With that level of achievement, the estimate is said to be robust,22 or the best possible estimate that can be obtained within the metric threshold limits. Thus, data validation has reached a level of estimation of the causal probability of performance competency. The steady state may be interpreted as having developed the probability of a standard of care, a decision that approximates the certainty of knowledge of the best achievable estimate of an intervention’s outcome metric at one point in time. In summary, the estimate that is present for implementation in clinical decision making meets the following requirements:
- Within informed consent, patients and their clinicians discover uncertainties regarding emerging personal health care plans.
- Systematic reviews provide validated estimates of dental regimens, therapies, treatments, and service delivery equipment and supplies albeit 2 at a time for any given outcome measure.
- Clinicians provide patients with estimates derived from systematic reviews regarding outcomes of oral health services and delivery systems that may address uncertainties in personal health care plans. These estimates provide confidence in the validity of the estimate.
- QMU is made by manufacturers of dental regimens, therapies, treatments, and service delivery equipment and supplies at points in time over the performance competency of the product.
- Clinicians use these QMUs to explain the meaning of the systematic, validated estimates to patients.
- Patients and clinicians may then understand if the estimate provided describes a service or delivery system that is, at one point in time, performing excellently, poorly, or at some CV of clinical acceptance or at some optimal level in between.
Conclusion
Understanding the best estimate of outcomes given various intervention options regarding a subject of interest begins with data, or best evidence acquired through systematic review. These are decision data about the effectiveness of treatments, therapies, regimens, and accommodations, as well as equipment, devices, and disposables. For decision making, pairwise comparisons are used to provide the context of the best estimate of an outcome because this is how the evidence is queried for in the PICOTS template and matched in studies. Thus, clinicians compare a PI with a CI using meta-analysis. Recent innovations allow clinicians to make multiple comparisons using NMA. Here, geometric networks are constructed with both direct and indirect comparison data, so that the best estimate of an outcome is estimated for more than one CI, or for example, several treatment options. Thus, decision making is enhanced. However, clinicians and patients need to have confidence that these best estimates are nearing the true value estimate as knowledge improves. To test this behavior, reduction in uncertainty of the best estimate needs to be tested against its thresholds. This reduction in uncertainty is quantified by the k-factor of QMU, the QMU, and provides at a given level of confidence that the best estimate is significantly different (or not) from a lower or higher performance requirement and clinical acceptance of functional ability, overall, determining clinical competency of interventions for decision making. Once quantified for an acceptable range that demonstrates a steady state, the best estimate may have attained standard of care that approximates the certainty of knowledge for a subject of interest.
Disclosure
The authors report no conflicts of interest in this work.
References
Gigerenzer G, Gaissmaier W, Kurz-Mileke E, Schwartz LM, Woloshin S. Helping doctors and patients make sense of health statistics. Psychol Sci Public Interest. 2008;8(2):53–96. | ||
Lang TA, Altman DG [webpage on the Internet]. Basic statistical reporting for articles published in clinical medical journals: the SAMPL guidelines. In: Smar P, Maisonneuve H, Polderman A, editors. Science Editors’ Handbook, European Association of Science Editors. 2013. Available from: http://www.equator-network.org/2013/03/20/basic-statistical-reporting-for-articles-published-in-biomedical-journals-the-statistical-analyses-and-methods-in-the-published-literature-or-the-sampl-guidelines/. Accessed June 22, 2016. | ||
King NB, Harper S, Young ME. Use of relative and absolute effect measures in reporting health inequalities: structured review. BMJ. 2012;345:e5774. | ||
Dryver E, Hux JE. Reporting of numerical and statistical differences in abstracts. J Gen Intern Med. 2002;17(3):203–206. | ||
Chiappelli F. Fundamentals of Evidence-based Health Care and Translational Science. Heidelberg: Springer–Verlag; 2014. | ||
Dollery CT. Constructive attack. Effectiveness and efficiency. Random reflections on health services. Book reviews. BMJ. 1972;2(5804):56. | ||
Meldrum ML. A brief history of the randomized controlled trial. From oranges and lemons to the gold standard. Hematol Oncol Clin North Am. 2000;14(4):745–760. | ||
West S, King V, Carey TS, et al [webpage on the Internet]. Systems to Rate the Strength of Scientific Evidence. Evidence Report/Technology Assessment No. 47 (Prepared by the Research Triangle Institute–University of North Carolina Evidence-based Practice Center under Contract No. 290-97-0011). AHRQ Publication No. 02-E016. Rockville, MD: Agency for Healthcare Research and Quality; 2002. Available from: http://www.thecre.com/pdf/ahrq-system-strength.pdf. Accessed June 23, 2016. | ||
Schulz KF, Altman DG, Moher D. CONSORT 2010 Statement: updated guidelines for reporting parallel group randomised trials. BMJ. 2010;340:c332. | ||
Jadad AR, Moore RA, Carroll D, et al. Assessing the quality of reports of randomized clinical trials: is blinding necessary? Control Clin Trials. 1996;17(1):1–12. | ||
Timmer A, Sutherland LR, Hilsden RJ. Development and evaluation of a quality score for abstracts. BMC Med Res Methodol. 2003;3:2. | ||
Shea BJ, Grimshaw JM, Wells GA, et al. Development of AMSTAR: a measurement tool to assess the methodological quality of systematic reviews. BMC Med Res Methodol. 2007;7:10. | ||
Kung J, Chiappelli F, Cajulis OS, et al. From systematic reviews to clinical recommendations for evidence-based health care: validation of revised assessment of multiple systematic reviews (R-AMSTAR) for grading of clinical relevance. Open Dent J. 2010;4:84–91. | ||
PRISMA [homepage on the Internet]. Transparent reporting of systematic reviews and meta-analyses. Available from: http://prisma-statement.org. Accessed June 23, 2016. | ||
Oxman AD. Grading quality of evidence and strength of recommendations. BMJ. 2004;328(7454):1490. | ||
Phi L, Ajaj RA, Ramchandani MH, et al. Expanding the grading of recommendations assessment, development, and evaluation (Ex-GRADE) for evidence-based clinical recommendations: validation study. Open Dent J. 2012;6(1):31–40. | ||
Cochrane Statistical Methods Group & Cochrane Bias Methods Group [webpage on the Internet]. Assessing risk of bias included in studies. In: Higgins JPT, Altman DG, Sterne JAC, editors. Part 2: General Methods for Cochrane Reviews. Available from: http://handbook.cochrane.org/chapter_8/8_assessing_risk_of_bias_in_included_studies.htm. Accessed October 27, 2015. | ||
Alcaraz MGR, Veitz-Keenan A, Sahrmann, P, Schmidlin PR, Davis D, Iheozor-Ejiofor Z [webpage on the Internet]. Direct composite resin fillings versus amalgam fillings for permanent or adult posterior teeth. In: Cochrane Database of Systematic Reviews. Available from: http://onlinelibrary.wiley.com/doi/10.1002/14651858.CD005620.pub2/abstract;jsessionid=EE04006BD4DAF2737F527A0415236D7A.f04t03. Accessed October 27, 2015. | ||
Mills JE, Thorlund K, Ioannidis JPA. Demystifying trial networks and network meta-analysis. BMJ. 2013;346:f2914. | ||
Hutton B [webpage on the Internet]. Introduction to Concepts in Network Meta-Analysis [Online: PowerPoint presentation]. Available from: https://www.youtube.com/watch?v=IVY30A3UWbI. Accessed October 27, 2015. | ||
Newcomer JT [webpage on the Internet]. A New Approach to Quantification of Margins and Uncertainties for Physical Simulation Data. Available from: http://prod.sandia.gov/techlib/access-control.cgi/2012/127912.pdf. Accessed June 23, 2016. | ||
Ullman DG. Making Robust Decisions. Canada: Trafford Publishing; 2006. |
 © 2016 The Author(s). This work is published and licensed by Dove Medical Press Limited. The
full terms of this license are available at https://www.dovepress.com/terms
and incorporate the Creative Commons Attribution
- Non Commercial (unported, 3.0) License.
By accessing the work you hereby accept the Terms. Non-commercial uses of the work are permitted
without any further permission from Dove Medical Press Limited, provided the work is properly
attributed. For permission for commercial use of this work, please see paragraphs 4.2 and 5 of our Terms.
© 2016 The Author(s). This work is published and licensed by Dove Medical Press Limited. The
full terms of this license are available at https://www.dovepress.com/terms
and incorporate the Creative Commons Attribution
- Non Commercial (unported, 3.0) License.
By accessing the work you hereby accept the Terms. Non-commercial uses of the work are permitted
without any further permission from Dove Medical Press Limited, provided the work is properly
attributed. For permission for commercial use of this work, please see paragraphs 4.2 and 5 of our Terms.