Back to Journals » Clinical Ophthalmology » Volume 15
Evaluation of Explainable Deep Learning Methods for Ophthalmic Diagnosis
Authors Singh A ![]() , Jothi Balaji J
, Jothi Balaji J ![]() , Rasheed MA
, Rasheed MA ![]() , Jayakumar V, Raman R, Lakshminarayanan V
, Jayakumar V, Raman R, Lakshminarayanan V ![]()
Received 22 March 2021
Accepted for publication 14 May 2021
Published 18 June 2021 Volume 2021:15 Pages 2573—2581
DOI https://doi.org/10.2147/OPTH.S312236
Checked for plagiarism Yes
Review by Single anonymous peer review
Peer reviewer comments 2
Editor who approved publication: Dr Scott Fraser
Amitojdeep Singh,1,2 Janarthanam Jothi Balaji,3 Mohammed Abdul Rasheed,1 Varadharajan Jayakumar,1 Rajiv Raman,4 Vasudevan Lakshminarayanan1,2
1Theoretical and Experimental Epistemology Laboratory (TEEL), School of Optometry and Vision Science, University of Waterloo, Waterloo, ON, Canada; 2Department of Systems Design Engineering, University of Waterloo, Waterloo, ON, Canada; 3Department of Optometry, Medical Research Foundation, Chennai, India; 4Shri Bhagwan Mahavir Vitreoretinal Services, Sankara Nethralaya, Chennai, India
Correspondence: Amitojdeep Singh
School of Optometry and Vision Science, University of Waterloo, 200 University Ave. W. Waterloo, ON, N2L 3G1, Canada
Email [email protected]
Background: The lack of explanations for the decisions made by deep learning algorithms has hampered their acceptance by the clinical community despite highly accurate results on multiple problems. Attribution methods explaining deep learning models have been tested on medical imaging problems. The performance of various attribution methods has been compared for models trained on standard machine learning datasets but not on medical images. In this study, we performed a comparative analysis to determine the method with the best explanations for retinal OCT diagnosis.
Methods: A well-known deep learning model, Inception-v3 was trained to diagnose 3 retinal diseases – choroidal neovascularization (CNV), diabetic macular edema (DME), and drusen. The explanations from 13 different attribution methods were rated by a panel of 14 clinicians for clinical significance. Feedback was obtained from the clinicians regarding the current and future scope of such methods.
Results: An attribution method based on Taylor series expansion, called Deep Taylor, was rated the highest by clinicians with a median rating of 3.85/5. It was followed by Guided backpropagation (GBP), and SHapley Additive exPlanations (SHAP).
Conclusion: Explanations from the top methods were able to highlight the structures for each disease – fluid accumulation for CNV, the boundaries of edema for DME, and bumpy areas of retinal pigment epithelium (RPE) for drusen. The most suitable method for a specific medical diagnosis task may be different from the one considered best for conventional tasks. Overall, there was a high degree of acceptance from the clinicians surveyed in the study.
Keywords: explainable AI, deep learning, machine learning, image processing, optical coherence tomography, retina, diabetic macular edema, choroidal neovascularization, drusen
Introduction
Retinal diseases are prevalent among large sections of society, especially amongst the aging population and also those with other systemic diseases such as diabetes.1 It is estimated that the number of Americans over 40 years with a diabetic retinopathy (DR) diagnosis will rise threefold from 5.5 million in 2005 to 16 million in 2050.2 For each decade of age after 40, the prevalence of low vision and blindness increases by a factor of three.3 Long wait times in the developed world and lack of access to healthcare in the developing countries lead to delays in diagnosis and in turn deteriorated vision and even irreversible blindness. This leads to financial burden (and psychological burden) on patients as well as the healthcare system due to higher treatment costs in the later stages. Tackling such challenges and providing efficient health services requires advanced tools to help health care professionals.
Artificial intelligence (AI), especially deep learning which is modeled after the human neural system4 has produced promising results in many areas including ophthalmology. These are used for tasks like disease detection,5 segmentation,6 and quality enhancement7 of optical coherence tomography (OCT) and fundus photographs. The convolutional neural networks (CNN) are the most common form of deep learning algorithms used for image classification tasks like retinal disease detection and have shown promising results.8–10
Even though these algorithms show performance comparable to that of clinicians, the applications of DL methods in ophthalmology are limited. A major barrier to adoption is the “black-box” nature of these algorithms since they cannot explain how the algorithm arrived at that particular decision unlike a clinician. The other challenges include medico-legal and technical issues which could involve new legislation, user-centric systems, and improved training.11
Various explainability methods have been developed and applied to different areas including medical imaging.12 Most of the explainability methods evaluate the contribution of each pixel of the image to the model output and hence are called attribution methods. Almost all the studies, especially the ones for ophthalmic diagnosis utilize a single explainability method and do not provide comparisons with alternatives.13,14 We argue that an explainability method that performs the best on standard computer vision datasets may not be the most suitable for OCT images which have a different data distribution than real-world images. Previously,15,16 we have compared multiple explainability methods quantitatively for their ability to highlight the part of the image which had the most impact on the model decision. We did an exploratory qualitative analysis using ratings from 3 optometrists and the results showed the need for a more detailed analysis to judge these methods.16
In this study, we compare and evaluate 13 explainable deep learning methods for diagnosis of three retinal conditions – choroidal neovascularization (CNV), diabetic macular edema (DME), and drusen. These methods were rated by a panel of 14 eye care professionals (10 ophthalmologists and 4 optometrists). Their observations regarding the clinical significance of these methods, preference regarding AI systems, and suggestions for future implementations are also analyzed herein.
Methods
In this section, we discuss the deep learning model used to detect the diseases along with a brief overview of the explainability methods used to generate the heatmaps of the regions the model considered for making the decisions.
Model
A CNN called Inception-v317 is used for many computer vision tasks including the diagnosis of retinal images was used to classify the data from the UCSD OCT dataset18 into 4 classes – CNV, DME, drusen, and normal. This data set has OCT images taken from adult cohorts during the routine clinical care, retrospectively selected for the diagnosed conditions including CVN, DME, drusen and normal from electronic medical record database between the period (July, 2013 and March, 2017) at various eye care centers. Only horizontal foveal cross-section OCT were extracted in standard format. The model was trained on 84,000 images and tested on 1000 images (250 from each class). This resulted in a test accuracy of 99.3%. The confusion matrix showing the relationship between true and predicted classes is shown in Table 1. It compares the predicted label (diagnosis) by the model on the X-axis with true labels (ground truths) on the Y-axis.
 |
Table 1 Confusion Matrix for the Model on the Test Set of 1000 Images |
Explainability with Attributions
The attribution methods used in this study can be categorized into 3 types apart from the baseline occlusion which involves covering parts of the image to see the impact on the output. There are many methods to explain the deep learning models and we chose the 13 most common ones that were applicable to the underlying Inception-v3 model. The function-based methods derive attributions directly from the model gradients and include Gradient and Smoothgrad.19 The signal-based methods analyze the flow of information (signal) through layers of neural network and include DeConvNet,20 Guided BackPropagation (GBP),21 and Saliency.22 The methods based on attributions completely include Deep Taylor,23 DeepLIFT,24 Integrated Gradients (IG),25 input times gradient, Layerwise Relevance Propagation26 with Epsilon (LRP EPS) and Z rules (LRP Z), and SHAP.27 SHAP and Deep LIFT are considered as state-of-the-art on standard machine learning datasets and have superior theoretical background while IG is commonly used for retinal images.13,14
The heatmaps for 3 correctly and 1 incorrectly classified example of using the attribution methods are shown in Figures 1 and 2. It must be noted that certain methods such as DeepTaylor and Saliency provide only positive evidence. Those providing both positive and negative evidence have some high-frequency noise (negative evidence) that can be removed in practice but retained here to compare original outputs.
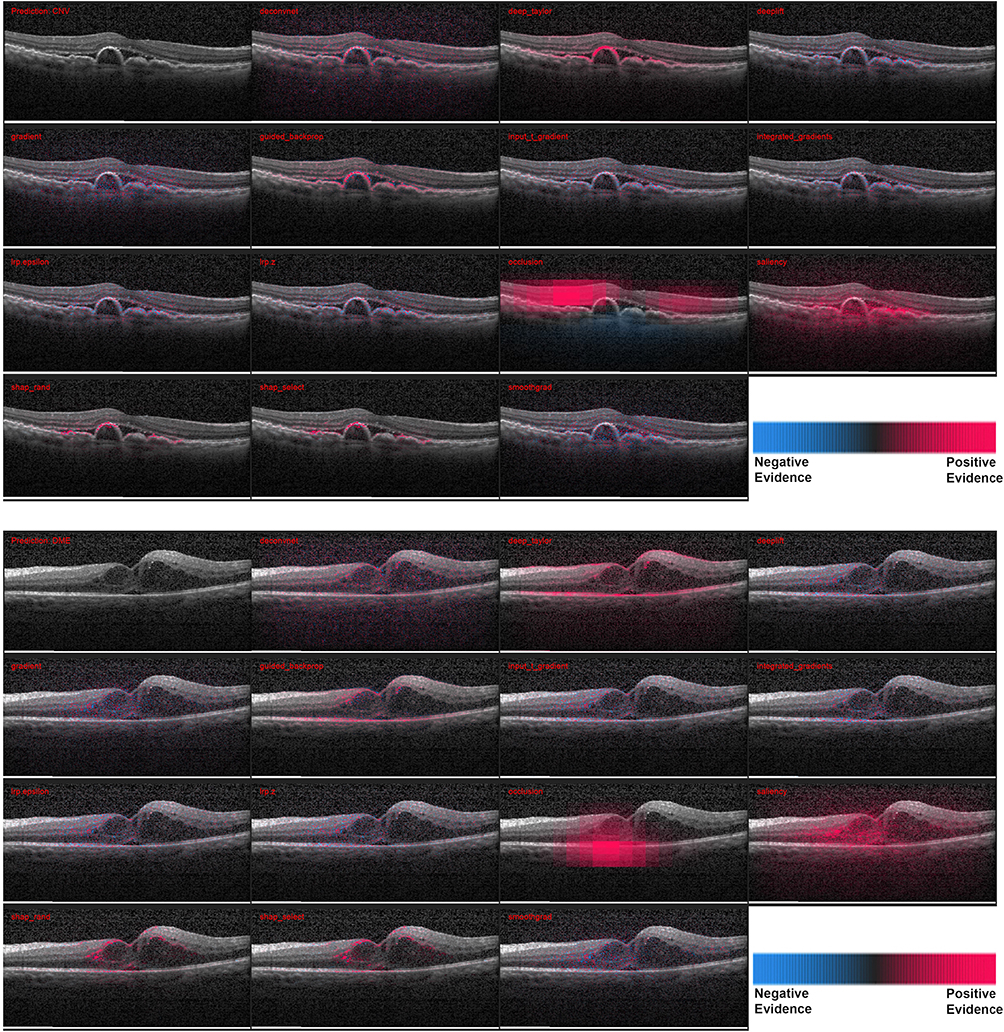 |
Figure 1 Heatmaps for scans with the larger pathologies – (top) choroidal neovascularization (CNV) and (bottom) diabetic macular edema (DME). For each case - Row 1: Input image, DeConvNet, Deep Taylor, DeepLIFT. Row 2: Gradient, GBP, Input times gradient, IG. Row 3: LRP – EPS, LRP – Z, Occlusion, Salience. Row 1: Input image, DeConvNet, Deep Taylor, DeepLIFT. Row 2: Gradient, GBP, Input times gradient, IG. Row 3: LRP – EPS, LRP – Z, Occlusion, Salience. Row 4: SHAP Random, SHAP Selected, SmoothGrad. The scale in the bottom right shows that the parts highlighted in magenta color provide positive evidence regarding presence of a disease while those in blue color provide a negative evidence indicating that the image is closer to normal. DeepTaylor, GBP perform the best, SHAP highlights partial but precise regions. The fluid accumulation for CNV and the edges of the edema for DME were highlighted by better performing methods. |
 |
Figure 2 Heatmaps for 2 scans with drusen, the smaller pathology. Top: Correct diagnosis, Bottom: Incorrect diagnosis. The pathological structures are smaller than the previous two and as a result most of the methods highlight regions outside too. SHAP is the most precise here in. In the incorrect case there is higher negative evidence (blue), especially with occlusion. The performance of the methods can be observed in terms of positive highlights of the bumpy RPE. |
The heatmaps generated by the 13 methods for 20 images from each disease category were evaluated by the 14 clinicians. The group had a median experience of 5 years in retinal diagnosis, including 4 years with OCT imaging. The average number of images rated per week was approximately 40 with all the clinicians having prior experience analyzing retinal SD-OCT images. They rated the explanations from 0 (not relevant) to 5 (fully relevant). The scores of each clinician were normalized by subtracting the respective mean and then rescaling between 0 and 5.
Results
Here we provide quantitative and qualitative results of this study. The ratings from clinicians and the survey used to collect the feedback are available on request.
Comparison Between Methods
The violin plots of normalized scores of raters for all the methods across 60 scans are shown in Figure 3. The estimated probability density of each method is shown by the thickness of the violin plot. Table 2 gives the rating data for all conditions and methods. Deep Taylor with the highest median rating of 3.85 was judged as the best performing method. It is relatively simple to compute and involves Taylor series expansion of the signal at the neurons. It was considerably ahead of GBP, the next best method which was closely followed by SHAP with selected and then random background.
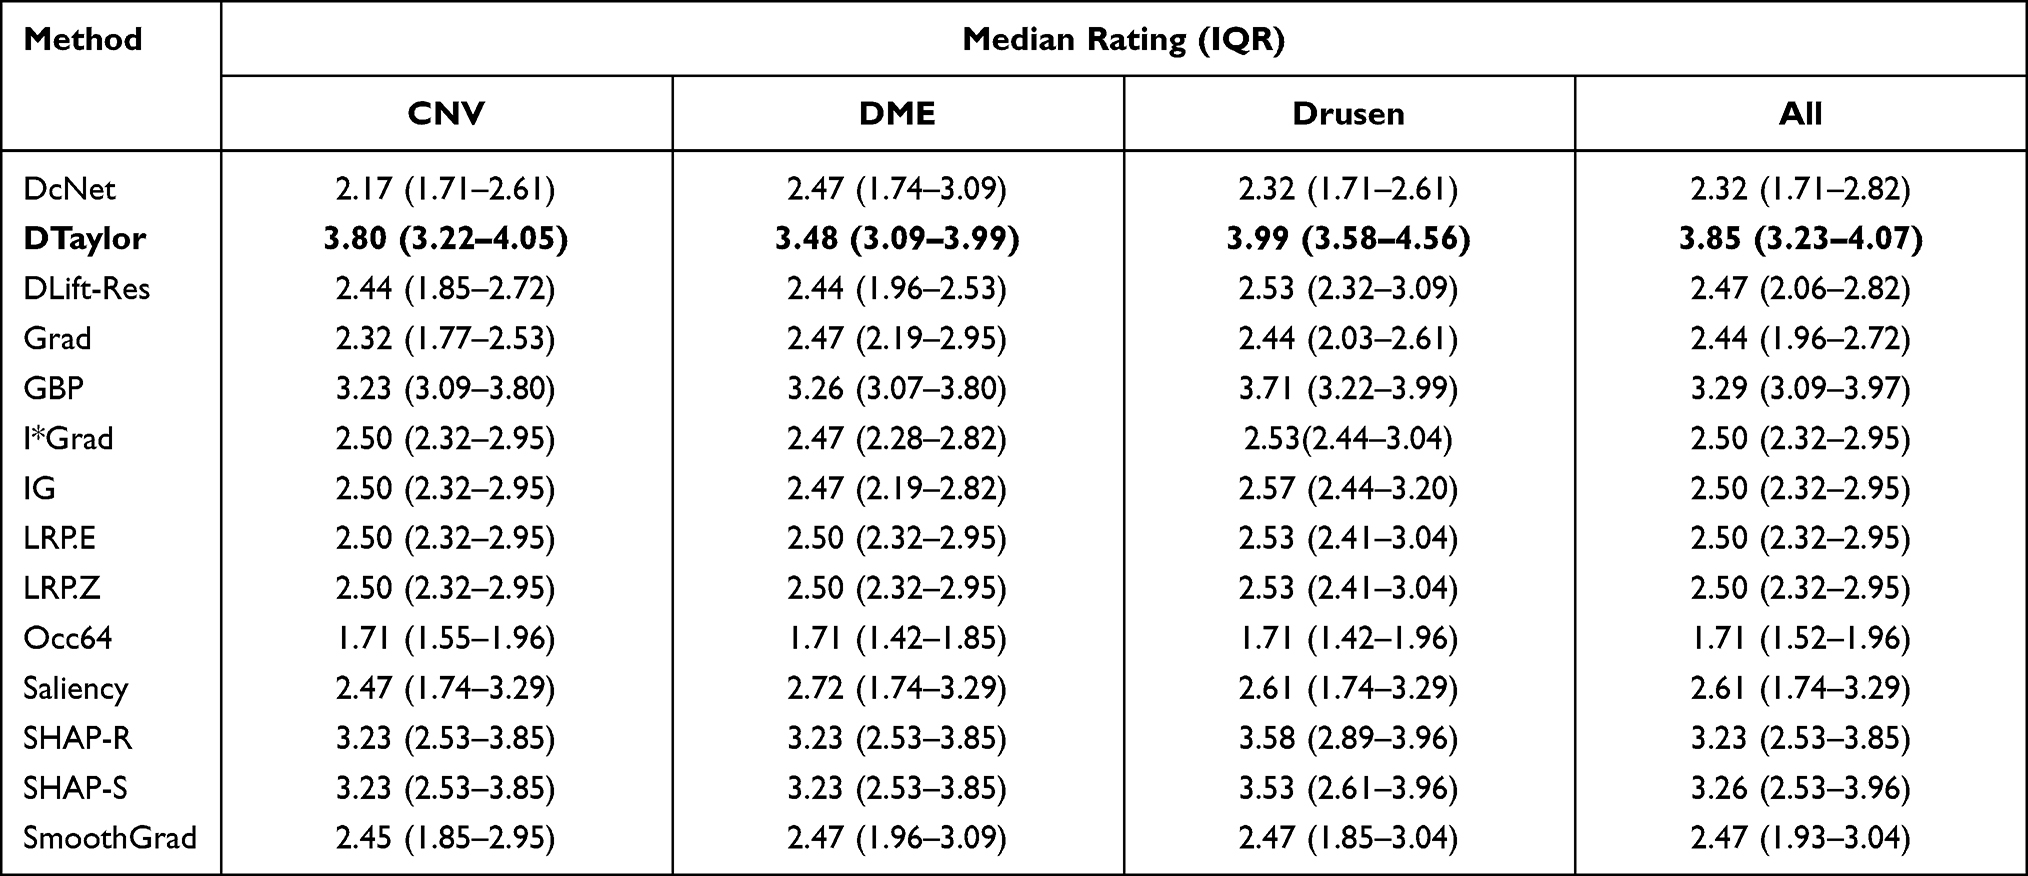 |
Table 2 Median Ratings (with IQR) for Each Disease for All Attribution Methods. Deep Taylor (Bold) Had the Highest Ratings |
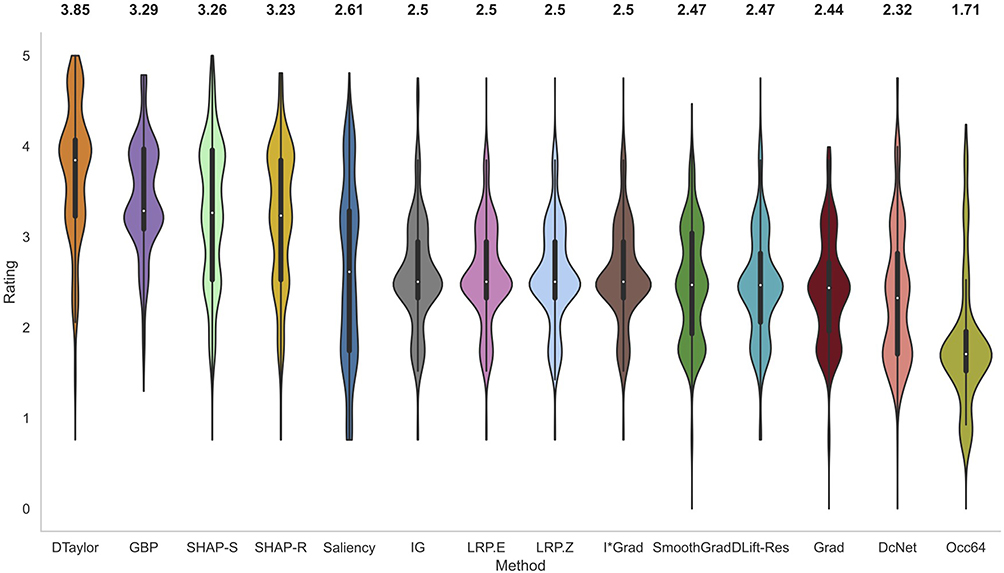 |
Figure 3 Violin plots of normalized ratings of all methods. The breadth of the plot shows the probability density of the data and the median value is reported on top of the plots. Deep Taylor was rated the highest overall followed by GBP and SHAP. |
IG, commonly employed in the literature for generating heatmaps for retinal diagnosis13,14 received a median score of only 2.5. It is known to be strongly related and, in some cases, mathematically equivalent28 to LRP EPS which was also reflected in similar ratings. The Z rule of EPS was not found to make much difference and the simple to compute input times gradient performed reasonably well. DeepLIFT could not be tested in its newer Reveal Cancel rule due to compatibility issues with the model architecture and the older Rescale rule had a below average performance. As expected, the baseline occlusion which used sliding window of size 64 to cover the pixel and then compute significance performed worse than the attribution-based methods.
Most of the methods have the majority of the values around the median indicating consistent ratings across images and raters. Both cases of SHAP and Saliency have particularly elongated distributions. For SHAP, the curve is widest around 4 indicating good ratings for many cases. However, the values around 2.5 due to lower coverage of pathology drive the overall median lower. In the case of Saliency, the ratings are spread from about 4.5 to 1.5 with many of them around 3.25 and 1.75 marks. The former is due to larger coverage of the pathological region and the latter is due to the fact that it missed regions frequently. Hence, despite better median value, it is not as suitable as lower-rated methods such as IG where the bulk of the value is around the median.
Comparison Between Raters
The Spearman’s rank correlation was used to compare the ratings of the clinicians with each other. This non-parametric test assesses the relationship between two variables, in this case the ratings of images by two different clinicians. The correlations between the ratings of all 14 clinicians for the 60 images and 13 methods are shown in Figure 4. P1 to P10 are ophthalmologists while P11 to P14 are optometrists.
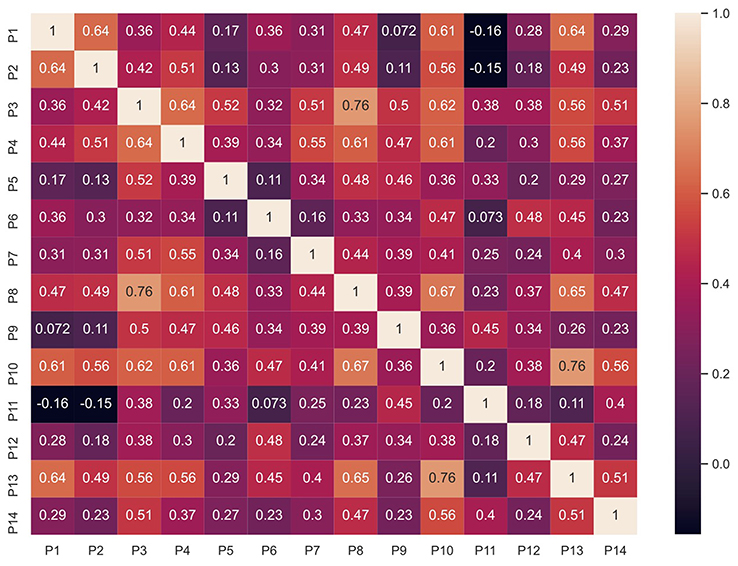 |
Figure 4 Spearman correlation for clinician’s ratings. |
Most of the values are around 0.5 indicating an overall moderate agreement between clinicians. The highest correlation was of 0.76 between P10 and P13. A slight negative correlation was found between P1 and P11 as well as P2 and P11. The rater P11 had relatively less experience with OCT which could have resulted in a lower correlation with other clinicians. This indicates that the background and training (ie, prior experience) of clinicians affected their ratings of the system.
Qualitative Observations
In this section, the qualitative feedback given by the clinicians regarding the performance of the system, potential use cases and other suggestions are summarized. A survey was collected from the clinicians to seek their opinion post study. It is notable that 79% (11/14) clinicians who participated in the study indicated a preference for having an explainable system assisting them in practice, reaffirming the need for such system to the clinical community. One of the ophthalmologists gave their feedback on the system as – “It is a definite boon to the armamentarium as far as screening and diagnosis is concerned on a mass scale or in a telemedicine facility.”
The clinicians noted an overall better coverage of the pathology by Deep Taylor as the reason for higher ratings, however, all methods except SHAP were found to be mainly detecting the boundaries. SHAP was observed to be identifying regions inside the edema also, though the partial coverage of the region lower score. The noise, (represented in blue) especially in the case of LRP, was found to be a distraction by some clinicians and can be removed for actual implementation.
Most of the clinicians identified telemedicine and tertiary care centres as potential sites which can utilize this system. It was suggested that it can be used for screening in places with large number of patients without sufficient number of clinicians. It could help clinicians by categorizing the scans with suspect conditions and thus allow them to focus their attention on examining the areas of the images highlighted by algorithm. This can improve efficiency, save time and therefore optimize patient care. Another application could be archival and data management where the heatmaps could be used for separating images faster.
Discussion
Along with a comparison of various available attribution methods to explain deep learning models, this study validated their results through ratings from a large panel of clinicians. Most of them were not involved in the design process but were generally positive about the utility of the system.
A method based on Taylor series expansion, known as Deep Taylor, received the highest ratings. Apart from highlighting the markers of the disease it also focussed on the structures that could indicate further proliferation, eg, RPE in the case of mild drusen. However, the methods with stronger theoretical foundations did not perform well when compared to Deep Taylor. It should be noted that the original goal of these techniques is to generate a true representation of the features learned by a model for a given task. Hence, the heatmaps generated are affected both by the model and the attribution method. It must be noted that a significant issue with GBP, the second highest rated method in this study is that it acts as an edge detector and not actually revealing the model’s decision-making process.29,30
The dataset used here labeled only primary diagnosis, however, the clinicians were able to identify secondary diagnosis for some images from their evaluation. Also, due to the nature of the dataset the study is limited to a single orientation of the OCT scan which might differ between the images. All clinicians preferred to have a presentation of scan position on fundus images in addition to OCT for a better understanding of the scanned area. A system that uses a combination of fundus images, OCT, and patient data (eg, Mehta et al31) could be useful in practice. Another application of explainability system could be as a tool for self-learning. The system can be further developed to encompass other diseases and finetuned for the specific imaging modality, considering variables such as noise, illumination, field position, etc. Currently, OCT is not used in screening because they are expensive as well as bulky. Given recent advances in low-cost portable OCT devices,32 it is possible to integrate an explainable diagnosis system on a laptop or mobile device for teleophthalmology purposes and it would be invaluable to the clinical community.
Conclusion
This is to the best of our knowledge one of the first studies to look at qualitative comparison of various explainable AI methods performed by a large panel of clinicians. A method based on Taylor series expansion, known as Deep Taylor, received the highest ratings outperforming the methods with stronger theoretical background and better results on standard datasets. A more detailed analysis of specific retinal structures highlighted by the algorithms in comparison to clinical evaluation is currently underway. In addition to highlighting the pre-existing pathology, it could also highlight markers for further proliferation. Positive feedback about the use of such system was received from the panel of clinicians. Future enhancements of the system could make it a trustable diagnostic assistant helping resolve the lack of access to ophthalmic healthcare.
Ethics Statement
This study uses a public dataset which does not have any personally identifiable information (PII) and hence no ethics clearance was required. The data used in this study is collected by Kermany et al.5 They have the ethics approval to use this data for the research purpose. For more information on data and ethics please refer to the link https://data.mendeley.com/datasets/rscbjbr9sj/3. This data is screened and labeled by the expert clinicians. We hold legal rights to use this data for research purpose. The methods used in this study do not require any further ethics clearance.
Acknowledgments
This work is supported by an NSERC Discovery Grant and a NVIDIA Titan V GPU Grant to V.L. This research was enabled in part by Compute Canada (www.computecanada.ca). We acknowledge the team of vitreoretinal fellows from Sankara Nethralaya, Chennai, India for participating in the study. (Drs. J Sreenivasan, RPK Bharat, SK Vishwambhar, KM Sanghvi, A Shekhar, AJ Rijay, SS Roy, I Agarwal, KK Roy, and P Maitra).
Disclosure
The authors report no conflicts of interest in this work.
References
1. Romero-Aroca P. Managing diabetic macular edema: the leading cause of diabetes blindness. World J Diabetes. 2011;2(6):98. doi:10.4239/wjd.v2.i6.98
2. Willis JR, Doan QV, Gleeson M, et al. Vision-related functional burden of diabetic retinopathy across severity levels in the United States. JAMA Ophthalmol. 2017;135(9):926–932. doi:10.1001/jamaophthalmol.2017.2553
3. Lakshminarayanan V. The global problem of blindness and visual dysfunction. Photonic Innov Solut Complex Environ Syst. 2012;8482:84820A.
4. Leopold HA, Zelek JS, Lakshminarayanan V. Deep learning methods for retinal image analysis. In: Sejdić E, Falk TH, editors. Biomedical Signal Processing in Big Data. CRC Press; 2018:329–365.
5. Singh A, Sengupta S, Lakshminarayanan V. Glaucoma diagnosis using transfer learning methods. Appl Mach Learn SPIE. 2019;11139:111390U.
6. Fang L, Cunefare D, Wang C, Guymer RH, Li S, Farsiu S. Automatic segmentation of nine retinal layer boundaries in OCT images of non-exudative AMD patients using deep learning and graph search. Biomed Opt Express. 2017;8(5):2732–2744. doi:10.1364/BOE.8.002732
7. Sengupta S, Wong A, Singh A, Zelek J, Lakshminarayanan V. DeSupGAN: multi-scale feature averaging generative adversarial network for simultaneous de-blurring and super-resolution of retinal fundus images. In: International Workshop on Ophthalmic Medical Image Analysis. In press; 2020.
8. Sengupta S, Singh A, Leopold HA, Gulati T, Lakshminarayanan V. Ophthalmic diagnosis using deep learning with fundus images – a critical review. Artif Intell Med. 2020;102:101758. doi:10.1016/j.artmed.2019.101758
9. Ting DSW, Pasquale LR, Peng L, et al. Artificial intelligence and deep learning in ophthalmology. Br J Ophthalmol. 2019;103(2):167–175. doi:10.1136/bjophthalmol-2018-313173
10. Leopold HA, Singh A, Sengupta S, Zelek JS, Lakshminarayanan V. Recent advances in deep learning applications for retinal diagnosis using OCT. In: El-Baz Editor AS, editor. State of the Art in Neural Networks. NY: Elsevier, in press; 2020.
11. Holzinger A, Biemann C, Pattichis CS, Kell DB. What do we need to build explainable {AI} systems for the medical domain? arXiv Prepr arXiv171209923. 2017.
12. Singh A, Sengupta S, Lakshminarayanan V. Explainable deep learning models in medical image analysis. J Imaging. 2020;6(6):52. doi:10.3390/jimaging6060052
13. Yang H-L, Kim JJ, Kim JH, et al. Weakly supervised lesion localization for age-related macular degeneration detection using optical coherence tomography images. PLoS One. 2019;14(4):e0215076. doi:10.1371/journal.pone.0215076
14. Sayres R, Taly A, Rahimy E, et al. Using a deep learning algorithm and integrated gradients explanation to assist grading for diabetic retinopathy. Ophthalmology. 2019;126(4):552–564. doi:10.1016/j.ophtha.2018.11.016
15. Singh A, Sengupta S, Abdul Rasheed M, Zelek J, Lakshminarayanan V. Interpretation of deep learning using attributions: application to ophthalmic diagnosis. Proc Appl Mach Learn SPIE. 2020;11511:115110A.
16. Singh A, Sengupta S, Balaji JJ, Rasheed A. What is the optimal attribution method for explainable ophthalmic disease classification? In:
17. Szegedy C, Vanhoucke V, Ioffe S, Shlens J, Wojna Z. Rethinking the inception architecture for computer vision. In:
18. Kermany DS, Goldbaum M, Cai W, et al. Identifying medical diagnoses and treatable diseases by image-based deep learning. Cell. 2018;172(5):1122–1131. doi:10.1016/j.cell.2018.02.010
19. Smilkov D, Thorat N, Kim B, Viégas F, Wattenberg M. Smoothgrad: removing noise by adding noise. arXiv Prepr arXiv170603825. 2017.
20. Zeiler MD, Fergus R. Visualizing and understanding convolutional networks. In:
21. Springenberg JT, Dosovitskiy A, Brox T, Riedmiller M. Striving for simplicity: the all convolutional net. arXiv Prepr arXiv14126806. 2014.
22. Simonyan K, Vedaldi A, Zisserman A. Deep inside convolutional networks: visualising image classification models and saliency maps. arXiv Prepr arXiv13126034. 2013.
23. Montavon G, Lapuschkin S, Binder A, Samek W, Müller K-R. Explaining nonlinear classification decisions with deep taylor decomposition. Pattern Recognit. 2017;65:211–222. doi:10.1016/j.patcog.2016.11.008
24. Shrikumar A, Greenside P, Shcherbina A, Kundaje A. Not just a black box: learning important features through propagating activation differences. arXiv Prepr arXiv160501713. 2016.
25. Sundararajan M, Taly A, Yan Q. Axiomatic attribution for deep networks. Int Conf Mach Learn ICML 2017. 2017;70:5109–5118.
26. Bach S, Binder A, Montavon G, Klauschen F, Müller K-R, Samek W. On pixel-wise explanations for non-linear classifier decisions by layer-wise relevance propagation. PLoS One. 2015;10(7):e0130140. doi:10.1371/journal.pone.0130140
27. Chen H, Lundberg S, Lee S-I. Explaining models by propagating shapley values of local components. arXiv Prepr arXiv191111888. 2019.
28. Ancona M, Ceolini E, Öztireli C, Gross M. Towards better understanding of gradient-based attribution methods for deep neural networks. arXiv Prepr arXiv171106104. 2017.
29. Adebayo J, Gilmer J, Muelly M, Goodfellow I, Hardt M, Kim B. Sanity checks for saliency maps. Adv Neural Inf Process Syst. 2018;9505–9515.
30. Sixt L, Granz M, Landgraf T. When explanations lie: why many modified bp attributions fail; 2019. Available from: http://arxiv.org/abs/1912.09818.
31. Mehta P, Petersen C, Wen JC, et al. Automated detection of glaucoma with interpretable machine learning using clinical data and multi-modal retinal images. bioRxiv. 2020. doi:10.1101/2020.02.26.967208
32. Song G, Chu KK, Kim S, et al. First clinical application of low-cost OCT. Transl Vis Sci Technol. 2019;8(3):61. doi:10.1167/tvst.8.3.61
 © 2021 The Author(s). This work is published and licensed by Dove Medical Press Limited. The
full terms of this license are available at https://www.dovepress.com/terms
and incorporate the Creative Commons Attribution
- Non Commercial (unported, 3.0) License.
By accessing the work you hereby accept the Terms. Non-commercial uses of the work are permitted
without any further permission from Dove Medical Press Limited, provided the work is properly
attributed. For permission for commercial use of this work, please see paragraphs 4.2 and 5 of our Terms.
© 2021 The Author(s). This work is published and licensed by Dove Medical Press Limited. The
full terms of this license are available at https://www.dovepress.com/terms
and incorporate the Creative Commons Attribution
- Non Commercial (unported, 3.0) License.
By accessing the work you hereby accept the Terms. Non-commercial uses of the work are permitted
without any further permission from Dove Medical Press Limited, provided the work is properly
attributed. For permission for commercial use of this work, please see paragraphs 4.2 and 5 of our Terms.