Back to Journals » Clinical Ophthalmology » Volume 15
Evaluation of Corneal Epithelial Thickness and Dry Eye Disease Tests in Thalassemic Adolescents
Authors Ebeid WM ![]() , Kenny MA, Badran TA
, Kenny MA, Badran TA
Received 10 August 2020
Accepted for publication 6 November 2020
Published 6 April 2021 Volume 2021:15 Pages 1425—1431
DOI https://doi.org/10.2147/OPTH.S276335
Checked for plagiarism Yes
Review by Single anonymous peer review
Peer reviewer comments 2
Editor who approved publication: Dr Scott Fraser
Weam Mohamed Ebeid,1 Mahmoud Adel Kenny,2 Tamer AbdelFattah Badran1
1Department of Ophthalmology, Faculty of Medicine, Ain Shams University, Cairo, Egypt; 2Department of Pediatrics, Faculty of Medicine, Ain Shams University, Cairo, Egypt
Correspondence: Weam Mohamed Ebeid
Faculty of Medicine, Ain Shams University, 78 First District, Fifth Settlement, Cairo, 11861, Egypt
Tel +20 1003785838
Email [email protected]
Purpose: To assess dry eye disease (DED) in thalassemic adolescents by evaluating corneal epithelial thickness (CET) and various dry eye clinical tests and correlate them to tissue iron overload.
Methods: The study included 120 Beta-thalassemia patients (11 to 18 years) and 120 matched controls. CET maps were captured using anterior segment optical coherence tomography. OSDI questionnaire was completed. Dry eye tests included Schirmer test, tear film breakup time (TBUT), and ocular surface staining (OSS) with fluorescein and lissamine green. We recorded serum ferritin level, and liver iron concentration (LIC) measured by magnetic resonance imaging.
Results: Superior and inferior CET was thinner, while map standard deviation (MSD) was higher in thalassemics compared to controls (all P< 0.001). Thalassemic group also showed higher OSDI scores (P< 0.001), shorter TBUT (P< 0.001), and higher OSS grades (P< 0.001). Both superior and inferior CET was correlated positively with TBUT, and negatively with OSS (all P < 0.001). Serum ferritin and LIC showed negative correlations with CET (superior and inferior, both P< 0.001), positive correlations with MSD, P< 0.001, as well as with TBUT (P< 0.001), OSS (P< 0.001), and OSDI scores (P< 0.001).
Conclusion: Thalassemic adolescents had thinner CET with higher thickness’ variability, shorter TBUT and more marked OSS than controls. Correlation of higher serum ferritin and hepatic iron overload with irregular epithelial thinning and more affected dry eye tests results supports our hypothesis that high tissue iron levels could play a pivotal role in DED pathogenesis in thalassemic patients.
Keywords: dry eye, thalassemia major, corneal epithelial map, OSDI questionnaire, anterior segment optic coherence tomography
Introduction
Thalassemia major (TM) is a genetic disease that usually starts in early infancy and leads to hypochromic microcytic anemia. Iron accumulation in tissues due to red blood cell destruction and repetitive blood transfusion necessitates the lifelong use of iron chelators, creating hazardous impacts on the organs’ functions.1,2
Various ocular changes have been described in thalassemic patients.3–5 Previous studies illustrated that both iron overload and iron-chelating agents, mainly the injectable deferoxamine, can be the cause of such changes.6,7
Patients with beta thalassemia frequently develop both exocrine and endocrine manifestations owing to deposition of iron in the glands; with its established cytotoxic effect.8 The sicca syndrome with iron deposition within the salivary glands has been previously documented in patients receiving multiple blood transfusions. Furthermore, many patients with beta thalassemia often present with the classic dry eye disease (DED) symptoms, such as burning and foreign body sensation.9,10
Defining DED has always been challenging. It was defined by the International Dry Eye Workshop II as a multifactorial disease of the ocular surface characterized by a loss of homeostasis of the tear film, and accompanied by ocular symptoms, in which tear film instability and hyperosmolarity, ocular surface inflammation and damage, and neurosensory abnormalities play etiological roles.11
Since more objective tests are needed to support the diagnosis of DED; corneal epithelial thickness (CET) has been recently introduced as a quantitative dry eye clinical test. It is assessed using anterior segment optical coherence tomography (AS-OCT). Prior reports studying the epithelial thickness profile in DED had inconstant results, but most of them advocate an increased epithelial thickness’ variation throughout the cornea of DED cases.12–15
DED is not a common finding in adolescents, this is because most of its etiological factors are more common in adult population. Thus, there have been limited reports of DED prevalence and characteristics in children and adolescents.16
In our study, we aimed to assess DED in thalassemic adolescents compared to controls. We evaluated corneal epithelial thickness maps measured by AS-OCT, Ocular Surface Disease Index (OSDI) questionnaire and various clinical tests of dry eye. We also tried to reveal the relationship of various dry eye parameters to serum ferritin level and liver iron concentration in thalassemics.
Materials and Methods
This cross-sectional clinical study was conducted between May 2019 and January 2020. All patients were recruited from those attending the Pediatric Haematology Clinic of Ain Shams University. The study included 120 Beta-thalassemia patients; their ages ranged from 11 to 18 years (Group 1). They were 54 males and 66 females. One hundred twenty age and sex-matched healthy individuals were recruited as a control group (Group 2).
The study was conducted in accordance with the ethical standards settled by Ethics committee of the Faculty of Medicine, Ain Shams University and was approved by the same committee. Informed consents were obtained from the patients’ guardians. The study was carried out in accordance with the Declaration of Helsinki.
We excluded subjects showing evidence of an active eye infection or allergy, lid movement disorder, abnormal nasolacrimal drainage, contact lens wear, or any other systemic diseases.
A detailed medical history was taken from each patient including duration of disease together with type and duration of chelation therapy. We only included thalassemic patients kept on one oral chelator (deferasirox), at a maximum dose of 40 mg/kg/day; taken as a single dose in the morning. Laboratory data were recorded including; Pre-transfusion hemoglobin level [gm/dl], and Serum ferritin level (normal range: 7–140 ng/mL).
Liver iron quantitative assessment was performed on a 1.5 Tesla superconducting system with a 30 Mt/min gradient with coil. Dedicated phased array coil was used for enhanced resolution and signal-to-noise ratio. Morphological assessment of T2 relaxation was done via dedicated multi TRT2 sequence.17 Normal liver iron concentration (LIC) is 1–7 mg iron/gm dry weight of liver. LIC of 7–15 mg/gm liver dry weight is considered mild to moderate hepatic iron overload. LIC of more than 15 mg iron/gm dry liver weight is considered as severe hepatic iron overload.18
All participants completed a structured questionnaire for a standardized assessment of DED-related symptoms (Ocular Surface Disease Index; OSDI).19 OSDI has 3 subscales, which are; vision-related function (6 questions), ocular symptoms (3 questions), and environmental triggers (3 questions).20 It is scored on a scale of 0 to 100, where the higher the scores the greater disability.
Schirmer I test was performed using Whatman filter paper placed between the eyeball and the most lateral part of the inferior lid (without anesthesia). After 5 min the amount of wetting was noted. Values of ≤10mm/5min were considered dry eye.21
Tear breakup time (TBUT) was evaluated by the application of 2% fluorescein then examining the patient under slit lamp using cobalt blue filter. The time taken from the last blink till the appearance of the first dark spot on the cornea was noted using a stopwatch. We calculated the average of three breakup times. Values of ≤10 seconds were considered dry eye.21
Corneal and conjunctival fluorescein staining was assessed approximately 2.5–3.0 min following fluorescein instillation, using cobalt blue illumination. Conjunctival staining with lissamine green was examined after instilling 10 ul of a 1% sodium lissamine green dye. Ocular surface staining was evaluated following the Oxford schema.22
Slit lamp examination was done for the presence of any active inflammation or structural changes of the anterior chamber and the eyelids. Dilated fundus examination was done to detect any posterior segment abnormalities.
Optical Coherence Tomography
The Fourier-domain AS-OCT system RTVue-XR Avanti (Optovue Inc, Fremont, California, USA) was employed, with a corneal adaptor module, running on software version 2017.1. We performed Pachymetry wide scan which consists of eight meridian scans; comprising 1536 A-scans each. The 8 meridians are evenly distributed, and each one is repeated 4 times in rapid succession.
The epithelial thickness is automatically measured based on the distance from the anterior corneal surface boundary to the epithelial posterior boundary. Data output included corneal epithelial thickness maps calculated by the software automatically over the 7-mm-diameter corneal area. The included device software automatically analyses these maps and provides an average epithelial thickness of the superior and inferior halves, in addition to statistically computing the map standard deviation (MSD). All OCT measurements were obtained prior to any dry eye tests, which were thereafter performed in that order; Schirmer test, TBUT, ocular surface staining, slit lamp examination and last indirect ophthalmoscopy.
Statistical Analysis
The sample size was calculated using OpenEpi program version 13; adjusting the power of the test to 80%, confidence interval to 95%; the margin of error accepted to 5% and the ratio between cases and controls to 1:1; the total sample size needed for this study was found 182 patients divided into two equal groups (91 patients in each group). We analyzed our data using the IBM SPSS Statistics for Windows (Version 25.0. Armonk, NY: IBM Corp.). Quantitative data were presented as Mean ± standard deviation. Qualitative variables were compared by the chi-squared test. Comparison between groups was performed using the independent sample t-test. Paired samples t-test test was used to compare paired samples. Correlation analysis was calculated using Pearson correlation coefficient. P-values <0.05 were considered statistically significant.
Results
The demographic and general characteristics of thalassemia patients are shown in Table 1. No significant differences in age, gender, or visual acuity were found between groups Table 2.
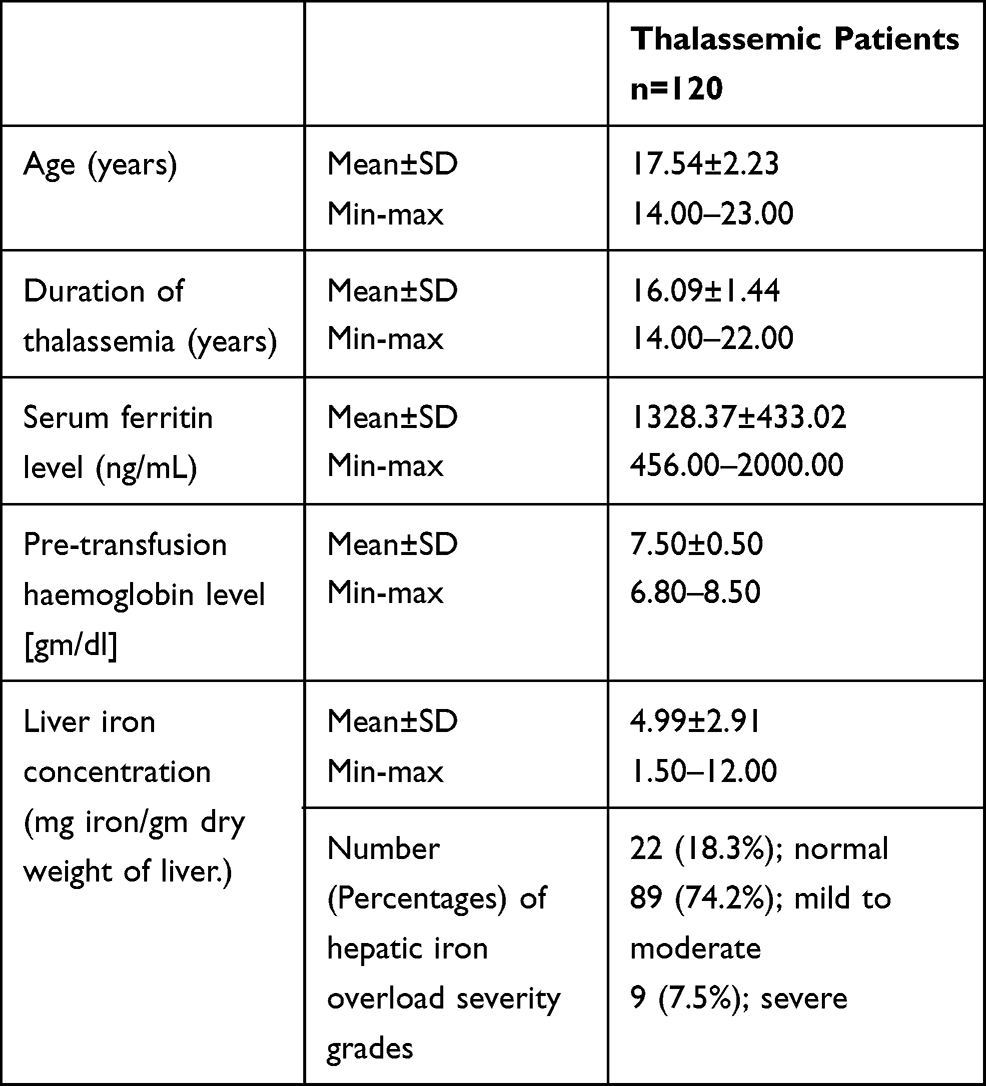 |
Table 1 Demographic and Laboratory Characteristics of Thalassemic Patients |
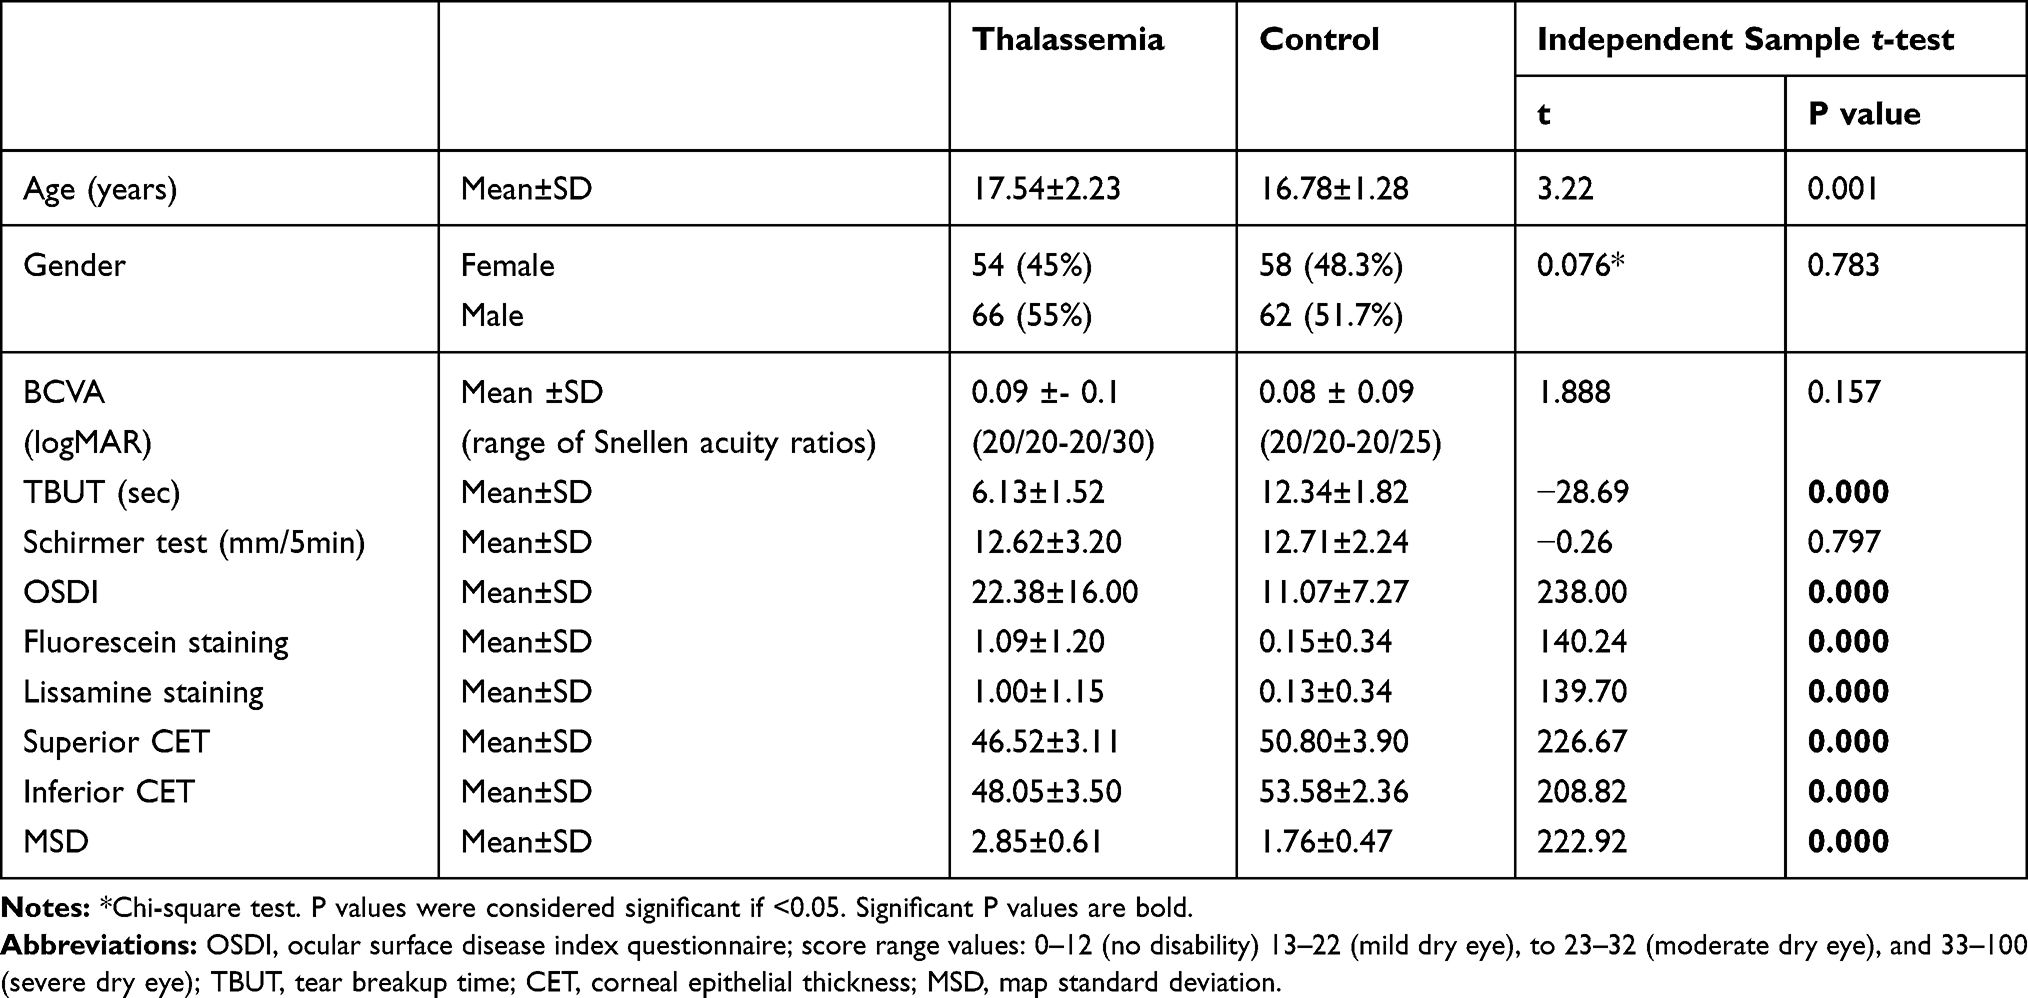 |
Table 2 Comparison Between Thalassemics and Controls Regarding Various Clinical Parameters |
On comparing the corneal epithelial thickness parameters between the two groups; it was found that in thalassemic group; the superior as well as the inferior CET were thinner, while MSD was higher (t-test, t= 226.67, 208.82, 222.92, respectively, all with P<0.001).
OSDI score values were significantly higher in the thalassemic group compared to controls (t-test, t= 238.00, P<0.001). TBUT was significantly shorter in the thalassemic group (t-test, t=−28.69, P<0.001). On the contrary, Schirmer test showed insignificant differences among the 2 studied groups. (t-test, t=−0.26, P=0.797) Table 2.
As regards to the ocular surface staining with fluorescein and lissamine green; both clinical tests showed significantly higher staining grades in the thalassemic group in comparison to controls (t-test, t=140.24, 139.70, respectively, both P<0.001) Table 2.
Correlations of different studied parameters among the thalassemia patients were performed. CET in both superior and inferior zones was correlated positively to TBUT (Pearson correlation, r=0.479, 0.345, respectively, P < 0.001 both), and negatively to ocular surface staining grades whether with fluorescein (Pearson correlation, r=−0.538, −0.435 respectively, P < 0.001 both) or lissamine stain (Pearson correlation, r=−0.554, −0.421, respectively, P < 0.001 both). Worth mentioning, OSDI questionnaire scores did not correlate significantly with any of the examined dry eye parameters Table 3.
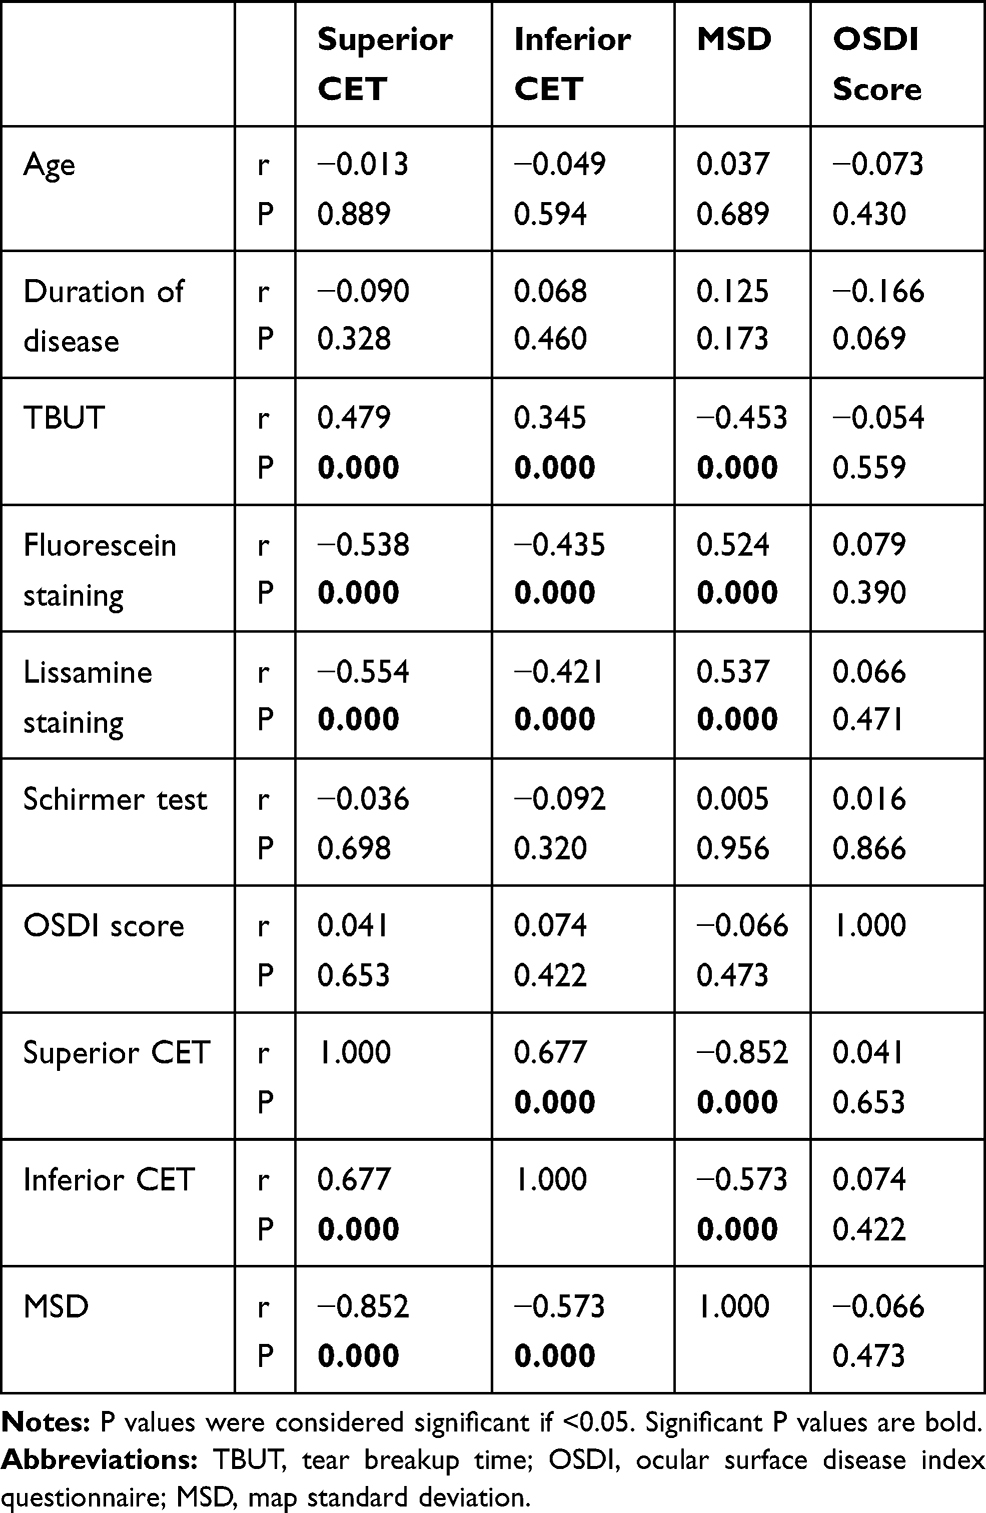 |
Table 3 Correlations Between Corneal Epithelial Thickness (CET), Map, Standard Deviation (MSD), OSDI Scores and Various Clinical Parameters in Thalassemia Group |
Noticeably, serum ferritin and LIC showed significant negative correlations with superior CET (Pearson correlation, r=−0.610, −0.472, respectively, P < 0.001 both) and inferior CET (Pearson correlation, r=−0.393, −0.340, respectively, P < 0.001 both), as well as positive correlations with MSD (Pearson correlation, r=0.668, 0.518, respectively, P < 0.001 both). When correlated to clinical dry eye tests; serum ferritin and LIC were only significantly associated with both TBUT (Pearson correlation, r=−0.392, −0.319, respectively, P < 0.001 both), ocular surface staining with fluorescein (Pearson correlation, r=0.520, 0.539, respectively, P < 0.001 both) and lissamine (Pearson correlation, r=0.505, 0.462, respectively, P < 0.001 both), in addition to OSDI scores (Pearson correlation, r=0.244, 0.333, respectively, P= 0.007, P< 0.001) Table 4.
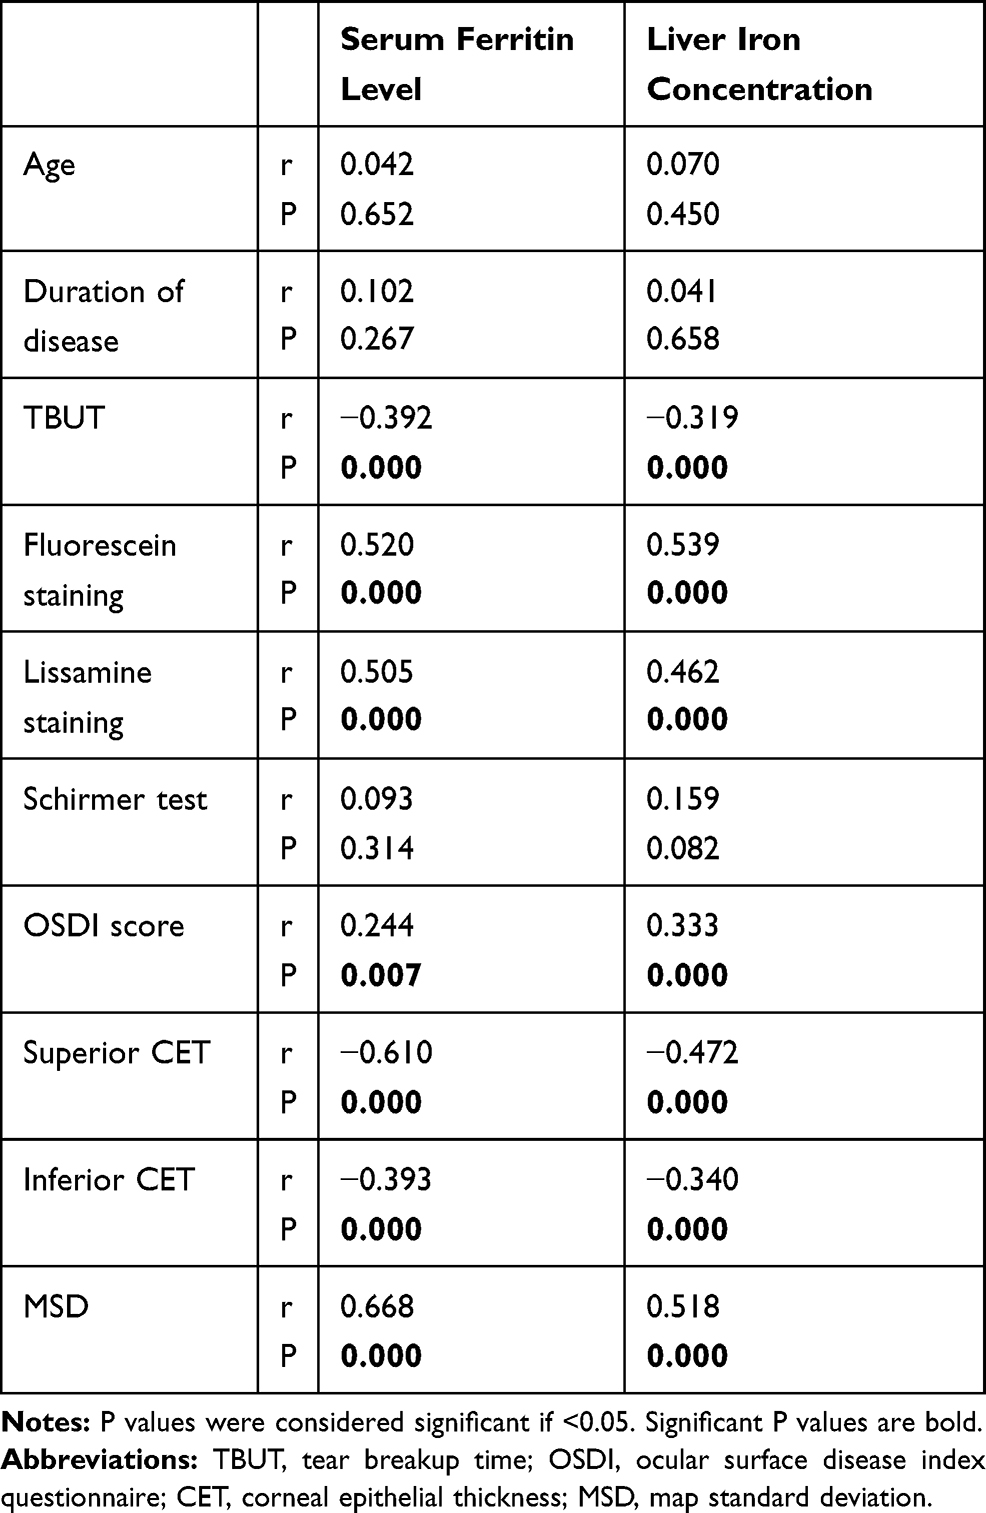 |
Table 4 Correlations Between Serum Ferritin Level, Liver Iron Concentration, Corneal Epithelial Thickness Parameters and Various Clinical Tests in Thalassemia Group |
Moreover, we compared paired superior and inferior CET in the thalassemia group and significantly thinner superior CET was noted. (paired samples t-test; t= −6.26, P< 0.001)
Slit lamp examination and fundus examination both showed no abnormalities in all participants.
Discussion
To the best of our knowledge, very few studies have addressed the issue of dry eye in young thalassemic patients,23,24 and there have been no literature discussing the CET in this cohort and correlating it with various DED clinical tests, subjective questionnaires, serum ferritin and liver iron levels.
According to our results, OSDI questionnaire score values were significantly higher in the thalassemic group compared to controls, implying more severe dry eye disease-related symptoms in thalassemic adolescents.
The challenge of objective dry eye assessment has long been argued. Corneal epithelial imaging and its quantitative evaluation potentially present a practical reproducible clinical tool for DED diagnosis; with the ease of non-contact application and speed of image acquisition by SD-OCT.25
Our study showed that corneal epithelium was thinner in the thalassemic group; in the superior as well as the inferior corneal zones. In accordance, a study by Erdelyi et al26 described thinner CET in DED and assumed that this was triggered by limbal stem cell destruction. Earlier studies hypothesized that tear hyperosmolarity in DED leads to an inflammatory process, that prompts the epithelial thickness variation.14
Nevertheless, some previous clinical studies had contradictory results. Kanellopoulos and Asimellis13 observed thicker corneal epithelium in DED, while few other reports described no change in CET in DED patients when compared to controls.14,15 Many studies are still going on regarding that relatively recent topic to reach a consensus on the epithelial thickness profile in DED patients.
Moreover, CET variability was higher as denoted by greater range of map standard deviation. In agreement, previous studies have demonstrated that quantification of corneal epithelium irregularities can provide an even more robust parameter than CET to diagnose DED.12,14
Interestingly, earlier reports have proposed that the superior CET is the primary target of dry eye damage. A mechanical theory has been proposed; where the upper lid movement, in the presence of deficient lubrication and excessive blinking in DED, continuously rubs off the corneal epithelial cells in the superior region.14 Our results empathized such findings as we demonstrated a significantly thinner superior CET as compared to inferior CET in thalassemic patients.
TBUT is still regarded as an index of tear film instability. Tear film instability is implicated in local surface dryness, surface epithelial damage and disturbance of glycocalyx and goblet cell mucins, where the latter exacerbates the tear film instability as part of the unceasing DED cascade.11
In this study, TBUT was significantly affected among thalassemic patients than the control group, and its values were correlated to CET parameters. These results imply that tear film instability might be the primary event of DED mechanism and the associated ocular surface damage in our patients.
Similar results were detected by Gartaganis and colleagues,23 who performed cytological evaluation of the conjunctival epithelium in an adult thalassemic cohort revealing conjunctival keratinization, and a decrease in the goblet cell population, thus suggesting ocular surface damage. On the contrary, Aksoy and co-workers24 found no difference in TBUT in a group of thalassemic adults in comparison to controls.
On the other hand, Schirmer test results showed insignificant differences among the two studied groups. This contradicts the findings of both studies by Aksoy et al24 and Gartaganis et al23 Worth mentioning, earlier investigations studying the sensitivity of various dry eye clinical tests showed a poor sensitivity of Schirmer test in dry eye diagnosis.27,28 This poor diagnostic sensitivity may explain our insignificant difference in Schirmer test results.
Ocular surface staining with fluorescein and lissamine green showed a significantly higher score, using Oxford schema, in the thalassemic group than the control group, and both correlated with CET parameters. A study by Barabino and colleagues29 posed the hypothesis that the extension of lissamine green staining of the conjunctiva correlates with the expression of inflammatory markers and immune cell infiltration in dry eye patients, they performed impression cytology which depicted that lissamine green staining of the conjunctiva could be related to infiltration of immune cells in the epithelial layer, opening new scenarios in the diagnosis of dry eye.29 Generally, ocular surface staining denotes nonspecific ocular surface insult and may occur in any form of DED.11
It is worthy of mention that, in our recruited thalassemic patients, serum ferritin and liver iron quantitative assessment by MRI were above normal values in most of the cases (81.7%); signifying high tissue iron levels in those patients; even though on oral iron chelator (deferasirox). The high iron overload in our patients is mostly attributable to either patient’s non-compliance to treatment, or ineffectiveness of the chelation modality in adjusting serum iron levels. High serum ferritin and LIC were correlated with CET parameters, OSDI, TBUT and ocular surface staining with fluorescein and lissamine green.
Our results suggest a close relationship between irregular, thinned CET profile and clinical DED tests together with elevated serum ferritin as well as hepatic iron overload. Thus, we can pose a hypothesis that high serum and consequently tissue iron levels could lead to tear film instability, irregular thinned CET and dry eye disease manifestations in thalassemic patients.
The insignificant correlations between OSDI questionnaire, CET parameters and various dry eye clinical tests reflect the subjective nature of the questionnaire which may not directly correlate with the presence of clinical signs. This is in accordance with other studies’ results that showed conflicting results between objective clinical signs and symptoms of dry eye disease.30–33 Studies on dry eye disease are still ongoing for reaching a consensus of clinical signs and objective tests to better capture the disease and not to rely solely on disease symptoms in diagnosis and management.
In conclusion, thalassemic adolescents had thinner corneal epithelium with higher thickness variability, shorter TBUT and more marked ocular surface staining than controls. CET is a marker of the structural damage induced by DED on the ocular surface and it could be considered as an objective method to diagnose and follow-up DED. Correlation of higher serum ferritin and hepatic iron overload with both epithelial thinning and more affected dry eye tests results advocates that high tissue iron levels could play a pivotal role in DED pathogenesis in thalassemic adolescents. Thus, we recommend that all thalassemic patients should have strict control of their iron profile to avoid tissue iron overload.
Further longitudinal studies recruiting patients with controlled serum iron levels are warranted to emphasize the role of iron overload on DED pathogenesis in thalassemics. In addition, future studies exploring the state of the meibomian glands with meibography may enrich our knowledge of the pathogenesis of DED in this cohort of patients.
Data Sharing Statement
Data supporting the results reported in the manuscript can be provided by the corresponding author upon request.
Funding
There is no funding to report.
Disclosure
The authors report no conflicts of interest for this work.
References
1. Cao A, Galanello R. Beta thalassemia. Genet Med. 2010;12(2):61–76. doi:10.1097/GIM.0b013e3181cd68ed
2. El-Shazly AA, Ebeid WM, Elkitkat RS, Deghedy MR. Electroretinographic and visual-evoked potential changes in relation to chelation modality in children with thalassemia. Retina. 2017;37(6):1168–1175. doi:10.1097/IAE.0000000000001315
3. Jethani J, Marwah K, Nikul A, et al. Ocular abnormalities in patients with beta thalassemia on transfusion and chelation therapy: our experience. Indian J Ophthalmol. 2010;58(5):451–452. doi:10.4103/0301-4738.67061
4. Taher A, Bashshur Z, Shamseddeen WA, et al. Ocular findings among thalassemia patients. Am J Ophthalmol. 2006;142(4):704–705. doi:10.1016/j.ajo.2006.04.030
5. Abdel-Malak DSM, Dabbous OAE, Saif MYS, et al. Ocular manifestations in children with β thalassemia major and visual toxicity of iron chelating agents. J Am Sci. 2012;8(7):633–638.
6. El-Shazly AA, Elkitkat RS, Ebeid WM, Deghedy MR. Correlation between subfoveal choroidal thickness and foveal thickness in thalassemic patients. Retina. 2016;36(9):1767–1772. doi:10.1097/IAE.0000000000000970
7. Wu CH, Yang CP, Lai CC, et al. Deferoxamine retinopathy: spectral domain-optical coherence tomography findings. BMC Ophthalmol. 2014;2(14):88–90. doi:10.1186/1471-2415-14-88
8. Carpino A, De Sanctis V, Siciliano L, et al. Epididymal and sex accessory gland secretions in transfusion dependent beta thalassemic patients: evidence of an impaired prostatic function. Exp Clin Endocrinol Diabetes. 1997;105:
9. Takeda Y, Yamamoto H. Iron deposits in the human labial minor salivary glands: a postmortem study. J Nihon Univ Sch Dent. 1989;31:
10. Vrielinck LJ, van Parys G, van Damme B, et al. Sicca syndrome with iron deposition in the salivary glands. Int J Oral Maxillofac Surg. 1988;17:
11. Craig JP, Nichols KK, Akpek EK, et al. TFOS DEWS II definition and classification report. Ocul Surf. 2017;15(3):276–283.
12. Abou Shousha M, Wang J, Kontadakis G, et al. Corneal epithelial thickness profile in dry-eye disease. Eye. 2020;34:915–922. doi:10.1038/s41433-019-0592-y
13. Kanellopoulos AJ, Asimellis G. In vivo 3-dimensional corneal epithelial thickness mapping as an indicator of dry eye: preliminary clinical assessment. Am J Ophthalmol. 2014;157:63–68.e2. doi:10.1016/j.ajo.2013.08.025
14. Cui X, Hong J, Wang F, et al. Assessment of corneal epithelial thickness in dry eye patients. Optom Vis Sci. 2014;91:1446–1454. doi:10.1097/OPX.0000000000000417
15. Francoz M, Karamoko I, Baudouin C, Labbe A. Ocular surface epithelial thickness evaluation with spectral-domain optical coherence tomography. Invest Ophthalmol Vis Sci. 2011;52:9116Y23. doi:10.1167/iovs.11-7988
16. Moon JH, Lee MY, Moon NJ. Association between video display terminal use and dry eye disease in school children. J Pediatr Ophthalmol Strabismus. 2014;51(2):87–92. doi:10.3928/01913913-20140128-01
17. Zamani F, Razmjou S, Akhlaghpoor S, Eslami SM, Azarkeivan A, Amiri A. T2*magnetic resonance imaging of the liver in thalassemic patients in Iran. China Natl J N Gastroenterol. 2001;17(4):522–525.
18. Rufer A, Bapst C, Benz R, et al. Role of magnetic resonance imaging in hyperferritinaemia and the diagnosis of iron overload. Swiss Med Wkly. 2017;147:45–46.
19. Schiffman RM, Christianson MD, Jacobsen G, et al. Reliability and validity of the ocular surface disease index. Arch Ophthalmol. 2000;118(5):615–621. doi:10.1001/archopht.118.5.615
20. Walt JG, Rowe MM, Stern KL. Evaluating the functional impact of dry eye; the ocular surface disease index (abstract). Drug Inf J. 1997;31:1436.
21. Haga HJ, Naderi Y, Moreno AM, Peen E. A study of the prevalence of sicca symptoms and secondary Sjögren’s syndrome in patients with rheumatoid arthritis, and its association to disease activity and treatment profile. Int J Rheum Dis. 2012;15(3):
22. Bron A, Evans VE, Smith JA. Grading of corneal and conjunctival staining in the context of other dry eye tests. Cornea. 2003;22(7):640–650. doi:10.1097/00003226-200310000-00008
23. Gartaganis SP, Georgakopoulos CD, Exarchou A, et al. Alterations in conjunctival cytology and tear film dysfunction in patients with beta-thalassemia. Cornea. 2003;22(7):591–597. doi:10.1097/00003226-200310000-00002
24. Aksoy A, Aslankurt M, Aslan L, et al. Ocular findings in children with thalassemia major in Easter Mediterranean. Int J Ophthalmol. 2014;7(1):118–121.
25. Kanellopoulos AJ, Asimellis G. In vivo three-dimensional corneal epithelium imaging in normal eyes by anterior segment optical coherence tomography: a clinical reference study. Cornea. 2013;32(11):1493–1498. doi:10.1097/ICO.0b013e3182a15cee
26. Erdelyi B, Kraak R, Zhivov A, Guthoff R, Nemeth J. In vivo confocal laser scanning microscopy of the cornea in dry eye. Graefes Arch Clin Exp Ophthalmol. 2007;245:39Y44.
27. Lucca JA, Nunez JN, Farris RL. A comparison of diagnostic tests for keratoconjunctivitis sicca: lacto plate, Schirmer, and tear osmolarity. CLAO J. 1990;16(2):109–112.
28. Versura P, Frigato M, Cellini M, et al. Diagnostic performance of tear function tests in Sjogren’s syndrome patients. Eye (Lond). 2007;21(2):229–237. doi:10.1038/sj.eye.6702204
29. Barabino S, Valente C, Montaldo E, et al. Does lissamine green staining of the ocular surface correlate with inflammation in dry eye patients? Invest Ophthalmol? Vis Sci. 2012;53:
30. Mizuno Y, Yamada M, Miyake Y; Dry Eye Survey Group of the National Hospital Organization of Japan. Association between clinical diagnostic tests and health-related quality of life surveys in patients with dry eye syndrome. Japan J Ophthalmol. 2010;54:259–265. doi:10.1007/s10384-010-0812-2
31. Sullivan BD, Whitmer D, Nichols KK, et al. An objective approach to dry eye disease severity. Invest Ophthalmol Vis Sci. 2010;51(12):6125–6130. doi:10.1167/iovs.10-5390
32. Fuentes-Paez G, Ferreras JM, Cordero Y, et al. Lack of concordance between dry eye syndrome questionnaires and diagnostic tests. Arch Socie Españ Oftalmol. 2011;86(1):3–7.
33. Sullivan BD, Crews LA, Messmer EM, et al. Correlations between commonly used objective signs and symptoms for the diagnosis of dry eye disease: clinical implications. Acta Ophthalmol. 2014;92(2):161–166. doi:10.1111/aos.12012
 © 2021 The Author(s). This work is published and licensed by Dove Medical Press Limited. The
full terms of this license are available at https://www.dovepress.com/terms
and incorporate the Creative Commons Attribution
- Non Commercial (unported, 3.0) License.
By accessing the work you hereby accept the Terms. Non-commercial uses of the work are permitted
without any further permission from Dove Medical Press Limited, provided the work is properly
attributed. For permission for commercial use of this work, please see paragraphs 4.2 and 5 of our Terms.
© 2021 The Author(s). This work is published and licensed by Dove Medical Press Limited. The
full terms of this license are available at https://www.dovepress.com/terms
and incorporate the Creative Commons Attribution
- Non Commercial (unported, 3.0) License.
By accessing the work you hereby accept the Terms. Non-commercial uses of the work are permitted
without any further permission from Dove Medical Press Limited, provided the work is properly
attributed. For permission for commercial use of this work, please see paragraphs 4.2 and 5 of our Terms.