Back to Journals » Clinical Ophthalmology » Volume 19
Evaluation of Corneal Epithelial Thickness Across Different Stages of Diabetic Retinopathy Using Anterior Segment OCT
Authors Lin Y ![]() , Zhao Z, Ma D, Ma Y, Chen S, Cai C, Xiong Y
, Zhao Z, Ma D, Ma Y, Chen S, Cai C, Xiong Y ![]()
Received 31 May 2025
Accepted for publication 13 October 2025
Published 21 October 2025 Volume 2025:19 Pages 3889—3898
DOI https://doi.org/10.2147/OPTH.S544040
Checked for plagiarism Yes
Review by Single anonymous peer review
Peer reviewer comments 2
Editor who approved publication: Dr Scott Fraser
Yongdong Lin, Zifeng Zhao, Di Ma, Yueting Ma, Shirong Chen, Chang Cai, Yongqun Xiong
Department of Ophthalmology, Joint Shantou International Eye Center of Shantou University and The Chinese University of Hong Kong, Shantou, Guangdong, People’s Republic of China
Correspondence: Yongqun Xiong, Joint Shantou International Eye Center of Shantou University and The Chinese University of Hong Kong, Dong xia Road, Shantou, Guangdong, People’s Republic of China, Email [email protected]
Purpose: To compare the corneal epithelial thickness (CET), the density and number of central corneal subbasal nerve plexus (CSNP) between controls and different types of diabetic retinopathy in type 2 diabetics.
Methods: This cross-sectional study included participants who underwent a comprehensive evaluation comprising anterior segment optical coherence tomography, Keratograph 5M, fluorescein tear break-up time, and in vivo confocal corneal microscopy. Based on the Early Treatment Diabetic Retinopathy Study classification, patients with diabetes were categorized into no diabetic retinopathy (NDR) group, non-proliferative diabetic retinopathy (NPDR) group, and proliferative diabetic retinopathy (PDR) group.
Results: A total of 75 eyes were examined— 20 eyes from 20 control subjects and 55 eyes from 55 patients with diabetes (20 NDR, 14 NPDR, 21 PDR). Compared to controls, diabetic eyes exhibited significant increases in corneal thickness (CT) in each region (all P < 0.05), as well as a decrease in CSNP density (15.18 ± 2.60 vs 11.77 ± 3.77, P = 0.040) and number (39.27 ± 6.87 vs 28.67 ± 9.71, P < 0.001). In the PDR group, CET in all areas (except at 6 mm) was significantly thinner (all P < 0.05). Univariate analysis indicated that central CET and CET measured 2 mm from the center were associated with age, CSNP density, and superior meibomian gland dropout. Multivariate analysis identified CSNP density as the only significant factor associated with CET (P < 0.05).
Conclusion: Diabetic eyes exhibit a reduction in CSNP density and number and an increase in CT. CET is significantly thinner in patients with PDR. Furthermore, CET correlates with CSNP density.
Keywords: central corneal subbasal nerve, corneal epithelial thickness, ocular surface parameter, diabetes mellitus, corneal thickness
Introduction
Diabetes mellitus (DM) is a complex metabolic disease characterized by chronic hyperglycemia.1 In 2017, the global prevalence of diabetes was approximately 476 million, and it is estimated that this number will rise to 642 million by 2040. Among individuals with diabetes, an estimated 46–64% develop diabetic epithelial keratopathy (DEK).2 DEK encompasses a spectrum of corneal epithelial abnormalities, including persistent epithelial defects, superficial punctate keratopathy, delayed epithelial regeneration, and reduced corneal sensitivity, representing a significant component of diabetic ocular surface disease.3
The corneal epithelium plays a crucial role in protecting the ocular surface from environmental factors, maintaining the integrity and optical clarity of the eye. In clinical practice, fluorescein staining is commonly used to detect epithelial defects. Emerging evidence suggests that diabetes induces notable changes in corneal epithelial thickness (CET), which are linked to the pathogenesis of diabetic eye complications, including dry eye syndrome, recurrent corneal erosion, and delayed wound healing.3 CET has been assessed using in vivo confocal microscopy (IVCM), which provides detailed imaging of corneal microstructure. However, its semi-invasive nature limits large-scale clinical use.3 Previous IVCM study reported decreased density, increased cell area, and widened intercellular spaces in the corneal epithelial basal cells of patients with type 2 diabetes.4 Recently, anterior segment optical coherence tomography (AS-OCT) has served as a non-invasive and rapid method for assessing CET. Yusufogluet al5 used AS-OCT to show that CET in diabetic patients is thinner than in healthy controls. However, there are few related studies. Furthermore, there is no research on CET changes at various stages of diabetic retinopathy.
IVCM has become a standard tool for evaluating living cornea.6 This instrument exhibits good repeatability and reproducibility in assessing corneal nerves in both healthy controls and patients with DM.7,8 Studies using IVCM showed that central corneal subbasal nerve plexus (CSNP) decreased with the progression of diabetes.9 Is the thinning of CET associated with the decline in CSNP? There is a lack of research addressing this relationship. Furthermore, investigating changes in CET and their correlation with ocular surface parameters may provide insights into mitigating epithelial lesions in these patients.
Therefore, the purpose of this study was to compare CET, as well as the density and number of CSNP, between control subjects and patients with type 2 diabetes (no diabetic retinopathy (NDR) group, non-proliferative diabetic retinopathy (NPDR) group, and proliferative diabetic retinopathy (PDR) group). Furthermore, to investigate the correlation between CET, CSNP density, and ocular surface parameters.
Materials and Methods
Diabetic patients were enrolled from the diabetes clinic of the Joint Shantou International Eye Center (JSIEC). Each patient was informed about the study’s purpose and procedures. The study protocol was approved by the Ethics Committee of JSIEC of Shantou University and the Chinese University of Hong Kong (Shantou City, China) (EC20210803(6)-P02). The study followed the tenets of the Declaration of Helsinki. Written informed consent was obtained from all patients. According to the Early Treatment Diabetic Retinopathy Study, patients were divided into NDR group, NPDR group and PDR group.10 The healthy control group was retrospectively selected from individuals who had previously visited JSIEC for examinations and met the inclusion criteria. Due to the retrospective nature of their inclusion, informed consent from the healthy controls was waived. Given that CET was the primary parameter of interest, the required sample size of diabetic and control groups was calculated based on CET data. The formula used was:
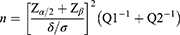
where n is the total sample size, α represents the probability of a type I error, and β represents the probability of a type II error (for α = 0.05, β = 0.1, power = 0.9). Based on previous reference5 (δ = 3.68, σ = 3.67), and assuming the diabetic group size was twice that of the control group (Q1 = 1/3, Q2 = 2/3), the calculation yielded n = 48, with n1 = 16 controls and n2 = 32 patients with diabetes.
This cross-sectional study included all participants who underwent comprehensive ophthalmic examinations, comprising measurements of intraocular pressure (IOP) measurement, best-corrected visual acuity (BCVA), fluorescein tear break-up time (FBUT), Schirmer 1 test, Keratograph 5M, IVCM and AS-OCT examination. The examination sequence was as follows: AS-OCT, Keratograph 5M (except infrared meibography), FBUT, Schirmer 1 test, infrared meibography and IVCM. Then the pupils were dilated for fundus examination to determine the stage of retinopathy in all diabetic patients.
Diabetic patients were required to have a diagnosis of type 2 diabetes mellitus. In cases where both eyes met the inclusion criteria, only the right eye was selected for evaluation. The inclusion criteria of healthy eyes were as follows: 1. age: > 18 years old. 2. intraocular pressure ≤ 21mmHg. 3. normal anterior chamber, open-angle and normal fundus in clinical examination. Exclusion criteria for all participants included: 1) history of ocular laser or intraocular surgery, history of ocular trauma, use of contact lenses, presence of retinopathy other than diabetic retinopathy, uveitis, glaucoma, or any systemic diseases (such as Sjögren’s syndrome or Stevens–Johnson syndrome) that could impact corneal health; 2) inability to cooperate during examinations; 3) ≥6.0 D (sphere) or 3.0 D (cylinder).
Anterior Segment Optical Coherence Tomography System
The corneal thickness (CT) and CET were evaluated using the scanning mode of an anterior segment in an OCT device (Shiwei Medical Technology Co., Ltd.; China; Machine Model: VG2001). Average values of CT and CET were calculated at the central cornea and at distances of 2 mm, 4 mm, and 6 mm from the center (Figure 1).
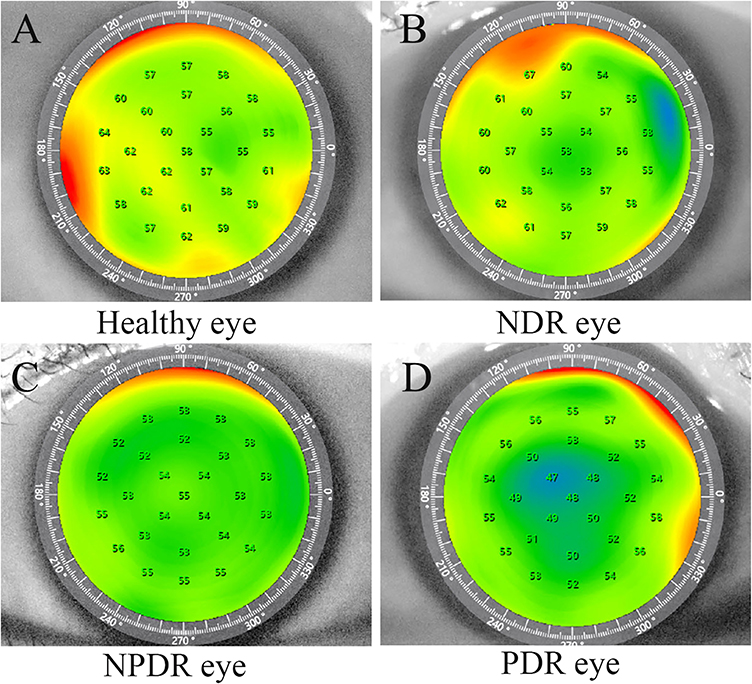 |
Figure 1 Anterior segment optical coherence tomography images of the corneal epithelial thickness in the right eye of (A) healthy eye, (B) type 2 diabetes mellitus (DM) eye without diabetic retinopathy (NDR), (C) type 2 DM eye with non-proliferative diabetic retinopathy (NPDR), (D) type 2 DM eye with proliferative diabetic retinopathy (PDR). |
In vivo Confocal Microscopy
The details of IVCM (Heidelberg Retinal Tomograph II with Rostock Corneal Module; Heidelberg Engineering GmbH, Heidelberg, Germany) have been described before.11 The scanning area targeted the CSNP within the pupillary region, with a scanning depth of approximately 40 to 60μm.12 To measure CSNP density, three representative images were selected from different positions, ensuring less than 20% overlap between them. All visible nerve fibers in each image were tracked, and their density was calculated using NeuronJ software, a semi-automated plug-in for ImageJ software (National Institutes of Health, Bethesda, MD).13 CSNP density is defined as the total length of nerves visible in a frame (expressed in mm/ mm2), while the number of CSNP is defined as the sum of long nerve fiber bundles observed in a frame (expressed in number/mm2).14 All measurements in this study were conducted by an independent masked observer (YM), and the average value of the three IVCM images was calculated.
Ocular Surface Parameter Assessments
Tear meniscus height, first non-invasive tear film break-up time (NIBUT-first), and average non-invasive tear film break-up time (NIBUT-average) were measured using the Keratograph 5M (K5M; Oculus, Optikgeräte, Germany), as previously reported.15 Additionally, FBUT and the Schirmer 1 test were conducted. The superior and inferior eyelids were everted in succession to perform infrared meibography using the Keratograph 5M. Images were analyzed using semi-automated ImageJ software to calculate the percentage of meibomian gland (MG) dropout.16,17 For the FBUT test, a 2% fluorescein dye was applied to the eyes. The time from the last blink to the appearance of the first dry spot was recorded, and this process was repeated three times to obtain an average value for analysis.
Statistical Analyses
Statistical analyses were conducted using SPSS software (version 22.0; SPSS Inc, Chicago, IL). The Shapiro–Wilk test was performed to evaluate the normal distribution of continuous variables. Comparisons between diabetic eyes and healthy controls were made using independent t-tests, the nonparametric Mann–Whitney test, and chi-square tests. One-way analysis of variance (ANOVA) was employed to compare parameters among the three groups (NDR, NPDR, and PDR), with post hoc pairwise comparisons conducted using Tukey’s honest significant difference (HSD) test. Univariate and multivariate regression analyses were performed to identify clinical factors associated with CET and CSNP in diabetic eyes. A p value of < 0.05 was considered to be statistically significant.
Results
In this study, 20 eyes of 20 normal controls and 55 eyes of 55 diabetic patients were enrolled (20 NDR, 14 NPDR and 21 PDR). Compared to the control group, there was a significant increase in superior MG dropout in diabetic patients (17.4 ± 6.7 vs 27.9 ± 11.4, P < 0.001), as well as aggravated inferior MG dropout (17.6 ± 5.5 vs 27.7 ± 10.9, P < 0.001). Additionally, both the density (15.18 ± 2.60 vs 11.77 ± 3.77, P = 0.040) and number of CSNP decreased (39.27 ± 6.87 vs 28.67 ± 9.71, P < 0.001). The CT, measured at the center and distances of 2 mm, 4 mm, and 6 mm from the center, increased in diabetic patients (all P < 0.05). There were no statistically significant differences in age, sex, FBUT, NIBUT-first, NIBUT-average, Schirmer 1 test, tear meniscus height, or CET (including measurements at the center and at 2 mm, 4 mm, and 6 mm from the center) between the DM group and the control group (all P > 0.05) (Table 1).
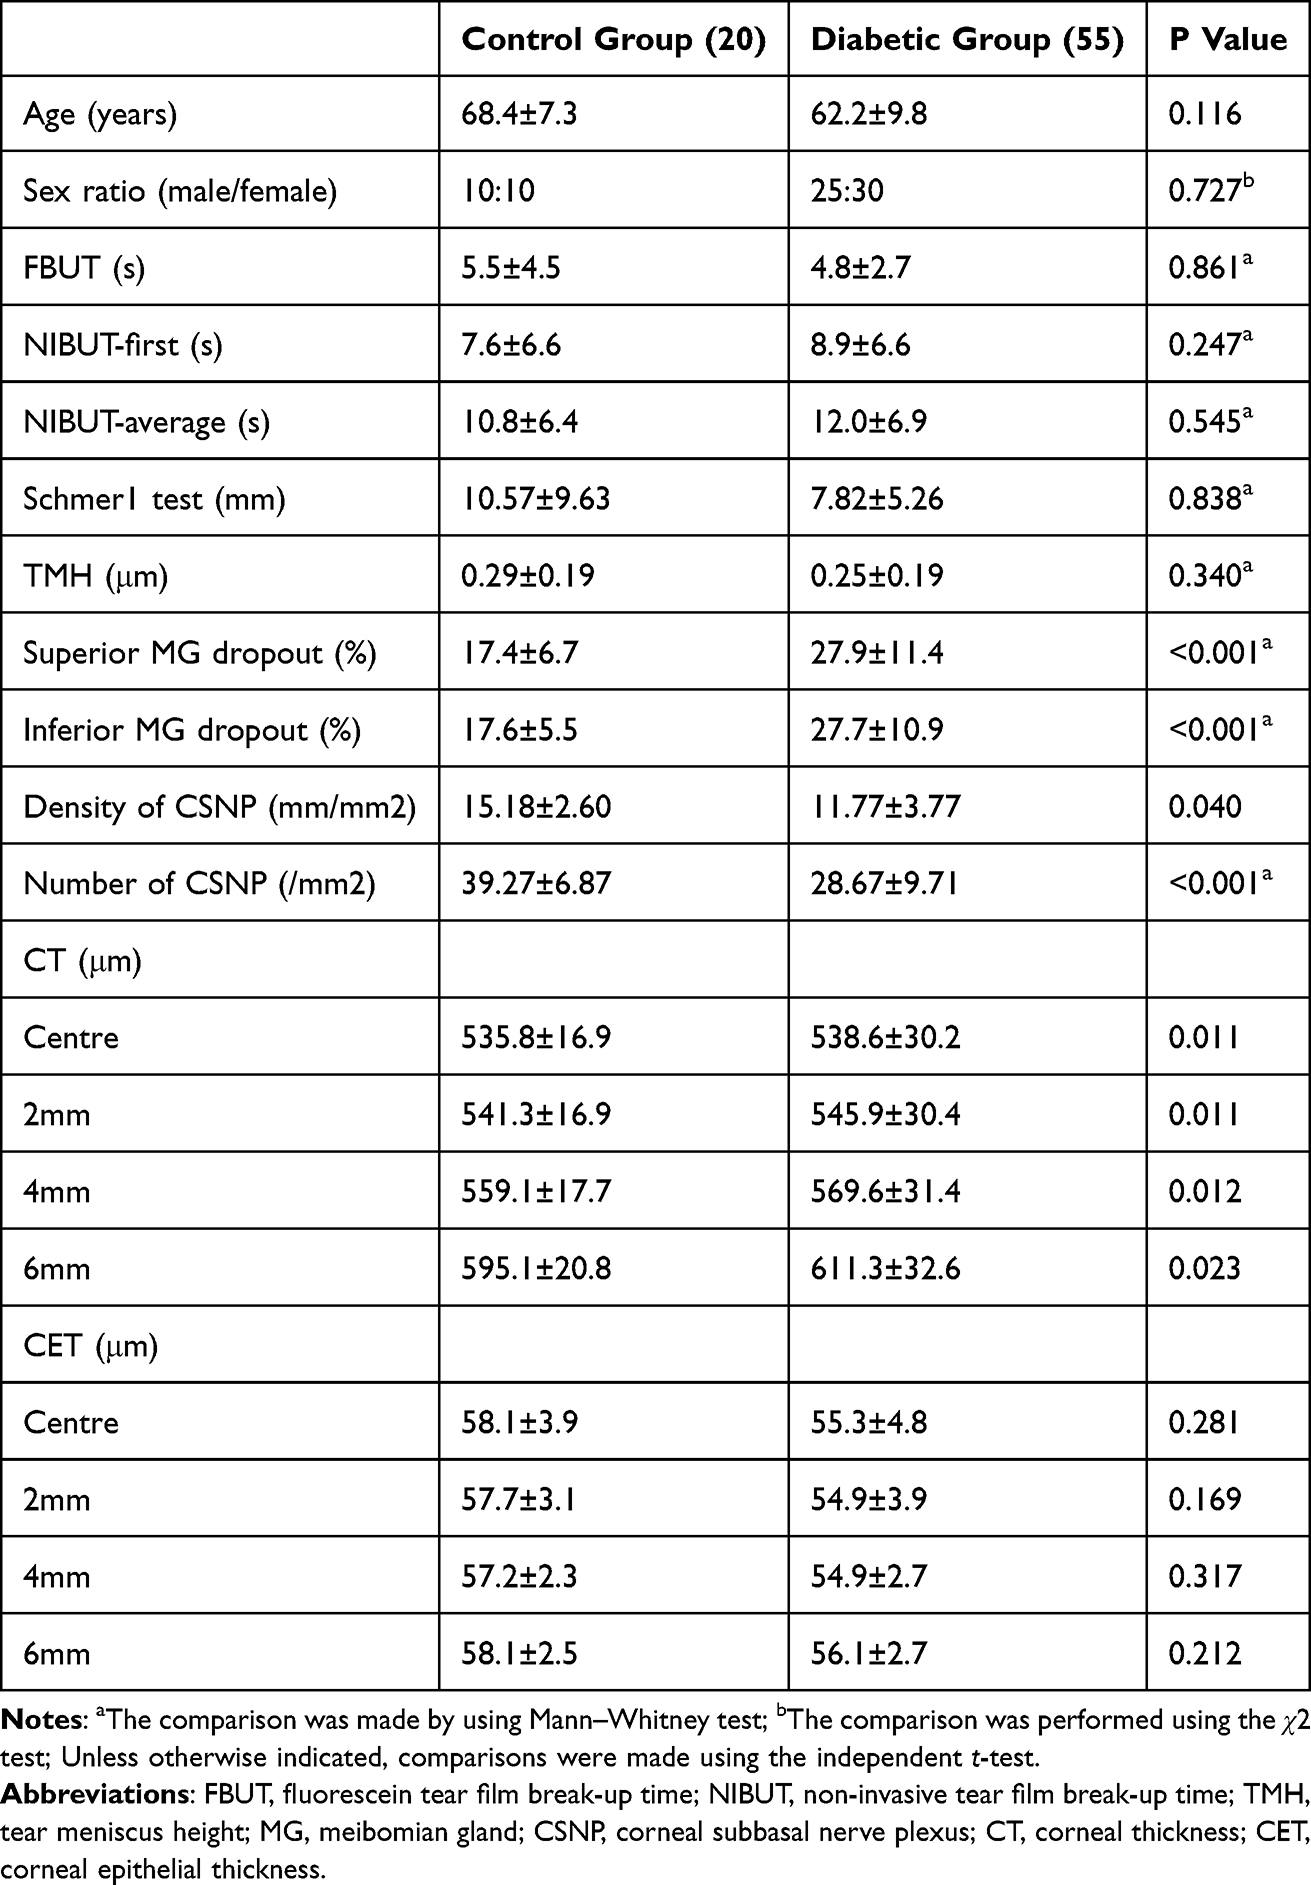 |
Table 1 Demographic and Clinical Characteristics in Control and Diabetic Groups |
Table 2 presents the comparison of demographic and clinical indices among the three groups of diabetic patients. As retinopathy progressed, both CSNP density and number decreased. However, pairwise comparisons revealed statistical significance only between the PDR and NDR groups (P < 0.05). Representative images of the corneal CSNP at various stages are illustrated in Figure 2. Additionally, compared to the NPDR group, PDR patients exhibited decreased FBUT, thinning of CET in all areas (except at 6 mm from the center), and more severe dropout of both superior and inferior MGs (all P < 0.05). Furthermore, compared to the NDR group, the CET at the center and 2 mm from the center in the PDR group decreased, accompanied by increased dropout of both superior and inferior MGs (all P < 0.05).
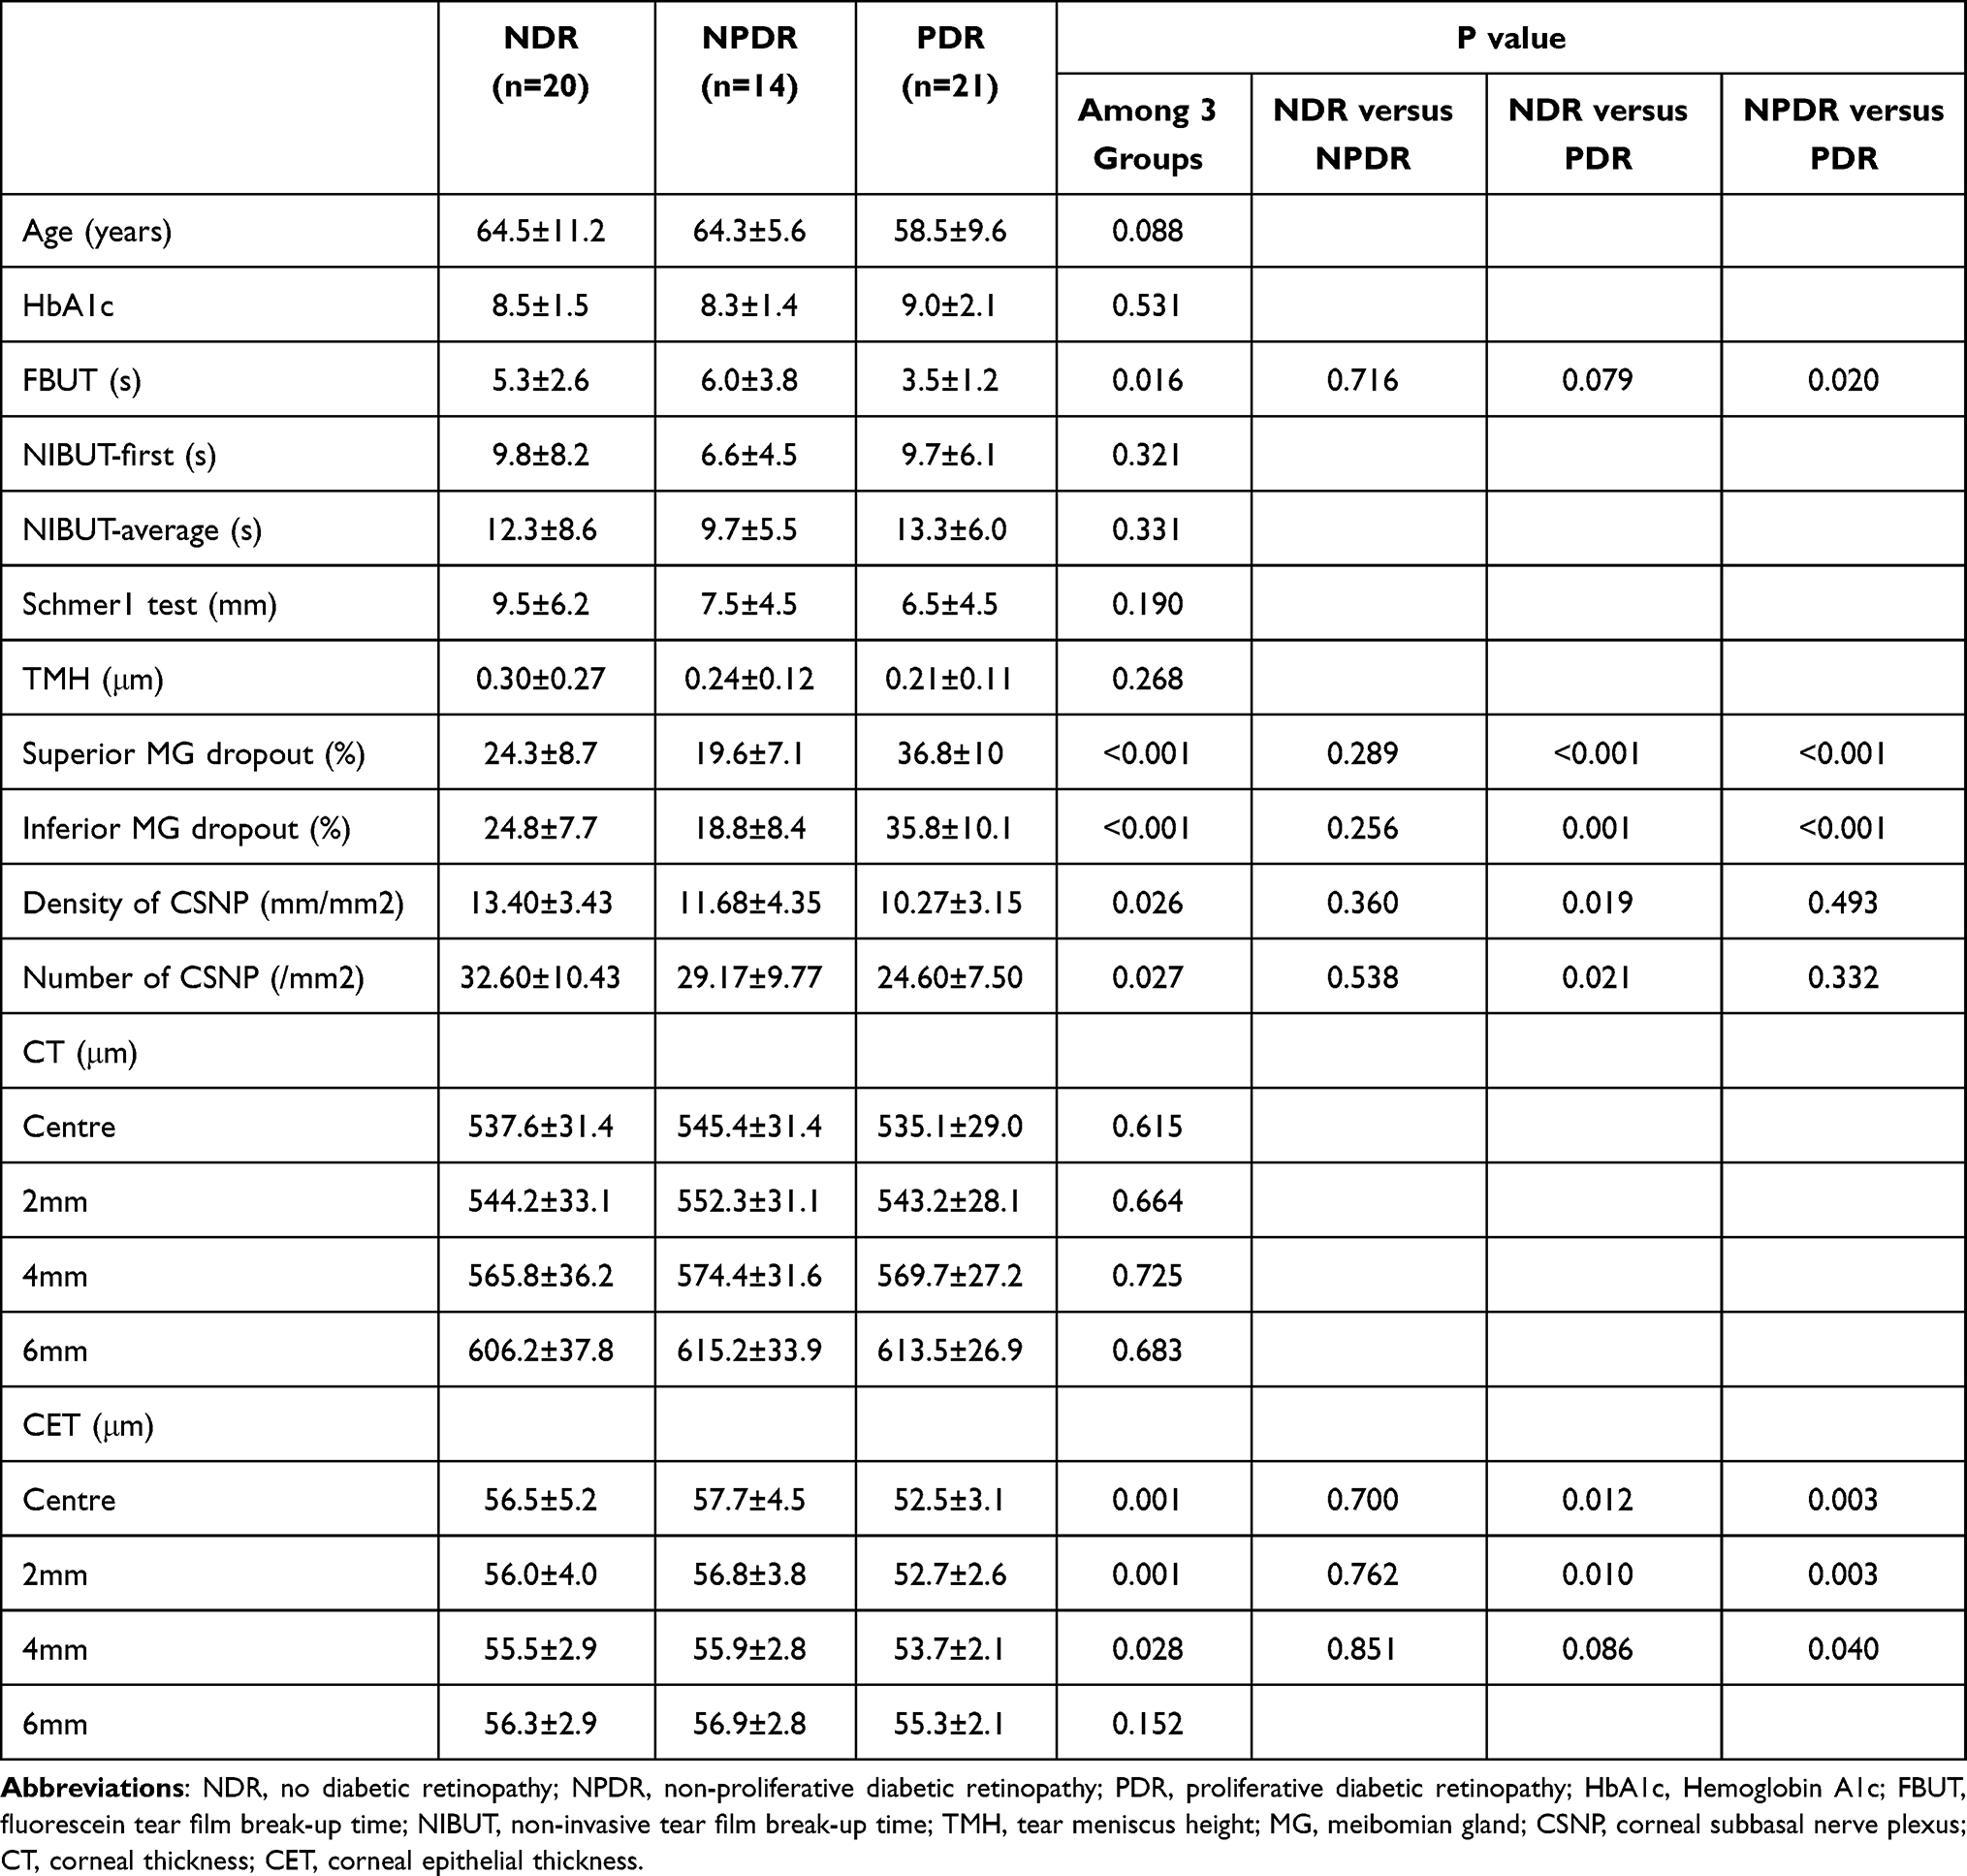 |
Table 2 Demographic and Clinical Characteristics Among the Three Groups of Diabetic Patients |
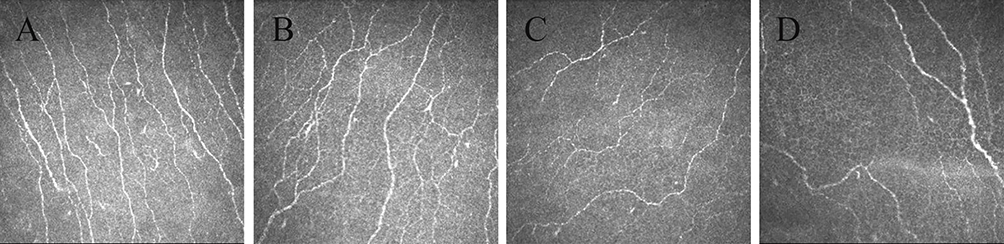 |
Figure 2 In vivo confocal microscopy images of the central corneal subbasal nerve plexus (CSNP) in (A) healthy eye, (B) diabetes mellitus (DM) eye without diabetic retinopathy (DR), (C) DM eye with non-proliferative DR (NPDR), (D) DM eye with proliferative DR (PDR). |
Factors Related to Central Corneal Epithelial Thickness, Epithelial Thickness 2mm from Center and Central Corneal Subbasal Nerve Plexus in Diabetic Patients
In diabetic patients, the relationships between the central CET and CET 2mm from the center, and various clinical factors were evaluated by univariate and multivariate regression analysis (Table 3). Univariate analysis indicated that both central CET and CET 2 mm from the center were associated with age, CSNP density, and superior MG dropout. However, multivariate analysis revealed that these thickness measures were only significantly positively related to CSNP density (all P < 0.05). Furthermore, the relationship between CSNP and various clinical factors in diabetic patients was examined through univariate analysis (Table 4). It was found that CSNP density was significantly associated only with the results of the Schirmer 1 test (P = 0.014).
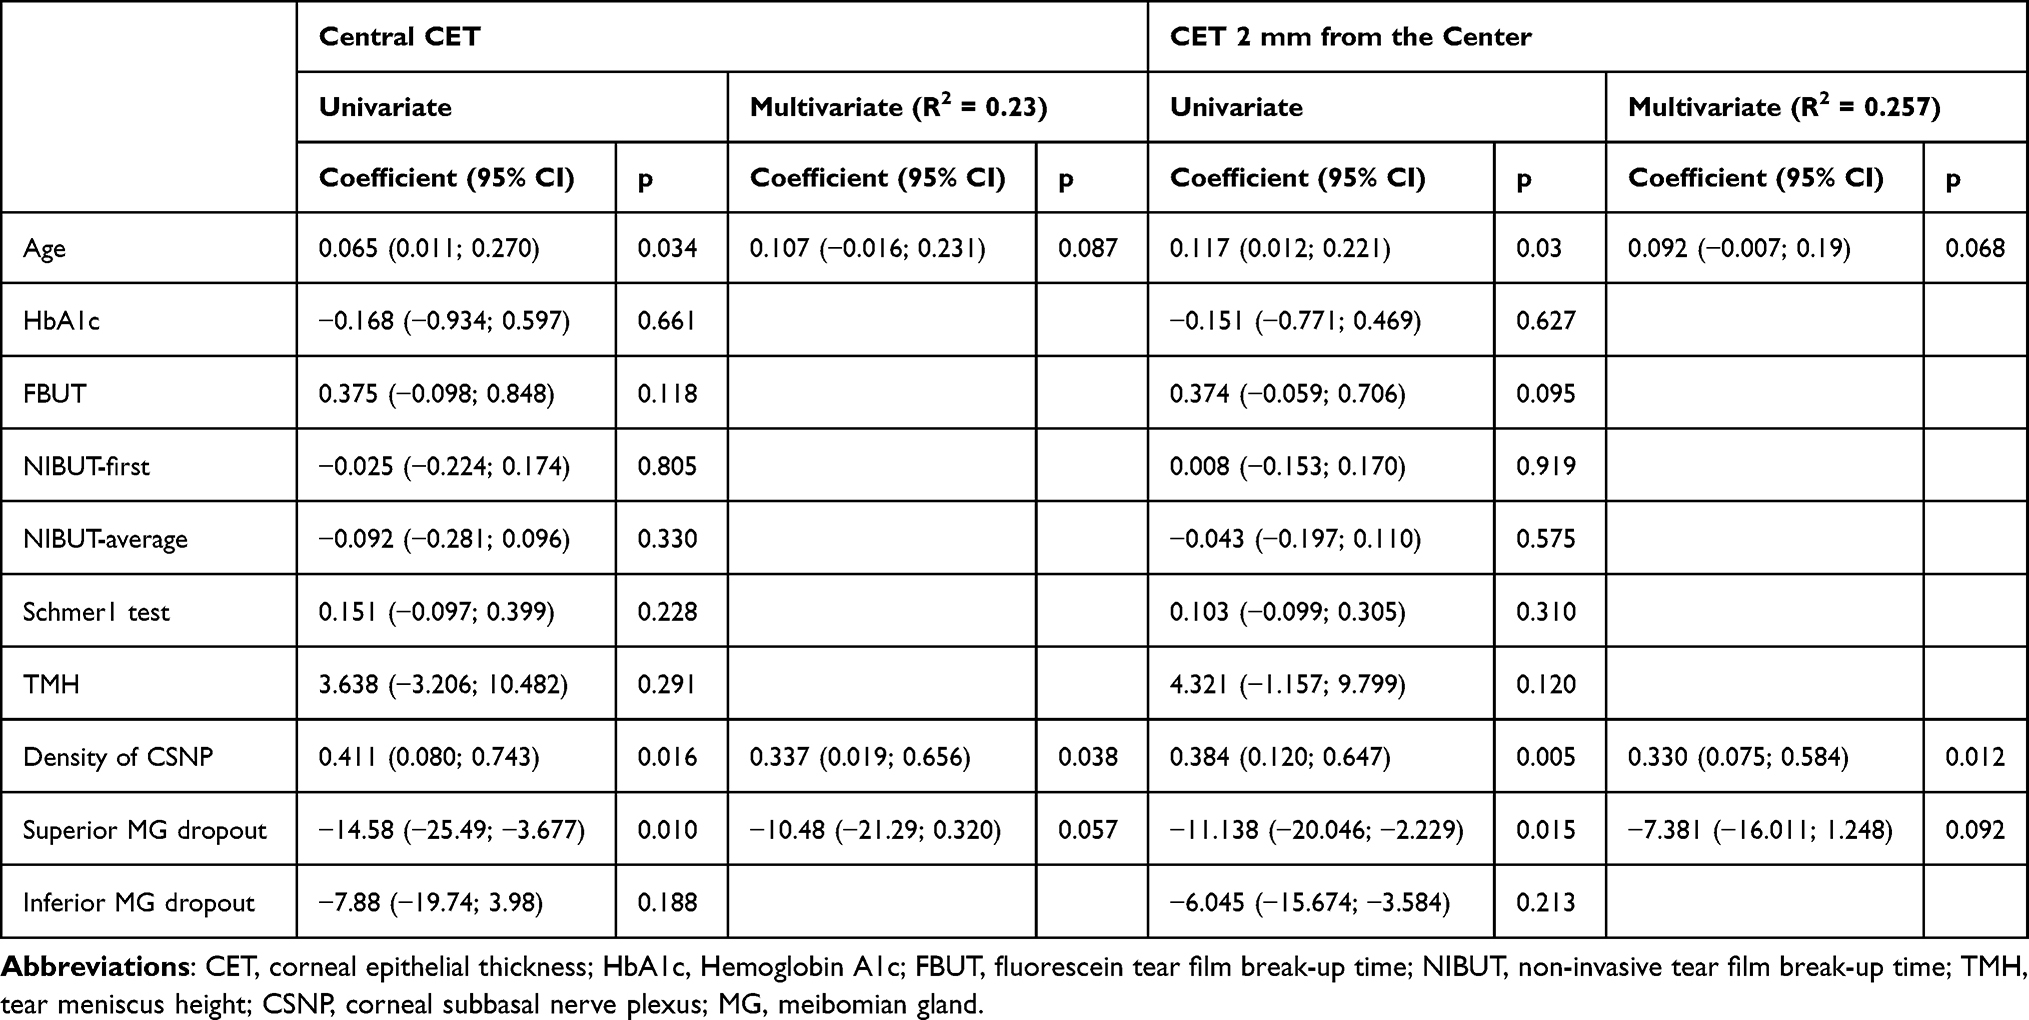 |
Table 3 Univariate and Multivariate Regression Analyses to Identify Clinical Factors Associated with Corneal Epithelial Thickness |
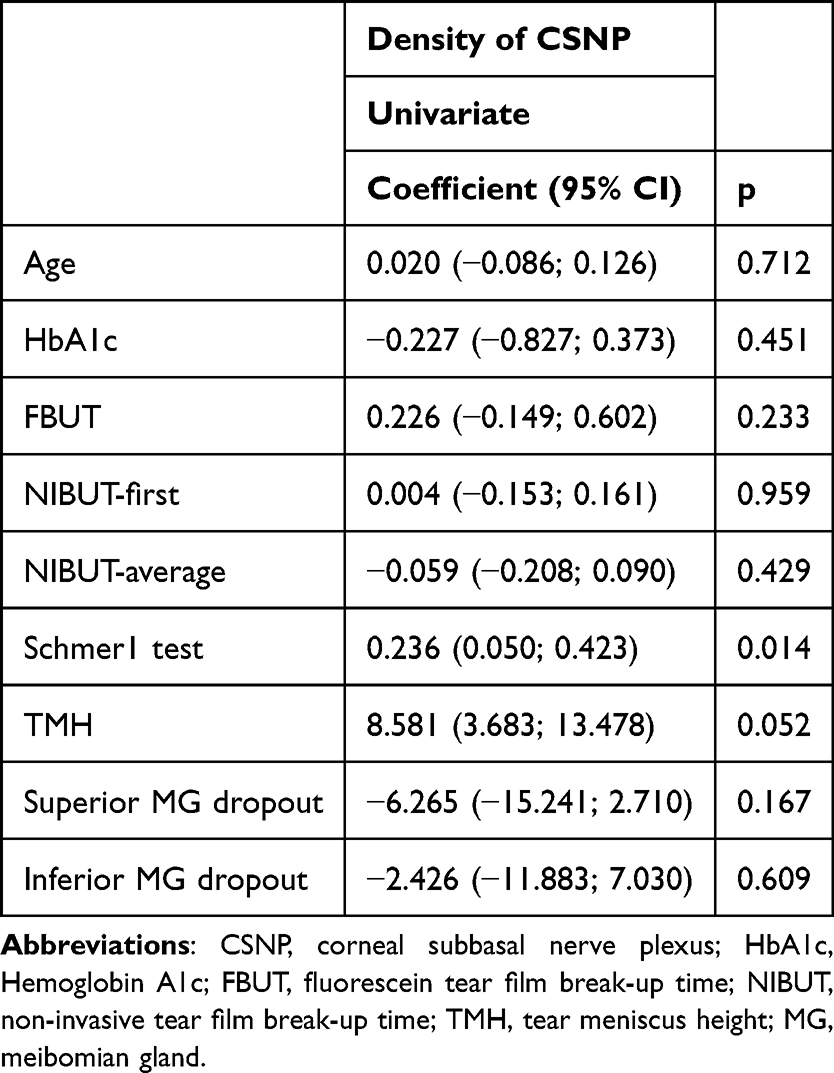 |
Table 4 Univariate Regression Analyses to Identify Clinical Factors Associated with Corneal Subbasal Nerve Plexus |
Discussion
Diabetic patients are at an increased risk of epithelial lesions, particularly following intraocular surgery.3 Evaluating CET and its influencing factors in diabetic patients may aid in reducing the incidence of these lesions. Our study revealed that, compared to the control eyes, there was an aggravated dropout of the MG, a reduction in both the density and number of CSNP, and a thickening of CT in diabetic eyes. As retinopathy worsened, the density and number of CSNP decreased. Additionally, CET was found to be related to CSNP density, which was also associated with Schirmer I test results. This study is the first to investigate the correlation between CET, as measured by AS-OCT, and CSNP in diabetic patients.
Our findings support previous research indicating that, with the progression of diabetic retinopathy, both the density and number of CSNP decrease.9,18–20 Akkul et al9 studied 84 diabetic patients and found that the length and density of CSNP, along with corneal nerve branch density, diminished as diabetic retinopathy progressed. Bitirgen et al18 studied 132 eyes of 132 patients with type 2 DM and 32 eyes of 32 healthy controls, finding that compared to control subjects, patients in NDR group had reduced CSNP density, corneal nerve branch density, and corneal nerve fiber length, all of which deteriorated with increasing severity of retinopathy.
No significant difference in CET was observed between the diabetic group and the control group. However, subgroup analysis of diabetic patients revealed that patients in the PDR group had significantly thinner CET. Similarly, Yusufoglu et al5 utilized AS-OCT to study 72 diabetic patients and reported that CET was thinner in the PDR group. Our study also demonstrated a correlation between CET and the density of CSNP. A possible explanation for this relationship is that the metabolism of corneal epithelial cells relies on corneal nerves, which supply essential nutrients, such as calcitonin gene-related peptide, to these cells.21 The reduction in CSNP density may diminish nutrient supply, potentially leading to dysfunction and loss of basal epithelial cells, ultimately resulting in a thinner CET. Our findings suggest that in the later stages of diabetic disease, the corneal epithelium is significantly thinned following severe nerve injury. Conversely, the decreased nerve density may initially prolong the healing time of the corneal epithelium due to the dysfunction of basal epithelial cells. Qu et al22 found that patients with corneal punctate epitheliopathy in type 2 DM had significantly lower corneal nerve density compared to those without diabetes, and these patients also experienced longer healing times.
This study found that CT in the diabetic group was thicker than that in the control group, with no significant differences observed among the three diabetic subgroups. This finding is consistent with previous studies.5,23 Andrea et al23 studied 60 eyes of 30 diabetic patients and 60 eyes of 30 healthy individuals using AS-OCT, reporting that CT increased in various areas of diabetic eyes. Similarly, Yusufoglu et al5 demonstrated that CT in diabetic patients was thicker than in healthy individuals, with no differences noted between the PDR and NPDR groups. The thickening of CT may be attributed to proteins or lipids that undergo glycosylation upon exposure to elevated sugar levels, forming advanced glycation end products. These products can induce non-enzymatic crosslinking between collagen and proteoglycan molecules in the corneal stroma, thereby increasing corneal thickness.3,24
Our study found no statistical differences in FBUT, NIBUT-first, NIBUT-average, Schmer1 test, or tear meniscus height between the diabetic group and the control group, which was inconsistent with some previous studies.5,25,26 Yusufoglu et al5 showed that the Schmer 2 test and FBUT in diabetic group were lower. Some previous studies have shown that dry eye has a significant correlation with the course of DM, and dry eye is more common in diabetic retinopathy patients, particularly in those with PDR.25,26 Some studies are similar to our findings.23,27 Lyu et al27 studied 87 eyes of 87 diabetic patients and 49 eyes of 49 healthy subjects, reporting no significant differences in Schirmer 1 test results, FBUT, or tear meniscus height between the two groups. Our study also found CSNP density was associated with the Schirmer 1 test results. This may suggest that tear secretion relies on the coordination of lacrimal gland nerves; thus, a decrease in CSNP density could indicate damage to the lacrimal gland nerves, resulting in reduced tear secretion. Further research is needed to confirm this relationship.
Our study has several limitations. First, as a cross-sectional study, it has inherent constraints, and further longitudinal studies are necessary to observe the changes in the relationship between CET and CSNP over time. Second, this study did not include assessments of tear composition. Evaluating tear components, such as the measurement of neurotrophic factors, could provide additional insights into the mechanisms underlying the relationship between the corneal epithelium and corneal nerves. Third, the relatively small sample size within the three diabetic subgroups may have reduced statistical power and the robustness of subgroup comparisons. Finally, because some patients were unable to accurately recall the onset of diabetes, we could not analyze the impact of disease duration on CET and nerve parameters.
Conclusion
In conclusion, compared to the control subjects, patients with DM exhibited aggravated MG dropout, reduced density and number of CSNP, and increased CT. In patients with PDR, CET was notably thinner, CSNP density decreased, and MG dropout was more pronounced. CET was found to be related to CSNP density, which in turn correlated with Schirmer I test results. Additionally, improving the ocular surface in these patients may help reduce the incidence of corneal epithelial lesions.
Data Sharing Statement
The author confirms that all relevant data are included in the article.
Ethics Approval and Consent to Participate
The study protocol was approved by the Ethics Committee of Joint Shantou International Eye Center (JSIEC) of Shantou University and the Chinese University of Hong Kong (Shantou city, China) (ID: EC20210803(6)-P02). The study followed the tenets of the Declaration of Helsinki.
Consent for Publication
Written informed consent has been obtained from the patient with diabetes. As the healthy control participants were included retrospectively, informed consent from the healthy controls was waived. JSIEC Ethics Committee confirmed that the data of the healthy control group were confidential.
Acknowledgments
The authors thank all of the technicians and clinical research collaborators of the clinical research center at JSIEC.
Author Contributions
All authors made a significant contribution to the work reported, whether that is in the conception, study design, execution, acquisition of data, analysis and interpretation, or in all these areas; took part in drafting, revising or critically reviewing the article; gave final approval of the version to be published; have agreed on the journal to Clinical Ophthalmology; and agree to be accountable for all aspects of the work.
Funding
This study was supported by the internal funding (21-014) of Joint Shantou International Eye Center of Shantou University and The Chinese University of Hong Kong, Shantou, Guangdong Province, People’s Republic of China.
Disclosure
The authors declare that they have no competing interests in this work.
References
1. Bu Y, Shih KC, Tong L. The ocular surface and diabetes, the other 21st Century epidemic. Exp Eye Res. 2022;220:109099. doi:10.1016/j.exer.2022.109099
2. Lin X, Xu Y, Pan X, et al. Global, regional, and national burden and trend of diabetes in 195 countries and territories: an analysis from 1990 to 2025. Sci Rep. 2020;10(1):14790. doi:10.1038/s41598-020-71908-9
3. Ladea L, Zemba M, Calancea MI, et al. Corneal epithelial changes in diabetic patients: a review. Int J Mol Sci. 2024;25(6):3471. doi:10.3390/ijms25063471
4. Ishibashi F, Kawasaki A, Yamanaka E, Kosaka A, Uetake H. Morphometric features of corneal epithelial basal cells, and their relationship with corneal nerve pathology and clinical factors in patients with type 2 diabetes. J Diabetes Investig. 2013;4(5):492–501. doi:10.1111/jdi.12083
5. Yusufoglu E, Gungor Kobat S, Keser S. Evaluation of central corneal epithelial thickness with anterior segment OCT in patients with type 2 diabetes mellitus. Int Ophthalmol. 2023;43(1):27–33. doi:10.1007/s10792-022-02384-5
6. Ziegler D, Papanas N, Zhivov A, et al. Early detection of nerve fiber loss by corneal confocal microscopy and skin biopsy in recently diagnosed type 2 diabetes. Diabetes. 2014;63(7):2454–2463. doi:10.2337/db13-1819
7. Misra SL, Goh YW, Patel DV, Riley AF, McGhee CN. Corneal microstructural changes in nerve fiber, endothelial and epithelial density after cataract surgery in patients with diabetes mellitus. Cornea. 2015;34(2):177–181. doi:10.1097/ICO.0000000000000320
8. Tavakoli M, Boulton AJ, Efron N, Malik RA. Increased Langerhan cell density and corneal nerve damage in diabetic patients: role of immune mechanisms in human diabetic neuropathy. Cont Lens Anterior Eye. 2011;34(1):7–11. doi:10.1016/j.clae.2010.08.007
9. Akkul Z, Erkilic K, Sener H, Polat OA, Er Arslantas E. Diabetic corneal neuropathy and its relation to the severity of retinopathy in patients with type 2 diabetes mellitus: an in vivo confocal microscopy study. Int Ophthalmol. 2024;44(1):108. doi:10.1007/s10792-024-03043-7
10. Early Treatment Diabetic Retinopathy Study Research Group. Fundus photographic risk factors for progression of diabetic retinopathy: ETDRS report number 12. Ophthalmology. 1991;98(5 Suppl):823–833.
11. Chao C, Wang R, Jones M, et al. The relationship between corneal nerve density and hemoglobin A1c in patients with prediabetes and type 2 diabetes. Invest Ophthalmol Vis Sci. 2020;61(12):26. doi:10.1167/iovs.61.12.26
12. Zhou T, Dou Z, Cai Y, Zhu D, Fu Y. Tear fluid progranulin as a noninvasive biomarker for the monitoring of corneal innervation changes in patients with type 2 diabetes mellitus. Transl Vis Sci Technol. 2024;13(7):9. doi:10.1167/tvst.13.7.9
13. Meijering E, Jacob M, Sarria JC, Steiner P, Hirling H, Unser M. Design and validation of a tool for neurite tracing and analysis in fluorescence microscopy images. Cytometry A. 2004;58(2):167–176. doi:10.1002/cyto.a.20022
14. Labbe A, Alalwani H, Van Went C, Brasnu E, Georgescu D, Baudouin C. The relationship between subbasal nerve morphology and corneal sensation in ocular surface disease. Invest Ophthalmol Vis Sci. 2012;53(8):4926–4931. doi:10.1167/iovs.11-8708
15. Kim J, Kim JY, Seo KY, Kim TI, Chin HS, Jung JW. Location and pattern of non-invasive keratographic tear film break-up according to dry eye disease subtypes. Acta Ophthalmol. 2019;97(8):e1089–e1097. doi:10.1111/aos.14129
16. Pult H, Riede-Pult BH. Non-contact meibography: keep it simple but effective. Cont Lens Anterior Eye. 2012;35(2):77–80. doi:10.1016/j.clae.2011.08.003
17. Yang Q, Liu L, Li J, et al. Evaluation of meibomian gland dysfunction in type 2 diabetes with dry eye disease: a non-randomized controlled trial. BMC Ophthalmol. 2023;23(1):44. doi:10.1186/s12886-023-02795-7
18. Bitirgen G, Ozkagnici A, Malik RA, Kerimoglu H. Corneal nerve fibre damage precedes diabetic retinopathy in patients with type 2 diabetes mellitus. Diabet Med. 2014;31(4):431–438. doi:10.1111/dme.12324
19. Han JX, Wang H, Liang HH, Guo JX. Correlation of the retinopathy degree with the change of ocular surface and corneal nerve in patients with type 2 diabetes mellitus. Int J Ophthalmol. 2021;14(5):750–758. doi:10.18240/ijo.2021.05.17
20. Nitoda E, Kallinikos P, Pallikaris A, et al. Correlation of diabetic retinopathy and corneal neuropathy using confocal microscopy. Curr Eye Res. 2012;37(10):898–906. doi:10.3109/02713683.2012.683507
21. Quadrado MJ, Popper M, Morgado AM, Murta JN, Van Best JA. Diabetes and corneal cell densities in humans by in vivo confocal microscopy. Cornea. 2006;25(7):761–768. doi:10.1097/01.ico.0000224635.49439.d1
22. Qu JH, Li L, Tian L, Zhang XY, Thomas R, Sun XG. Epithelial changes with corneal punctate epitheliopathy in type 2 diabetes mellitus and their correlation with time to healing. BMC Ophthalmol. 2018;18(1):1. doi:10.1186/s12886-017-0645-6
23. D’Andrea L, Montorio D, Concilio M, Giordano M, Cennamo G, Costagliola C. Anterior segment-optical coherence tomography and diabetic retinopathy: could it be an early biomarker? Photodiagnosis Photodyn Ther. 2022;39:102995. doi:10.1016/j.pdpdt.2022.102995
24. Zou C, Wang S, Huang F, Zhang YA. Advanced glycation end products and ultrastructural changes in corneas of long-term streptozotocin-induced diabetic monkeys. Cornea. 2012;31(12):1455–1459. doi:10.1097/ICO.0b013e3182490907
25. Manaviat MR, Rashidi M, Afkhami-Ardekani M, Shoja MR. Prevalence of dry eye syndrome and diabetic retinopathy in type 2 diabetic patients. BMC Ophthalmol. 2008;8:10. doi:10.1186/1471-2415-8-10
26. Yu L, Chen X, Qin G, Xie H, Lv P. Tear film function in type 2 diabetic patients with retinopathy. Ophthalmologica. 2008;222(4):284–291. doi:10.1159/000140256
27. Lyu Y, Zeng X, Li F, Zhao S. The effect of the duration of diabetes on dry eye and corneal nerves. Cont Lens Anterior Eye. 2019;42(4):380–385. doi:10.1016/j.clae.2019.02.011
 © 2025 The Author(s). This work is published and licensed by Dove Medical Press Limited. The
full terms of this license are available at https://www.dovepress.com/terms
and incorporate the Creative Commons Attribution
- Non Commercial (unported, 4.0) License.
By accessing the work you hereby accept the Terms. Non-commercial uses of the work are permitted
without any further permission from Dove Medical Press Limited, provided the work is properly
attributed. For permission for commercial use of this work, please see paragraphs 4.2 and 5 of our Terms.
© 2025 The Author(s). This work is published and licensed by Dove Medical Press Limited. The
full terms of this license are available at https://www.dovepress.com/terms
and incorporate the Creative Commons Attribution
- Non Commercial (unported, 4.0) License.
By accessing the work you hereby accept the Terms. Non-commercial uses of the work are permitted
without any further permission from Dove Medical Press Limited, provided the work is properly
attributed. For permission for commercial use of this work, please see paragraphs 4.2 and 5 of our Terms.