Back to Journals » Clinical Ophthalmology » Volume 15
Evaluating the Viability of a Smartphone-Based Annotation Tool for Faster and Accurate Image Labelling for Artificial Intelligence in Diabetic Retinopathy
Authors Morya AK ![]() , Gowdar J
, Gowdar J ![]() , Kaushal A, Makwana N
, Kaushal A, Makwana N ![]() , Biswas S, Raj P
, Biswas S, Raj P ![]() , Singh S, Hegde S, Vaishnav R
, Singh S, Hegde S, Vaishnav R ![]() , Shetty S
, Shetty S ![]() , P VS, Shah V
, P VS, Shah V ![]() , Paul S, Muralidhar S, Velis G, Padua W, Waghule T, Nazm N, Jeganathan S, Mallidi AR, Susan John D, Sen S
, Paul S, Muralidhar S, Velis G, Padua W, Waghule T, Nazm N, Jeganathan S, Mallidi AR, Susan John D, Sen S ![]() , Choudhary S
, Choudhary S ![]() , Parashar N
, Parashar N ![]() , Sharma B, Raghav P
, Sharma B, Raghav P ![]() , Udawat R, Ram S, Salodia UP
, Udawat R, Ram S, Salodia UP ![]()
Received 29 October 2020
Accepted for publication 18 January 2021
Published 8 March 2021 Volume 2021:15 Pages 1023—1039
DOI https://doi.org/10.2147/OPTH.S289425
Checked for plagiarism Yes
Review by Single anonymous peer review
Peer reviewer comments 4
Editor who approved publication: Dr Scott Fraser
Video abstract of "Smartphone based annotation tool for AI in healthcare" [ID 286429].
Views: 709
Arvind Kumar Morya, 1 Jaitra Gowdar, 2 Abhishek Kaushal, 2 Nachiket Makwana, 2 Saurav Biswas, 2 Puneeth Raj, 2 Shabnam
Singh, 3 Sharat Hegde, 4 Raksha Vaishnav, 5 Sharan Shetty, 6 Vidyambika S P, 7 Vedang Shah, 8 Sabita Paul, 7 Sonali Muralidhar, 9 Girish Velis, 10 Winston Padua, 11 Tushar Waghule, 12 Nazneen Nazm, 13 Sangeetha Jeganathan, 14 Ayyappa Reddy Mallidi, 15 Dona Susan John, 16 Sagnik Sen, 17 Sandeep Choudhary, 1 Nishant Parashar, 1 Bhavana Sharma, 18 Pankaja Raghav, 1 Raghuveer Udawat, 1 Sampat Ram, 1 Umang P Salodia 1
1Department of Ophthalmology, All India Institute of Medical Sciences, Jodhpur, Rajasthan, 342005, India; 2Radiate Healthcare Innovations Private Limited, Bangalore, Karnataka, 560038, India; 3Sri Narayani Hospital & Research Centre, Vellore, Tamilnadu, 632 055, India; 4Prasad Netralaya, Udupi, Karnataka, 576101, India; 5Bhaktivedanta Hospital, Mira Bhayandar, Maharashtra, 401107, India; 6Prime Retina Eye Care Centre, Hyderabad, Telangana, 500029, India; 7Vasan Eye Care, New Delhi, 110 075, India; 8Shree Netra Eye Foundation, Kolkata, West Bengal, 700020, India; 9People Tree Hospital, Bengaluru, Karnataka, 560022, India; 10Goa Medical College, Goa, 403202, India; 11St. John's Medical College & Hospital, Bengaluru, Bengaluru, 560034, India; 12Reti Vision Eye Clinic, KK Eye Institute, Pune, Maharashtra, 411001, India; 13ESI PGIMSR, ESI Medical College and Hospital, Kolkata, West Bengal, 700104, India; 14Srinivas Institute of Medical Sciences and Research Centre, Mangalore, Karnataka, 574146, India; 15Goutami Eye Institute, Rajahmundry, Andhra Pradesh, 533105, India; 16Diya Speciality Eye Care, Bengaluru, Karnataka, 560061, India; 17Aravind Eye Hospital, Madurai, Tamil Nadu, 625 020, India; 18All India Institute of Medical Sciences, Bhopal, Madhya Pradesh, 462020, India
Correspondence: Arvind Kumar Morya
Department of Ophthalmology, All India Institute of Medical Sciences, Bibinagar, Hyderabad, Telangana, 508126, India
Email [email protected]
Introduction: Deep Learning (DL) and Artificial Intelligence (AI) have become widespread due to the advanced technologies and availability of digital data. Supervised learning algorithms have shown human-level performance or even better and are better feature extractor-quantifier than unsupervised learning algorithms. To get huge dataset with good quality control, there is a need of an annotation tool with a customizable feature set. This paper evaluates the viability of having an in house annotation tool which works on a smartphone and can be used in a healthcare setting.
Methods: We developed a smartphone-based grading system to help researchers in grading multiple retinal fundi. The process consisted of designing the flow of user interface (UI) keeping in view feedback from experts. Quantitative and qualitative analysis of change in speed of a grader over time and feature usage statistics was done. The dataset size was approximately 16,000 images with adjudicated labels by a minimum of 2 doctors. Results for an AI model trained on the images graded using this tool and its validation over some public datasets were prepared.
Results: We created a DL model and analysed its performance for a binary referrable DR Classification task, whether a retinal image has Referrable DR or not. A total of 32 doctors used the tool for minimum of 20 images each. Data analytics suggested significant portability and flexibility of the tool. Grader variability for images was in favour of agreement on images annotated. Number of images used to assess agreement is 550. Mean of 75.9% was seen in agreement.
Conclusion: Our aim was to make Annotation of Medical imaging easier and to minimize time taken for annotations without quality degradation. The user feedback and feature usage statistics confirm our hypotheses of incorporation of brightness and contrast variations, green channels and zooming add-ons in correlation to certain disease types. Simulation of multiple review cycles and establishing quality control can boost the accuracy of AI models even further. Although our study aims at developing an annotation tool for diagnosing and classifying diabetic retinopathy fundus images but same concept can be used for fundus images of other ocular diseases as well as other streams of medical science such as radiology where image-based diagnostic applications are utilised.
Keywords: artificial intelligence, deep learning, referrable diabetic retinopathy
Erratum for this paper has been published
Purpose of This Study
Deep Learning (DL) has been the go-to solution to a ton of problems in various domains such as Self Driving cars, entertainment, healthcare, agriculture, financial services, etc. This adoption of Artificial Intelligence (AI) has become widespread due to the advances in hardware technologies such as GPUs, FPGA cards, etc., and the abundance of available digital data labelled or raw. The key moment in the history of Computer Vision (CV) was the AlexNet architecture1 which changed the CV landscape forever by proving the effectiveness of Deep Convolutional Neural Networks (CNN)2 for large-scale image classification tasks such as the ImageNet Dataset.3
Supervised learning algorithms, especially CNNs have shown human-level performance or even better in domains such as Radiology,4 Ophthalmology, Automatic vehicles, etc. These techniques are better feature extractors and quantifiers than unsupervised learning algorithms which are promising but have a huge scope of improvement to reach a level of Supervised learning algorithms. Hence, Supervised learning algorithms have widespread usage across multiple domains. But the caveat for using such algorithms is that they need a huge amount of labelled or annotated data to train and reach a super-human level performance.5 Also, the problem of grader variability is a crucial problem when dealing with specialized tasks in healthcare where opinions of Experts have high variance. To get a huge dataset with good quality control, there is a dire need for an annotation tool with a customizable feature set. This paper evaluates the viability or having an inhouse annotation tool and that too which works on a smartphone in a healthcare setting. The following section mentions the specific reasons for developing an inhouse annotation tool, other desktop-based tools, its usage on a mobile device and the temporal factor associated with the labelling process.
Reasons for Developing an Inhouse Tool
Our main objective was to get retinal images annotated for quantifying the severity of Diabetic Retinopathy at an image level (not at the complete eye level) and other etiologies present in them. This objective is to be completed in a limited time but with Domain Experts (Retinal specialists and Ophthalmologists). With the already mentioned boom in AI-based solution development, there are a lot of image annotations tools available such as Labelbox,6 Supervise.ly,7 Labelling8 etc. which are either Desktop-based Graphical User Interface (GUI) tools or web portals which can be used in a browser. This poses a big problem of not having mobility and induced boredom or lack of focus if the Graders work on it after a tiring day job. With installable GUI tools, the problem of tracking the progress of graders becomes extremely difficult and a host of problems such as data exchange for offline annotations, retrieving annotations from Grader’s device at specific intervals, loss of data due to hardware issues, etc., can slow down the labelling process. This tips the balance towards the usage of online tools, but they have their own set of problems such as loss of annotations due to network issues, limit for free private annotation dataset creation, sluggish image loading due to low capacity networks, etc. But they are pretty helpful in tracking of the annotation process with review and quality control features.
The biggest problem with online labelling tools is that sensitive data such as patient imaging or any media sample must be kept private as per the patient data prevention acts. Although these tools promise utmost security, given the rising cyber-security crimes and data breaches, it is best not to let data be outsourced to any platform other than that of the respective organizations. Another problem of using these online tools is that they are made to suit a generalized set of use cases, but we needed a more custom solution with nested classification and deeper option selection support, which was missing from the available tools.
Given the above-mentioned considerations, we still opted to start with an online tool - Labelbox only to be used when labelling of publicly available datasets. This was an exercise conducted only to gain perspective into the labelling process and evaluate the need for a custom tool. This exercise helped us converge to the decision of having an inhouse tool developed. We also observed that as the labelling process matured, the annotation schema evolved which could be changed on the fly as per the grader. This created a lot of issues while retrieving data because of the schema mismatch at different stages in the annotation process.
The specialty of our own annotation tool is that it is a smartphone first annotation tool which ensures on the go annotation for graders at any location and at any time of the day. This tool was designed by keeping the principle of mobility in mind. We were able to take the best features and our needs and model a sleek tool around it. The main problems that our tool satisfied were as follows. Mobility, faster annotations, progress tracking for the entire annotation process by the administrator, improvement spaced on the expert feedback for the user interface, well-structured schema with appropriate retrieval procedures to have agile AI training, multiple users working on different chunks of data sets at the same time which enhanced the process speed, custom quality control measures with review cycles and a lot more which shall be mentioned in the following sections. We also learned that some simple pre-processing controls such as changing brightness, contrast and zooming on a particular section of the image further helped in better decision-making. These controls were incorporated in the tool as per user feedback and it was found to be helpful from a User Experience perspective too. A famous blog post8 cited by Peter Norvig, highlights some of the exact problems mentioned above and a few more which proves the necessity of developing in-house tools at later stages in the pipeline for AI development. This in-house tool was developed by the Data science team of the organization. The tool has been developed using the most bleeding edge of engineering technologies using Kubernetes as a scalable platform. This helps the team scale the annotation platform dynamically to as many users as possible based on usage spikes. Although the motivation has been sound for the development, a direct comparison cannot be made to any existing tool available due to multiple factors: one of its kind, mismatch of datasets labelled previously on online tools, no adjudication based datasets for other tools and hence no AI model trained using that data to compare with current results.
Brief Background About Retinal Imaging and Use of AI for Quantification
Diabetic retinopathy is one of the leading causes of blindness which is mentioned in almost every other ophthalmic research paper there is. The focus is on developing better screening tools for early prevention and risk evaluation of diseases such as diabetic retinopathy, macular oedema, glaucoma, age-related macular degeneration, etc. The research paper by Gulshan et al10 was one of the first search papers to have developed a large-scale system for the screening of diabetic retinopathy with the purpose of early prevention and availability of screening tools in or remote areas. A lot of such large-scale research papers surrounding macular oedema and glaucoma detection systems have been published till date and a lot of research is being conducted on similar lines to enhance the screening. These screening systems employ the use of deep learning techniques primarily. Such systems are not only used to classify whether a patient has a disease or not but to also quantify the amount of damage already done or the risk of developing increased severity of a particular disease.9 Segmentation of lesions such as exudates, haemorrhages, microaneurysms, vascular structure evolution and other abnormalities found in the retina, hold the key to more accurate decision-making while automated screening.11–13
Related Work
This section covers a lot of other research work where topics spanning not only the labelling process, but some aspects such as image processing for grading, AI development pipeline, consensus-based quality control, etc.
The most closely related paper to this study is by Park et al14 They validate the importance of using Deep Learning for Diabetic Retinopathy detection. They mainly emphasize on having good quality of data to train Deep learning models which are robust to data in the wild. And subsequently for good quality data, one needs a good grading and reading system. The key difference in our and their methodology is that they developed the system as a Desktop only interface. They showed marking of fovea, macula and circular areas surrounding them for better diagnosis. They found that displaying the Age and Gender attributes of a patient whenever available along with their images helped further in quantifying Age-Related macular degeneration in certain cases. They have mentioned the inner workings of their database design and specification of their 5-stage grading flow which are the crux of the study. They went further to investigate the Grader variability and agreement of at least 2 and 3 graders, where the Graders involved experts with different specializations such a Retina, Glaucoma, Cornea to analyse the variance in decisions made for each case. Their results indicated that each type of specialist had higher agreement rates when diagnosing their corresponding subspeciality for example – retinal specialists were better at general disease identification such as DR, DME, ARMD, etc., but were not as good as Glaucoma Specialists at doing Glaucoma diagnosis and vice-versa.
One of the key papers cited in almost every image processing-related paper for Retinal Image analysis is by Rasta et al15 This research primarily emphasizes techniques of image processing for automated systems as well as manual grading. Their key findings are that not some complex image processing techniques, but the basic Brightness and Contrast changes play important roles. They report that in various studies, about 12% of images are clinically ungradable due to illumination and contrast issues while clicking images. Such quality deficit can be improved if simple Brightness and contrast change image processing operations are employed while grading. They show that for some pre-processing techniques which correct illumination and contrast were visually better and approved by ophthalmologists for examination hence proving pre-processing is necessary and can turn some upgradable into gradable images. This is the exact reason; we provide sliders for varying contrast and brightness in our web-based smartphone tool.
One of the most deserved mentions is to the research and product IDx-DR, a work by M. Abramoff et al which is the only AI-based screening system for Diabetic Retinopathy with an FDA approval. This paper serves as an inspiration for the AI system we have trained for distinguishing Referrable versus Non-Referable cases. Our tool is designed based on the ICDR scale of Diabetic Retinopathy Severity but bucket the categories of Moderate, Severe NPDR, PDR and/or macular oedema as rDR (referrable DR) cases as done by M. Abramoff et al We adopt this system with some results mentioned in the Results section.
The DR paper of 201610 by google was the first one to highlight the grader variability in rating DR severity in images. Building over that work was another publication17 by the same authors discussing the details of such variance and specification of techniques used to tackle this problem by having multiple rounds of grading by different levels of Doctors in an experience hierarchy. They also discuss the adjudication techniques used such as taking a majority vote of an odd number of graders and having multiple live and asynchronous reading sessions involving specialists for cases where high disagreement was observed. One more point worth mentioning is that the adjudication was established not only based on the image grade but also based on the signs and abnormalities if any seen in the image where they observed higher agreement among graders. The detailed procedure of these review cycles and live/asynchronous adjudication process is mentioned in this research work.18 We present a similar case of getting a set of 550 images tagged by 21 Graders which included Retinal Specialists, Glaucoma Specialists and Ophthalmologists. Our observations are mentioned in the Grader Variability and Agreement stats for baseline set Section.28
Ethics Statement
The retrospective study based on the review of medical charts was conducted in the adherence of the principles of the Declaration of Helsinki and the approval was received from the Institutional Ethics Committee. Informed consent was waived due to the retrospective nature of the study and proper deidentification of the data used in the study.
Materials and Methods
We developed a smartphone-based grading system to help the researchers in grading multiple retinal fundus easily, at their convenience in a relatively short span of time. In the following sections, we breakdown our entire pipeline for streamlining the annotation process. The Grading System architecture section discusses the flow of the User-Interface which has been designed carefully with the feedback of experts without losing any aesthetic value. The section named User-Friendly tool development details the emphasis on improved User Interface and an overall User Experience. It also mentions some technical details on how we optimized our image display by loading a smart preloading routine. The User Feedback acts as a validation of the features we incorporated as mentioned in the User-friendly tool section.
The quantitative and qualitative analysis sections outline the analytics of the change in speed of a grader over time, feature usage statistics – disease category wise, etc. The Dataset sources section details the dataset(s) used to build the testing and internal validation sets. The Grader information section consists of the professional details of our highly experienced panel of Graders. Grader Variability and Agreement statistics Section highlights our key findings of our experiment design for 550 images. Results section outlines, in brief, the results for an AI model trained on the images graded using this tool and its validation over some public datasets.
Grading System Architecture
The User Interface flow or reading interface is designed carefully by a team of Retinal Specialists and engineers carefully. The retinal specialists helped define the overall data to capture such as the Grade or severity of a particular disease along with the signs to be marked if visible. The task of the engineers was to optimize the flow so as to record maximum information with minimal clicks. The flow diagram of the user interface is as shown in Figure 1.
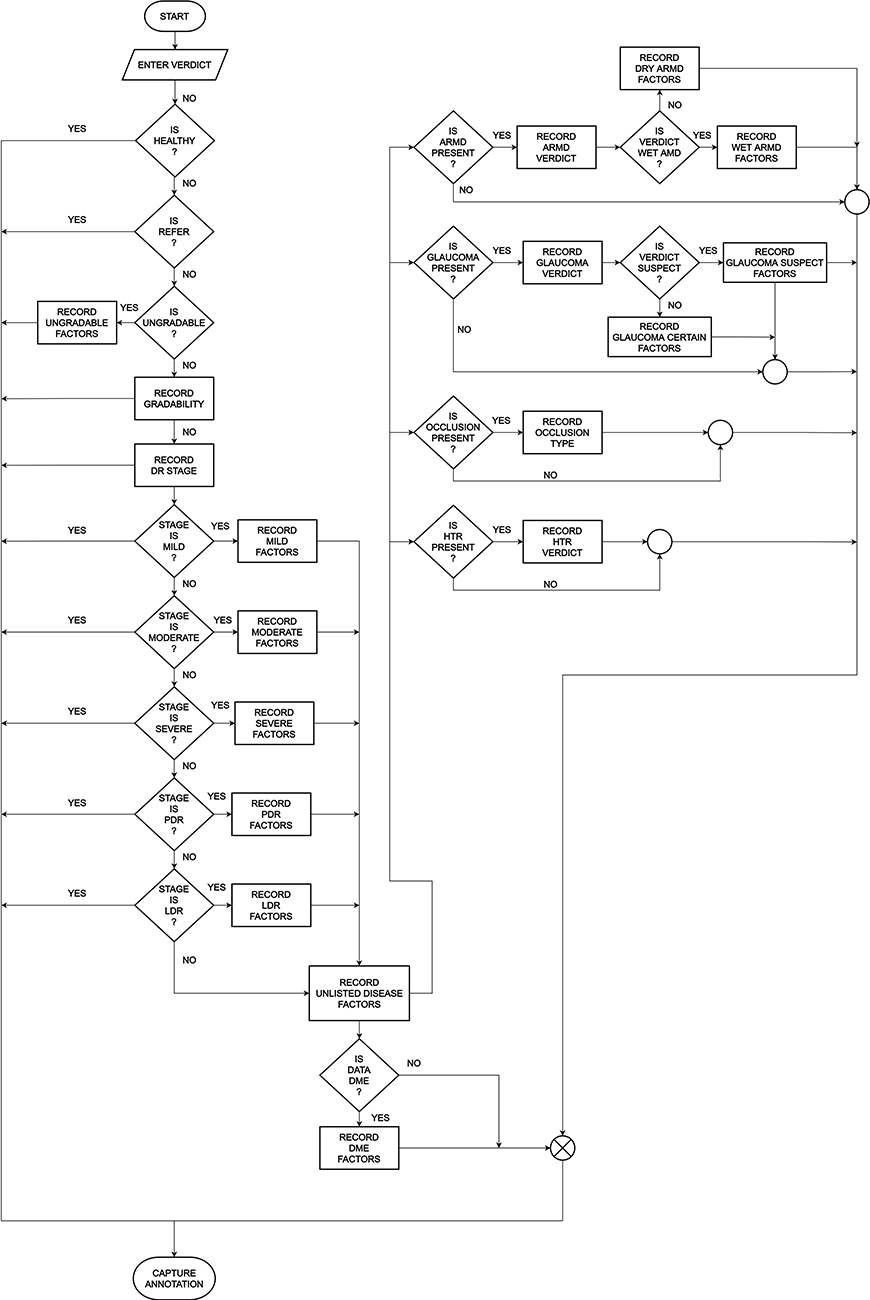 |
Figure 1 Flow diagram of the user interface. Abbreviations: PDR, proliferative diabetic retinopathy; LDR, lasered diabetic retinopathy; ARMD/AMD, age-related macular degeneration; HTR, hypertensive retinopathy; DME, diabetic macular edema. |
User-Friendly Tool Development
The main objective of this tool was to look aesthetically pleasing and adhering to the latest trends namely the Dark mode which only a few tools support as of now. The User Interface is responsive for the smallest to the largest smartphone screens and even on tablets as reported by some of our graders. A screenshot of the Interface is shown in Figure 1. As seen in the figure, the background is dark Gray with minor tint changes to distinguish the different sections but not such as to catch attention. At the top-level verdict annotation, the tonality of all colours used such as Red, Green and Yellow are kept soft so that it does not hurt the eye, but still preserving the meaning of the tag associated with the corresponding button as shown in Figure 2. These colours have also been chosen specifically based on the meaning of a particular tag viz Green for Healthy, Red for Unhealthy, tapping into the vision science thought process of a Grader selecting a grade based on only the colour of the button rather than by reading the entire text in the button which improves the speed of tagging. The image display is done in the top 40% of the screen area. Some might argue that an image must be displayed on a full Desktop sized screen with maximum area coverage for accurate tagging. But we work around the behavioural thinking of how smartphones have changed how we view screens and how the human eye has become adept to the smallest of fonts on some tiny screens. This behaviour can be justified not very different from a standard habit of reading small fonts on a newspaper.19 Also to counter this argument, a zooming feature has been provided which is activated on simply hovering over any section of the image with customizable zoom levels. The screen transitions and animations on activity have been designed keeping in mind not to slow down the annotation in any manner but also to be smooth enough to get easily registered and make annotations a seamless experience. Below is a detailed list of why a particular feature was implemented and how that is helpful in decision-making.
- Zoom: Given various screen sizes of different phones and the scale of abnormalities in images which are difficult to spot very easily even on larger screens, this hover based zooming focuses on a particular area of the image of interest and very easily can be used to view any other section based on finger movements. The Zooming happens on three levels, first is a default view of image spanning 512 pixels in the largest dimension, and on hovering it zooms into an image of size 768 pixels, which can be further zoomed in into an image 1024 pixels in the largest dimension based on the selection of zoom level. These sizes were standardized based on preliminary experiments of faster image loading based on the internet bandwidth and visual acuity. The smallest image of size 512 pixels width does not appear to have major resolution loss for minuscule abnormalities as per visual examination. Figure 2.
- Green channel: One of the most requested features in the ongoing development of the tool was that of having red-free imaging for retinal images. The Red-Free image is basically the Green channel of the RGB channels which make up the 24-bit colour image which we perceive. The Green channel for not only retinal images but also in general imaging is responsible for providing good details about contrast and differences in the darkest versus the most illuminated regions in an image. There is a ton of medical literature supporting the use of this imaging format which can help doctors find abnormalities such as microaneurysms and haemorrhages in an image as seen in Figure 3. The green channel also helps to give a distinct view of the arteries and veins of the vascular structure of the retina image where veins are darker than the arteries and arteries are illuminated along the centre of the entire width of the vessel. The green channel is also instrumental in identifying the boundaries of the retina optic cup which can aid in glaucoma detection. The zooming feature is provided in the red-free imaging similar to the colour image.
- Brightness and Contrast sliders for changes: Every image processing application comes with the basic photo editing capabilities of changing the brightness and contrast levels. But here they are used for purely scientific reasons. As mentioned in the comparative study done by Rasta et al,15 brightness and contrast variations are key to the analysis of images and sometimes even make an ungradable image, gradable if given the right setting. Figure 4 clears the advantages provided by the brightness and contrast variations from a visual acuity perspective. Zooming is accompanied with such edited images as well.
- Original Color image: Figure 4A showing difficulty in locating fovea due to dark macular region.
- Brightness shift: Figure 4B showing easier fovea and macula localization. Also, 4C showing distinguishing Artery and Veins in the Green channel is easier.
- Contrast shift: Figure 4D and E showing contrast change in green channel makes it very easy to assess optic cup and optic disc for glaucoma verification.
- Smart Image Preloading: One of the main challenges was the delivery of image assets to the Grader devices such that the grader does not have to wait after completing annotations of the current image and waiting for the next one to load. We often see that in low reception areas, image heavy websites like Instagram, google images, etc., take a lot of time to load. Given the trade-off between limited bandwidth and not wasting any of the grader’s time waiting for image assets to load, we came up with a smart procedure of pre-emptive loading of more image assets in advance as defined in the sequence of the images to be tagged for a particular annotator. Each completed annotation, triggers a call to load the next set of 3 images in advance to be annotated as seen in Figure 5. This call is not only for the colour images but also for the Red-free imaging. We harness the power of asynchronous processing of JavaScript and some smart CSS (cascading style sheets) for the loading and rendering of image assets, respectively. Two variations of such preloading were tested as a decision was to be made about creating a red-free copy of the colour image on the client device by simple image processing operations or serving the pre-computed red-free images from the backend servers. We observed that on-device red-free channel computations created unwanted jittering and slowed down the tagging by a certain degree citing the limitations of processing happening on the mobile device. Hence, it was worth serving the precomputed images from a server with only a fractional increase in the bandwidth. Another experiment was conducted to utilize some smarter image compression formats such as WebP.20 It is a special format developed by Google which maintains the resolution of images but drastically decreases the memory footprint of images with adaptive compression rates for larger assets as compared to conventional image formats like JPEG, PNG, TIFF, etc. A really big speed jump was observed in the image preloading functionality but we realized that WebP is not supported on all devices made by particular manufacturers like Samsung and Apple even on chrome browsers. Hence, this enhancement had to be rolled back since some annotators using these devices complained about not seeing the images rendered in the WebP format. But this opens up multiple possibilities where image assets are to be loaded in huge bulks.
- Set by Set bifurcation of annotator task: Adhering to the S.M.A.R.T. (Specific, Measurable, Achievable, Relevant and Time Bound) criteria, we decided to give the Graders estimates about their progress of the number of images annotated and total to be assigned later. Most of the tools we see, throw the whole image set on the grader which may span from 100 to even tens of thousands of images. This can have a psychological effect of being overwhelmed or total lack of motivation by the number of images to be tagged. Hence, we decided to break up our whole dataset into small, mutually exclusive chunks of 1000 images each. This gives them a measurable target which can be achieved under approximately half a week given that the tagger maintains a consistent effort. Figure 6.
- Admin control: A simple admin panel was created to monitor the progress of graders, add more users and assign sets of images to the graders while ensuring each image is annotated at least 3 times to establish the foundation of adjudication process and review cycle management.
- Gamification: An initial step towards gamification of the labelling process was to provide a daily progress graph (Figure 7) (spanning the last 15 days) of the current user and the same graph of the user who has done the maximum annotations in that particular day with real-time updates as seen in Figure … This keeps the user motivated to put in more efforts and try and overtake the leading user while maintaining a healthy competition. The identity of each grader is completely anonymized so as to avoid creating any unnecessary confrontations or direct contact. Another approach incorporated in the application is to provide the agreement statistics of annotators for particular sets where a minimum of 2 graders have annotated the same set. The agreement sets are reported as PDF reports for each grader while still maintaining the anonymity.
- Standardization as per international guidelines: The tagging interface has been made as per the Standardization of disease categories following the ICDR severity scale27 which is followed by most of the practitioners worldwide.
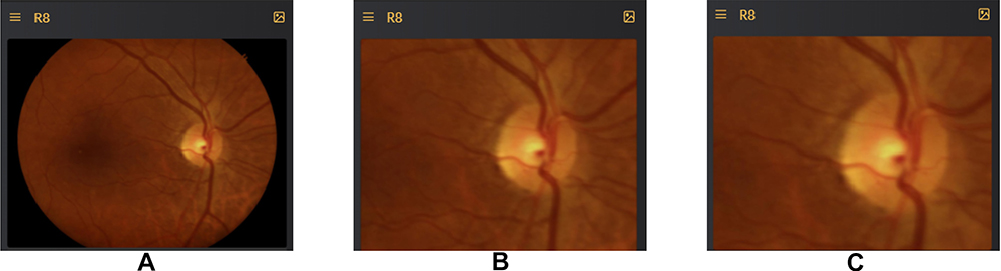 |
Figure 2 The zooming on 3 levels. (A) A default view of image spanning 512 pixels in the largest dimension. (B) Zoom into image of size 768 pixels in the largest dimension. (C) Zoomed in into an image 1024 pixels in the largest dimension. |
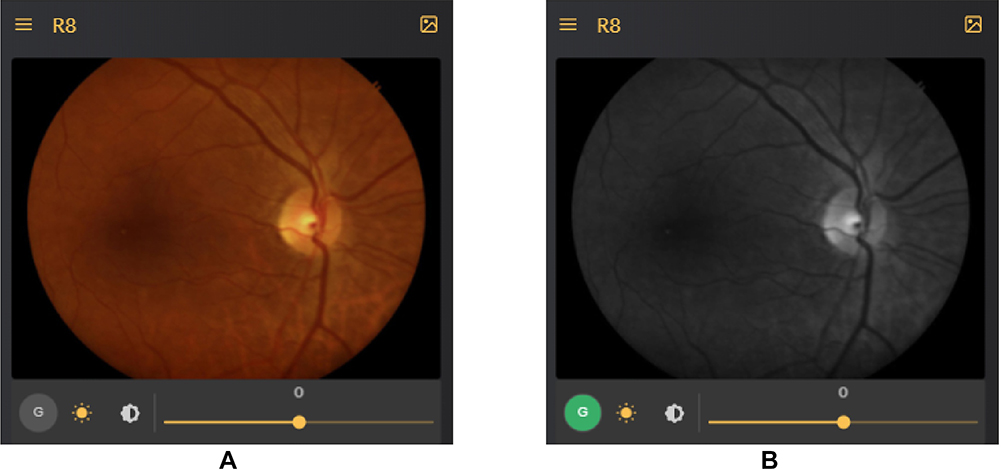 |
Figure 3 Color image (A) and its corresponding red-free image (B). |
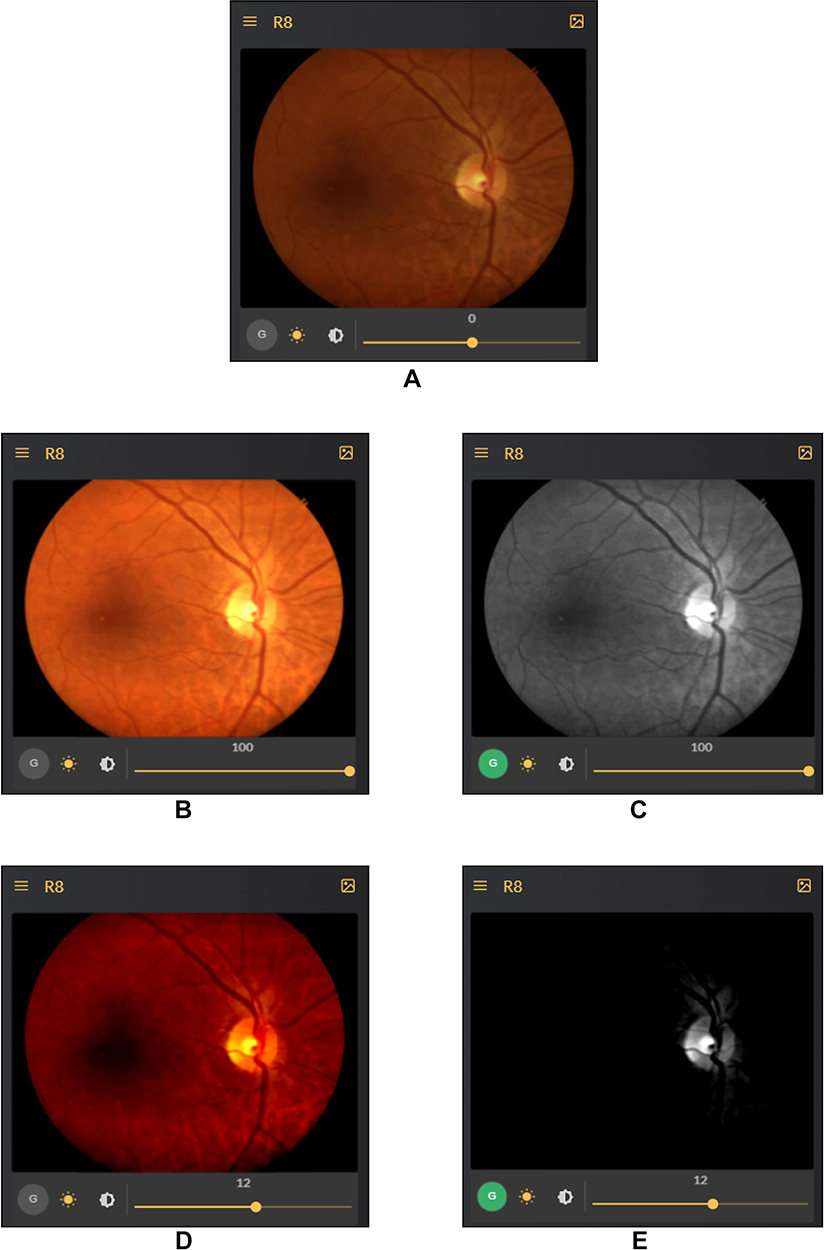 |
Figure 4 Effect of brightness modification and green channel. (A) Difficulty in locating fovea due to dark macular region. (B) Easier fovea and macula localization. (C) Distinguishing artery and veins in the green channel is easier. (D and E) Contrast change in green channel makes it very easy to assess optic cup and optic disc for glaucoma verification. |
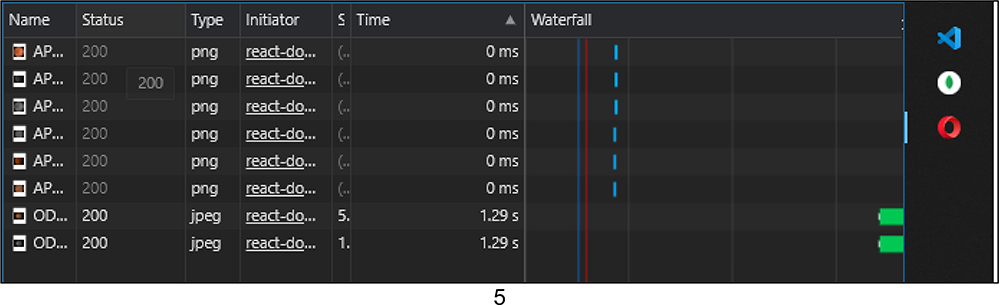 |
Figure 5 Each completed annotation, triggers a call to load the next set 3 images. |
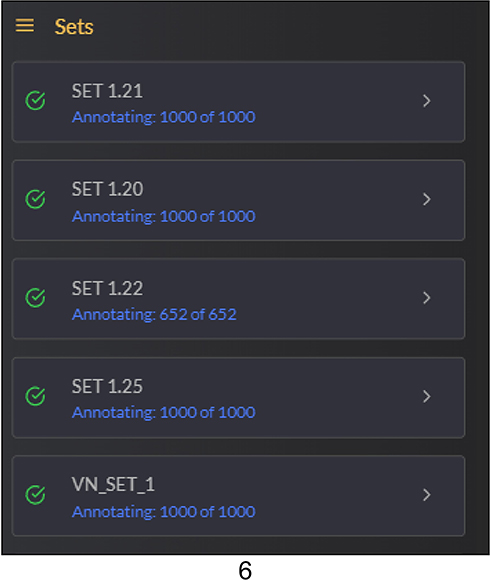 |
Figure 6 Break up our whole dataset into small, mutually exclusive chunks of 1000 images each. |
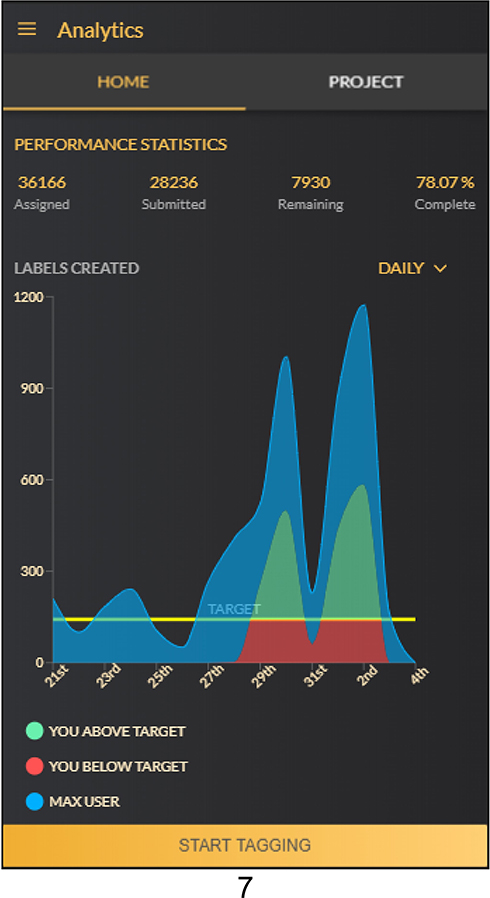 |
Figure 7 Daily progress graph. |
User Feedback from Verbal Survey
Although being subjective, the user feedback played a crucial role in confirming some of assumptions which are later justified by data analysis of metadata collected. A small questionnaire was designed to get general feedback from graders which revolved around user experience, feature-specific comments, strain on eyes while annotations, etc. Following is a brief summarization of the survey. The nested classification and feature annotations were liked by the annotators which did not add to usage complexity but enabled deeper feature capturing. Usage of the zoom feature is almost always done as the screen size is small but is enough to tag when zoomed in on the image. Brightness and contrast features are also used specifically when the graders think it might be an abnormal image for Glaucoma assessment specifically to analyse the cup and disc. Some lesions are also caught which went undetected in the original image but distinctly visible when contrast is changed. Some hidden vascular structures are also visible when brightness is increased which may be dark regions during clicking the image. Two out of 19 active graders preferred a Desktop version of the system as they were comfortable doing this on a Desktop/Laptop device. Most of the graders have also reported that this is more of a fun and enjoyable task for them rather than a taxing procedure as they get to assess a lot more images in a single day than patients they may get to see in a month. The graders prefer to have a more gamified version of the tool and also have timely reminders in case the tagging gets stalled or they are distracted. The predominantly dark mode is visually pleasing and comfortable even when tagging in low ambient light environments. The annotation process becomes quicker over time with enough practice which shall be confirmed in the Quantitative analysis section. Graders have even reported doing the annotations in their free time while they are taking a cab ride, or in-between patient visits in their institution of practice or even as a fun exercise before going to sleep.
Data Set Sources
A carefully curated selection of images (how many) of approximately 20,000 images was done from the Kaggle Diabetic Retinopathy detection competition dataset of Retinal Images21 which were provided by EyePACS. The purpose of using this data was to compare and evaluate the variance in the annotation done by doctors on our smartphone tool and their original DR grade annotations mentioned in the source dataset. Around 200 images were also chosen from Messidor-2 data22 for the purpose of benchmarking annotations. Majority of the repository accounts for a private dataset which will not be released publicly (meaning of this sentence). The images in the repository come from various sources and the range of cameras used to click these images include 3CCD camera on a Topcon TRC NW6 non-mydriatic fundus camera and Zeiss non-mydriatic fundus camera with a Field of View of 30 degrees, 40 degrees and 45 degrees. The private dataset images were de-identified by randomly assigned numerical codes, and all other demographic details (like subject name, birthdate, study date, age, gender, etc.) were removed from the images before entering the reading system. The graders were not provided any clinical information (such as visual acuity or intraocular pressure, status of the contralateral eye, ophthalmologic history, presence of systemic comorbidities). A small subset of images was kept aside as a test set for the onboarding of a Grader, which was graded and completed by 21 doctors for DR and comorbidity presence. This small set consisted of 550 images, called Baseline Set, which were carefully chosen from the APTOS,23 ODIR24 and Drishti-GS26 datasets targeted mainly for DR, Macular Oedema and Glaucoma annotations and verifying grader reliability as per their specialization. Another test set was created to assess the AI model performance from the first annotation round for Referrable DR detection. This test set included images from the IDRiD25 dataset and APTOS dataset mutually exclusive from the above-mentioned Baseline Set.
Quantitative Data Analysis
This section is dedicated to the analysis of metadata collected while the graders were tagging the images. We confirm quite a lot of the assumptions made before constructing the tool by analysing user behaviour and maintaining anonymity. A lot of the user feedback which may be termed as subjective is turned into objective confirmations by said data analysis. We also include general statistics of active users, average annotations added per hour by multiple graders, etc. All the measures are reported from the date of the inception of the tool - 5/10/2019 till the present date of writing this study - 3/8/2020.
We begin the analysis with the general statistics reported in Table 1. General statistics and data analysis for tool usage.
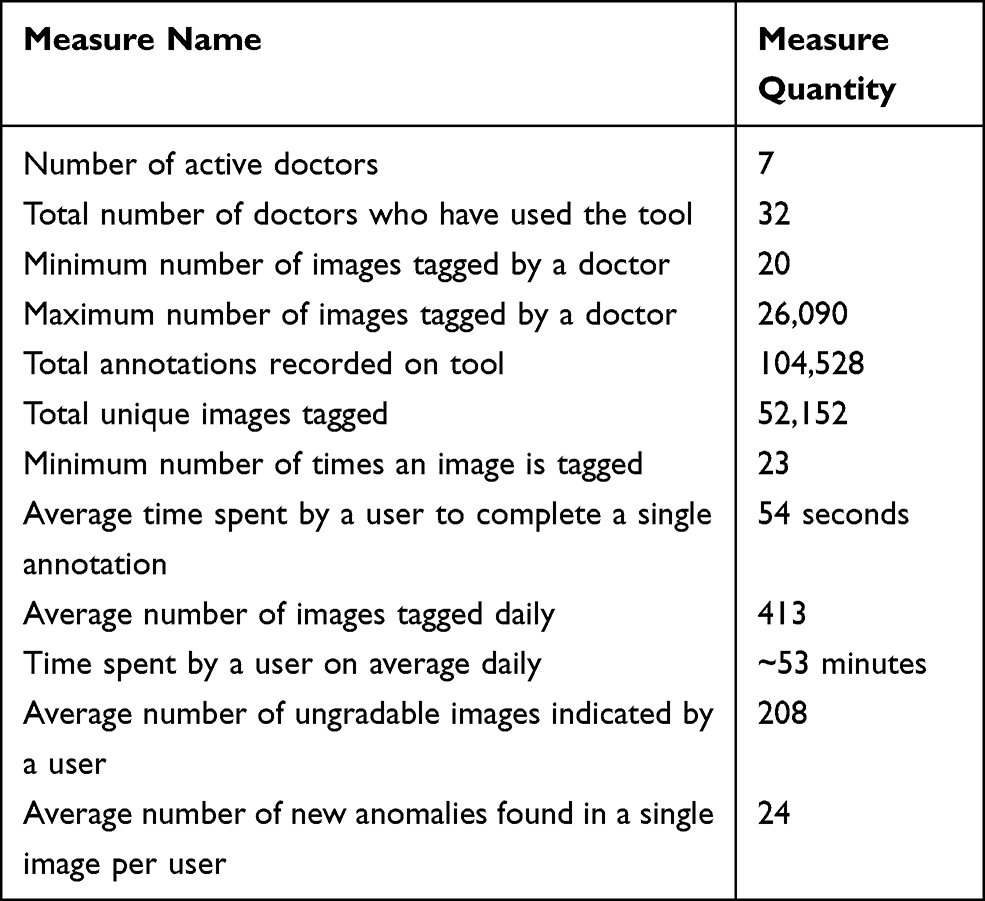 |
Table 1 General Statistics and Data Analysis for Tool Usage |
Moving on from the general analytics, we focus on the time frames in a single day and we average out the total annotations recorded per hour, over the whole-time frame of the study which is 10 months. Figure 8 shows the graph displaying the average-total hourly annotations over 10 months bucketed by hour of the day as the X-axis and number of annotations as the Y-axis.
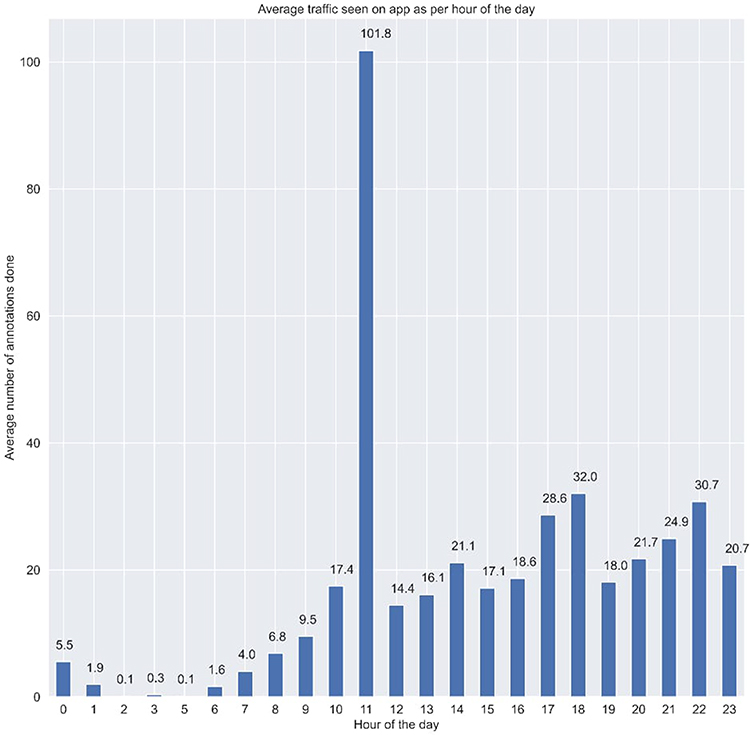 |
Figure 8 Graph displaying the average-total hourly annotations over 10 months bucketed by hour of the day as the X-axis and number of annotations as the Y-axis. The x-axis represents the day of the week and the yellow line represents the daily target assigned as per choice ie the number of images graded on that day. We have added these details to the figure legend. |
The above figure shows the trend of the average number of annotations recorded at each hour of the day for the entire duration of the study. We can see that other than 4 AM in the morning, we have seen a minimum of 1 annotation being made. It’s quite interesting to find out that a peak is seen at around lunch time and thereon a constant number of annotations are being made till 11PM. This trend also reconciles with the verbal survey conducted with each of the active annotators who went on to say that they have been using this tool in their free time, during lunch time, time between patient visits and post duty hours when they are at home. This trend signifies the portability and flexibility of the tool being used in free time after a hospital shift of any annotator, or in between patient visits in clinics, etc., which makes it suitable for any kind of annotator, they being a clinician, serving in hospitals or an academician.
Next, we analyse the feature usage of Red-free imaging accessed, brightness changes and by how much were they varied, and also the correlation of these with the overall verdict for an image (Figure 9).
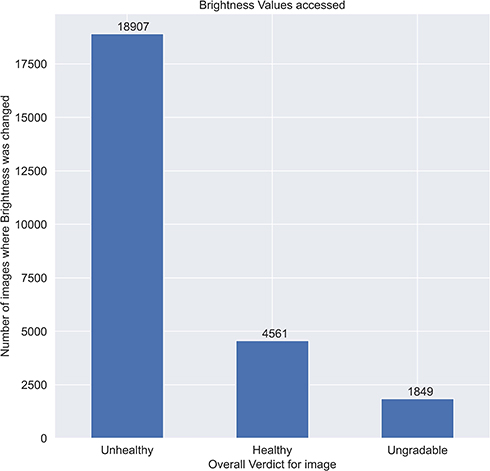 |
Figure 9 Feature usage of red-free imaging accessed, brightness changes and by how much were they varied, and also the correlation of these with the overall verdict for an image. |
The Brightness slider is used almost 20% of the times by the graders out of which as seen in Figure 9, grouping by the overall verdict, most of the times the brightness is varied for unhealthy cases.
The green channel image is accessed at least 5% of times by the graders out of which as seen in Figure 10, grouping by the overall verdict, most of the times the green channel is used for unhealthy cases.
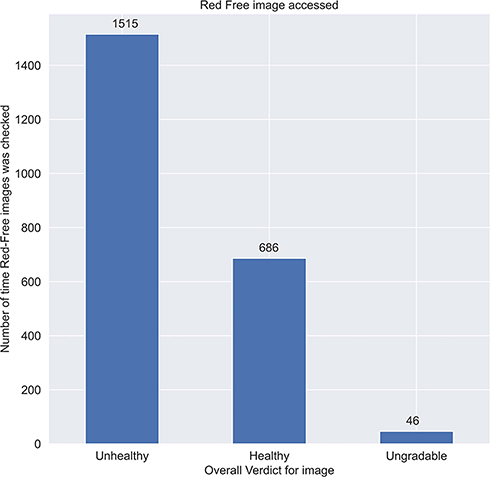 |
Figure 10 Graph showing green channel image is accessed at least 5% of times by the graders out of which grouping by the overall verdict, most of the times the green channel is used for unhealthy cases. |
These are mere subjective claims but it shows that the features implemented are being used to make decisions.
We also verify the stickiness or addictiveness of the tool by plotting the average time taken per annotation (in seconds) by some of the active Grader pool to plot the first 100 images versus the last 100 images annotated (Figure 11).
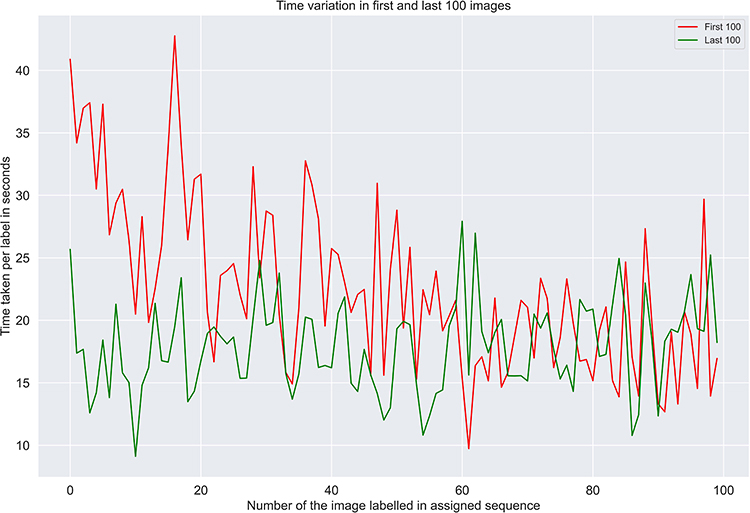 |
Figure 11 Verifying the stickiness or addictiveness of the tool by plotting the average time taken per annotation (in seconds) by some of the active grader pool to plot the first 100 images versus the last 100 images annotated. |
We can clearly see that the time taken per image has significantly decreased from an average of approximate 22 seconds to around 17 seconds per image. This may not be significant for individual images but when annotating thousands of images, this is a significant decrease.
Qualitative Data Analysis
It is evident from the data shown in the quantitative analysis section about the assumptions made to justify the temporal and aid in decision-making aspects. But no annotation process is complete without Quality control measures. Here we assess the quality of the annotations recorded and by seeing the extra abnormalities marked by the Graders given the small screen. Also, to further support the claim of the good quality of the annotations, we present the basic agreement statistics such as the agreement percentage also termed as joint probability of agreement and Cohen’s kappa wherever possible to calculate. These metrics shall be reported over all the disease types combined because a detailed analysis of the Quality control procedure deserves its own paper which shall be written soon. Finally, we assess the quality of a DL model trained using this data with adjudication for the first annotation cycle and its metrics over some popular public datasets.
It is astounding how the grader behaviour adapted to the smaller viewport given the large number of comorbidities spotted by them in the retinal images. We show some of the example images and their associated abnormalities which were not present if any original grading existed (Figure 12).
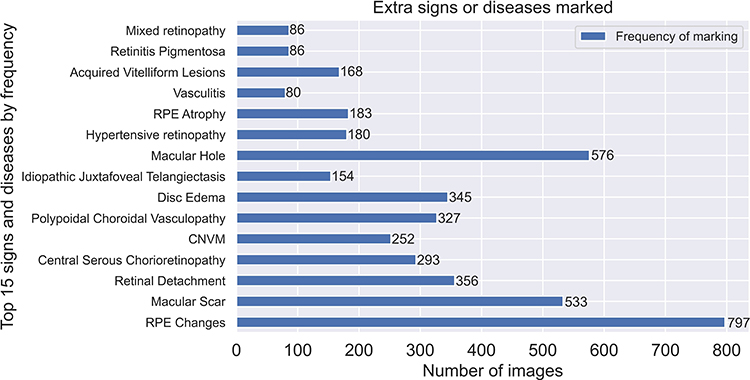 |
Figure 12 Top 15 signs and diseases by frequency. Abbreviations: RPE, retinal pigment epithelial; CNVM, choroidal neovascular membranes. |
Curation of the Baseline Set
The Baseline Set, as already mentioned, consisted of 550 images chosen from publicly available datasets. Only a few of these images had their ground truth verified against gold standard methods while the majority of images had no gold standard information mentioned. Due to these concerns, we do not consider the ground truth provided along with these datasets while conducting our adjudication process. We chose 250 images from APTOS, 250 from ODIR, 25 from Drishti-GS and rest of the 25 images from our own private datasets. These 250 images from APTOS and ODIR were again chosen as per their original DR grade with 25 images from each of the 5 DR grades. The 25 images chosen from Drishti-GS were Glaucomatous as per their adjudication provided and other 25 were also glaucomatous or showed suspicion, chosen from a private set.
Grader Variability and Agreement Statistics for Baseline Set
We assess the Grader variations for standard diseases reported such as DR, DME, ARMD and Glaucoma. We cannot report the agreement statistics revolving around each and every participant as it is out of the scope of the study, but we mention the minimum and maximum agreement reported among the grader pool. The number of images used to assess agreement is 550 (Table 2).
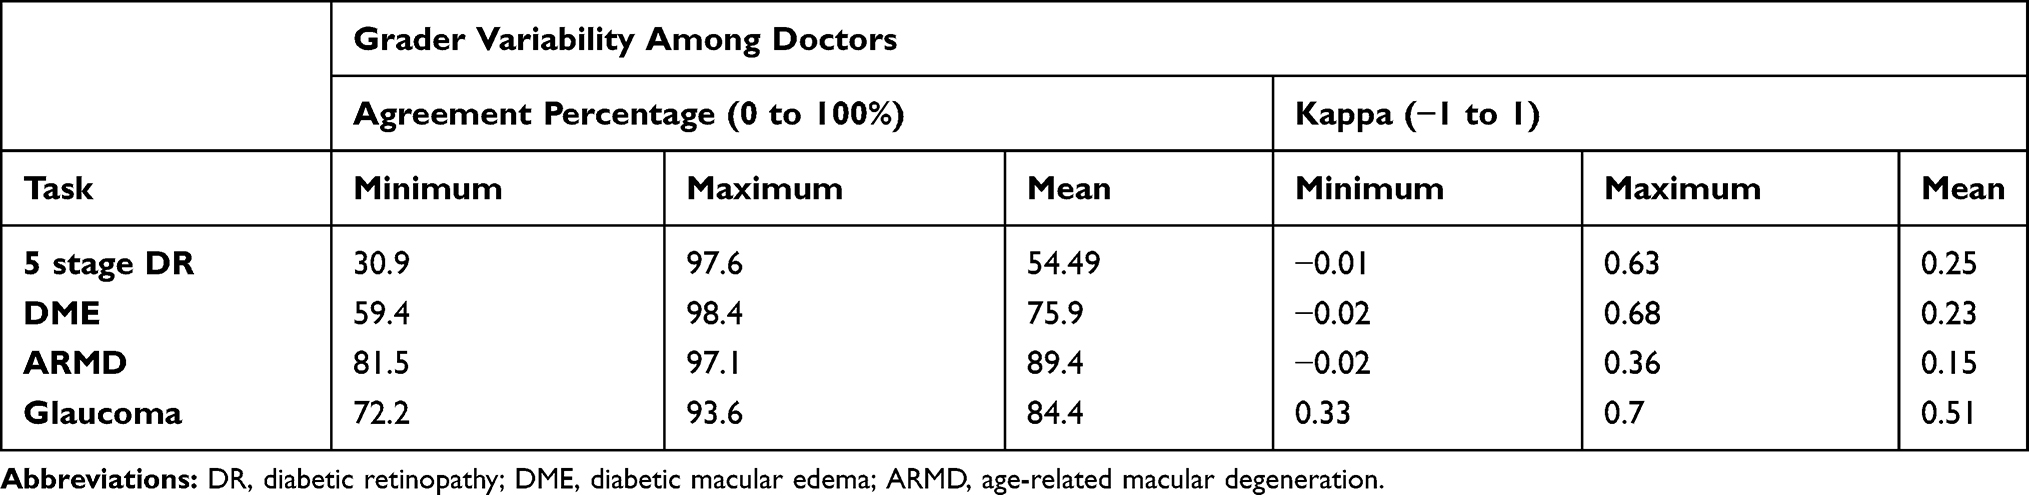 |
Table 2 Multi-Grader Variability Statistics as per Tasks/Disease Categories |
Given a limited time span, we present some of the early work on using the annotations to create a DL model and analyse its performance for the Referrable DR Classification task. The task is a binary classification task to classify whether a retinal image has Referrable DR or not. The dataset size was approximately 16,000 images with adjudicated labels by a minimum of 2 doctors with a relatively balanced categorical distribution. Given a relatively smaller dataset, we performed 5-fold Cross Validation on the data and planned to use these 5 models as a voting ensemble. The outputs of each model were averaged to determine the final prediction per image. We validate the models against the Baseline set, IDRiD train set and APTOS train set (excluding images used in the Baseline Set) datasets. Metrics such as Accuracy, Sensitivity, Specificity, Precision, Recall, F1 score and AUC have been reported (Table 3).
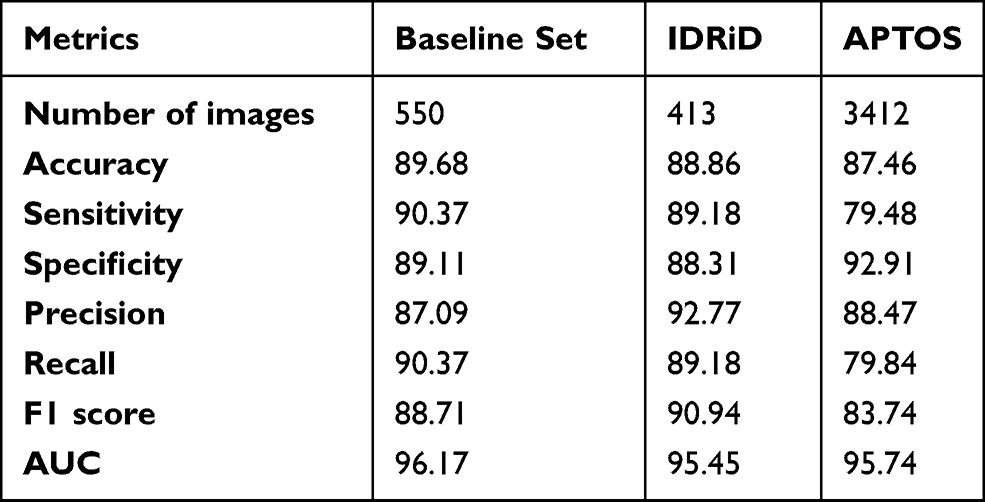 |
Table 3 Results for AI Classifiers Trained Using Data Annotated by Multiple Experts Using the Smartphone App |
Grader Information
The graders consisted of two groups; the first group involved the core members who were instrumental in development of the grading system since its inception. All of them had a minimum of 5 years’ experience in the diagnosis and treatment of vitreoretinal diseases. The second group consisted of clinicians who were recruited based on their responses to an online survey that consisted of a test data set of 20 retinal fundus images with diverse retinal findings. Many residents, general ophthalmologists, glaucoma specialists and ophthalmologists from other specialities responded. They were included as grader based on the quality of their responses, professional and research experiences and willingness to be part of the study. All of them were explained about the agreement to work as a grader for the present study. All the annotators involved are Subject Matter Experts belonging to specializations such as Retinal surgeon, Glaucoma and General Ophthalmology. The average experience of an annotator is 8 years after post-graduation with a minimum of 3 to a maximum of 13 years of experience in their respective fields. Among these, 28 of the graders were certified retina specialists, 2 were certified glaucoma specialists and 2 general ophthalmologists.
The tool works in a web browser and is independent of any smartphone’s underlying operating system. This is a login only tool and sign ups happen through the admin team so that no unauthorised person gets access to data.
Results
The AI model trained using images annotated with this smartphone-based web app shows the usefulness of this tool and solidifies grounds for usage in other use medical cases as well. The Graders have adapted to assessment on smaller screens which is the most convenient medium available. The validation on publicly available datasets from reputed institutes shows that annotations done on a smartphone-based tool are not worse than using any desktop-based tools. The intriguing part about the usage was that with the desktop-based online tools, in our experience we saw the usage and annotations happening only during the weekends and very minimal tags done during the weekdays during the evening time. The average usage of our tool showed that graders have been using it almost during every hour of the day everyday which proves the mobility and convenience of the tool.
Discussion
As seen in the quantitative analysis section, we see that Green channel imaging is used heavily when there are any of the diseases such as Diabetic Retinopathy and Glaucoma present in a given case. By no means, this study is a software plan, rather it is the specification of building a framework of how one can establish an image labelling interface for any task and what all aspects should be kept in mind while building one. There is a huge scope of improvement in the gamification, metric reporting and time optimization aspects which shall be slowly incorporated. Some of the improvements being:
- Establishment of a leader board with anonymization for annotation rate by time and automated adjudication based overall quality score.
- Earning Badges on completing milestones.
- Tiled Image gallery to view example images with grades achieved by the adjudication of tags created by fellow graders to review.
- Suggestive AI-based annotations which can bring down the time drastically by transforming the tagging from doing granular annotations to only correcting the errors of an AI model making it a Yes or No game.
- Weekly reporting of progress and metrics along with the improvement in the level of sophistication of AI models trained using tagged data.
- Push notifications for achievements, communication, set assignment information, etc.
Conclusion
The main objective was to provide a mobile experience while minimizing efforts from the grader’s end. The user feedback and feature usage statistics validate our hypothesis of usage of features like brightness variations, green channel and zoom capabilities which correlate to certain disease types. Basic gamification techniques help gain speed for the quantity of annotations done in specific time intervals. The user experience is addictive as per user feedback and chunked tasks help make the experience less overwhelming. The AI results prove the viability of the smartphone-based tool which can be easily adapted not only for healthcare but multiple different domains. An imminent extension of this tool is foreseen for telemedicine and smarter patient management.
Disclosure
The authors report no conflicts of interest in this work.
References
1. Krizhevsky A, Sutskever I, Hinton: G. ImageNet classification with deep convolutional neural networks. NPIS. 2012;1:1097–1105.
2. LeCun Y, Kavukcuoglu K, Farabet C. Convolutional networks and applications in vision.
3. Russakovsky O, Deng J, Su H, et al. ImageNet large scale visual recognition challenge. Int J Comput Vis. 2015;115(3):211–252. doi:10.1007/s11263-015-0816-y
4. AI system is better than human doctors at predicting breast cancer. Available from: https://www.newscientist.com/article/2228752-ai-system-is-better-than-human-doctors-at-predicting-breast-cancer/#ixzz6Tm62cEbz.
5. Halevy A, Norvig P, Pereira F. The unreasonable effectiveness of data. IEEE Intell Syst. 2009;24(2):8–12. doi:10.1109/MIS.2009.36
6. Labelbox. Available from: https://labelbox.com/.
7. Supervise.ly. Available from: https://supervise.ly/.
8. LabelImg. Available from: https://github.com/tzutalin/labelImg.
9. Everything you need to know to successfully develop your data annotation processes. Available from: https://medium.com/thelaunchpad/spinning-up-an-annotation-team-c74c6765531b.
10. Gulshan V, Peng L, Coram M, et al. Development and validation of a deep learning algorithm for detection of diabetic retinopathy in retinal fundus photographs. JAMA. 2016;316(22):2402–2410. doi:10.1001/jama.2016.17216
11. Wei Q, Li X. Learn to segment retinal lesions and beyond. arXiv: 1912.11619v1 [cs.CV]. 2019.
12. Haloi M. Improved microaneurysm detection using deep neural networks. ArXiv: 1505.04424 [Cs]. arXiv.org. July 2016. Available from: http://arxiv.org/abs/1505.04424.
13. Lam C, Yu C, Huang L, et al. Retinal lesion detection with deep learning using image patches. Invest Ophthalmol Vis Sci. 2018;59(1):590–596. doi:10.1167/iovs.17-22721
14. Park SJ, Shin JY, Kim S, et al. Image reading tool for efficient generation of a multi-dimensional categorical image database for machine learning algorithm training. J Korean Med Sci. 2018;33(43):e239. doi:10.3346/jkms.2018.33.e239
15. Rasta SH, Partovi ME, Seyedarabi H, Javadzadeh A. A comparative study on preprocessing techniques in diabetic retinopathy retinal images: illumination correction and contrast enhancement. J Med Signals Sens. 2015;5(1):40–48. doi:10.4103/2228-7477.150414
16. Abràmoff MD, Lou Y, Erginay A, Clarida W, Ryan Amelon JC. Improved automated detection of diabetic retinopathy on a publicly available dataset through integration of deep learning. Invest Ophthalmol Vis Sci. 2016;57(13):5200–5206. doi:10.1167/iovs.16-19964
17. Krause J, Gulshan V, Rahimy E, et al. Grader variability and the importance of reference standards for evaluating machine learning models for diabetic retinopathy. Ophthalmology. 2018;125(8):1264–1272. doi:10.1016/j.ophtha.2018.01.034
18. Schaekermann M, Hammel N, Terry M, et al. Remote tool-based adjudication for grading diabetic retinopathy. Trans Vis Sci Tech. 2019;8(6):40. doi:10.1167/tvst.8.6.40
19. Bababekova Y, Rosenfield M, Hue JE, Huang RR. Font size and viewing distance of handheld smart phones. Optom Vis Sci. 2011;88(7):795–797. doi:10.1097/OPX.0b013e3182198792
20. A new image format for the Web. Available from: https://developers.google.com/speed/webp.
21. Kaggle diabetic retinopathy detection competition. Available from: https://www.kaggle.com/c/diabetic-retinopathy-detection.
22. Decencière E, Etienne D, Xiwei Z, et al. Feedback on a publicly distributed image database: the messidor database. Image Anal Stereol. 2014;33(3):231–234. doi:10.5566/ias.1155
23. APTOS. Blindness detection; 2019. Available from: https://www.kaggle.com/c/aptos2019-blindness-detection/.
24. Peking university international competition on ocular disease intelligent recognition. Available from: https://odir2019.grand-challenge.org/dataset/.
25. Porwal P, Pachade S, Kamble R, ManeshKokare G, Deskmukh VS. Indian diabetic retinopathy image dataset (IDRiD). IEEE Dataport. 2018. doi:10.21227/H25W98
26. Sivaswamy J, Krishnadas SR, Chakravarty A, Joshi GD, Ujjwal SA. Comprehensive retinal image dataset for the assessment of glaucoma from the optic nerve head analysis. JSM Biomed Imaging Data Papers. 2015; 2(1):1004.
27. American Academy of Ophthalmology. International clinical diabetic retinopathy disease severity scale, detailed table. Available from: http://www.icoph.org/dynamic/attachments/resources/diabetic-retinopathy-detail.pdf.
28. Abràmoff MD, Lavin PT, Birch M, Shah N, Folk JC. Pivotal trial of an autonomous AI-based diagnostic system for detection of diabetic retinopathy in primary care offices. NPJ Digit Med. 2018;28(1):39. doi:10.1038/s41746-018-0040-6
 © 2021 The Author(s). This work is published and licensed by Dove Medical Press Limited. The
full terms of this license are available at https://www.dovepress.com/terms
and incorporate the Creative Commons Attribution
- Non Commercial (unported, 3.0) License.
By accessing the work you hereby accept the Terms. Non-commercial uses of the work are permitted
without any further permission from Dove Medical Press Limited, provided the work is properly
attributed. For permission for commercial use of this work, please see paragraphs 4.2 and 5 of our Terms.
© 2021 The Author(s). This work is published and licensed by Dove Medical Press Limited. The
full terms of this license are available at https://www.dovepress.com/terms
and incorporate the Creative Commons Attribution
- Non Commercial (unported, 3.0) License.
By accessing the work you hereby accept the Terms. Non-commercial uses of the work are permitted
without any further permission from Dove Medical Press Limited, provided the work is properly
attributed. For permission for commercial use of this work, please see paragraphs 4.2 and 5 of our Terms.