Back to Journals » International Journal of Nanomedicine » Volume 11
Ethyl cellulose nanoparticles as a platform to decrease ulcerogenic potential of piroxicam: formulation and in vitro/in vivo evaluation
Authors El-Habashy S ![]() , Allam A, El-Kamel A
, Allam A, El-Kamel A ![]()
Received 29 July 2015
Accepted for publication 9 December 2015
Published 26 May 2016 Volume 2016:11 Pages 2369—2380
DOI https://doi.org/10.2147/IJN.S93354
Checked for plagiarism Yes
Review by Single anonymous peer review
Peer reviewer comments 3
Editor who approved publication: Dr Thomas Webster
Salma E El-Habashy, Ahmed N Allam, Amal H El-Kamel
Department of Pharmaceutics, Faculty of Pharmacy, Alexandria University, Alexandria, Egypt
Abstract: Nanoparticles (NPs) have long gained significant interest for their use in various drug formulations in order to increase bioavailability, prolong drug release, and decrease side effects of highly toxic drugs. The objective of this investigation was to evaluate the potential of ethyl cellulose-based NPs (EC-NPs) to modulate the release and reduce ulcerogenicity of piroxicam (PX) after oral administration. PX-loaded EC-NPs were prepared by solvent evaporation technique using different stabilizers at three concentration levels. Morphological examination of selected formulas confirmed the formation of spherical NPs with slightly porous surface. Formulation containing poloxamer-stabilized EC-NPs (P188/0.2), having a particle size of 240.26±29.24 nm, polydispersity index of 0.562±0.030, entrapment efficiency of 85.29%±1.57%, and modulated release of PX (88% after 12 hours), was selected as the optimum formulation. Differential scanning calorimetry demonstrated the presence of PX in an amorphous form in the NPs. Fourier-transform infrared spectroscopy revealed the possible formation of hydrogen bond and the absence of chemical interaction. In vivo study, evaluation of pharmacokinetic parameters, evaluation of gastric irritation potential, and histological examination were conducted after administration of the selected formulation. Time to reach maximum plasma concentration, tmax, of poloxamer-stabilized EC-NPs was significantly higher than that of Feldene® 20 mg capsules (P≤0.001). Encapsulation of the acidic, gastric offender PX into NPs managed to significantly suppress gastric ulceration potential in rats (P≤0.05) as compared to that of PX suspension. A reduction of 66% in mean ulcer index was observed. In conclusion, poloxamer-stabilized EC-NPs (P188/0.2) had a significant potential of offsetting deleterious side effects common in PX use.
Keywords: polymeric nanoparticles, poloxamer, NSAIDs, pharmacokinetics, gastric irritation
Introduction
Nonsteroidal anti-inflammatory drugs (NSAIDs) are well recognized for the treatment of inflammatory diseases, such as rheumatic disease, while also being increasingly used for non-rheumatic conditions.1,2 They function by inhibiting cyclooxygenase family of enzymes (COX-1 and COX-2) and provide analgesic and anti-inflammatory benefits. In the same context, it has been suggested that the anti-inflammatory actions of NSAIDs are induced by the inhibition of COX-2, while their adverse effects of ulceration are precipitated by the over-inhibition of COX-1.3 Another contributing factor to gastric side effects of NSAIDs is their local action. NSAIDs are reported to remain in crystalline form in the acidic medium of the stomach.4,5 This crystalline form can be accounted for the prolonged contact of these drugs with the gastric mucosa with consequent high local concentration and irritation-induced ulceration.6
Controlled-release drug delivery systems provide a uniform concentration of drug at absorption site and a plasma concentration within therapeutic range, and minimize the side effects.7
Piroxicam (PX) is an acidic, poorly water-soluble nonsteroidal anti-inflammatory, analgesic, and antipyretic agent.8,9 Though PX is reported to have a potent anti-inflammatory action, its gastric irritation potency is claimed to be equivalent to indomethacin, diclofenac, and ketorolac and higher than many other NSAIDs.10 Irritation can vary from minor gastric discomfort to ulceration and mucosal bleeding. This gastric irritation, as with other NSAIDs, is not merely induced by the inhibition of prostaglandin synthesis but also due to its direct contact with the mucosa as well as its enterohepatic recirculation.7
Gastric irritation side effects associated with conventional routes of PX administration have prompted researchers to investigate the feasibility of alternative drug delivery systems with better gastrointestinal tolerability.11 The severity of these side effects can be reduced, for example, by lowering the peak plasma concentrations and sustaining the drug action.12 Many delivery systems have been developed for controlling PX release rate in order to reduce its associated side effects. For example, a blend of microcrystalline cellulose and hydroxypropylmethyl cellulose matrix pellets loaded with PX was reported to achieve controlled drug release.7 Electro-spinning was also investigated as a new technique in fabricating supersaturating controlled-release drug delivery systems for PX.13 PX and nicotinamide solid dispersions could provide better dissolution and lower ulceration potential than that induced by pure drug.14 Interestingly, a certain study has shown that encapsulation of cyclosporine into polymer-based nanoparticles (NPs) has significantly lowered its nephrotoxicity after oral administration.15
A variety of polymers are applied to the development of polymer-based NPs. Ethyl cellulose (EC) is a biocompatible, nonbiodegradable polymer characterized by a great tolerability and lack of toxicity for patients. With respect to the biological fate of EC-based NPs (EC-NPs) with diameters >200 nm, and up to 5 μm, they are reported to be removed by the cells of the reticuloendothelial system and mechanically filtrated by the spleen and eliminated by renal filtration.16
The objective of this study was to formulate and characterize PX-loaded EC-NPs with an aim to reduce the ulcerogenic potential of PX. Solvent evaporation technique was used with varying concentrations of different stabilizers. In vivo evaluation of the selected formula, evaluation of gastric irritation potential, and histological examination were also carried out.
Materials and methods
Materials
PX was supplied by MUP (Cairo, Egypt). Poloxamer 188 (P188) (Pluronic F68™) was purchased from BASF (Ludwigshafen, Germany). Cremophor A25 (CA25) was kindly provided by Amriya Pharmaceutical Industries. (Alexandria, Egypt). EC, polyvinyl alcohol (PVA), and ethyl acetate (EA) were purchased from El Gomhouria Co. (Cairo, Egypt). Feldene® 10 mg and 20 mg capsules were purchased from Pfizer, Inc. (New York, NY, USA). All other reagents and chemicals were of analytical grade.
Preparation of polymeric NPs
Solvent evaporation technique was used to prepare NPs as follows: PX (10 mg) and EC (20 mg) were dissolved in EA and sonicated to obtain a clear organic phase. A clear solution of the stabilizer in Millipore-filtered (0.4 μm) distilled water served as the aqueous phase. The organic phase was then injected onto the aqueous phase dropwise, during homogenization (Ultra Turrax; IKA Labortechnik, Staufen, Germany) at a rate of 13,000 rpm for 20 minutes in an ice bath. The mixture was then slowly stirred for 24 hours to allow solvent evaporation.
Nine formulas were prepared using three different stabilizers at three concentrations: 0.2%, 0.5%, and 1%; all are encoded and listed in Table 1.
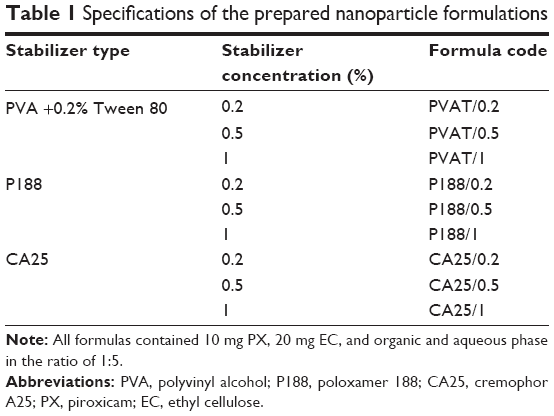 | Table 1 Specifications of the prepared nanoparticle formulations |
Particle size analysis
Particle size analysis was conducted using dynamic light scattering technique (Malvern Zetasizer; Malvern Instruments, Malvern, UK). Samples were diluted with Millipore-filtered water to an appropriate scattering intensity. Measurements were performed in triplicate, and the recorded values were mean ± standard deviation (SD).
Determination of PX entrapment efficiency
A volume of 75 mL of NPs suspension was centrifuged at a speed of 15,000 rpm at 4°C for 45 minutes. Then, 1 mL of the supernatant, containing free unloaded PX, was diluted suitably. The prepared sample was then analyzed spectrophotometrically at 358 nm (UV-160A; Shimadzu, Kyoto, Japan). Drug concentration was computed by fitting the absorbance values into the calibration curve. Percentage entrapment efficiency (EE) was calculated according to the following equation:17
|
|

where [PX] added is the initial concentration of PX in the NPs suspension and [PX] measured is the concentration of PX practically measured in the separated supernatant. Experiments were run in triplicates.
In vitro release study
To prepare dry powdered NPs of selected formulas, suspensions of NPs were centrifuged for 45 minutes at 4°C in a cooling centrifuge (Sigma Laboratory Centrifuge, Model 3K-30; Sigma Laborzentrifugen GmbH, Osterode, Germany) at 15,000 rpm. The formed pellet was dispersed in Millipore-filtered water and then dried in an oven (Memmert GmbH, Schwabach, Germany) at a temperature of 60°C.
PX release study was conducted using selected dried PX-loaded NPs, in amount corresponding to 10 mg PX, and commercially available brand product, Feldene® 10 mg capsules. United States Pharmacopeia apparatus type I (Hanson Research Corp., Chatsworth, CA, USA) was used, and the dissolution medium was 900 mL of HCl (pH 1.2) stirred at a speed of 100 rpm at 37°C. A sample of 5 mL was withdrawn at different time intervals up to 12 hours. Samples were filtered using 0.25 μm polytetrafluoroethylene syringe filter (Sartorius, Gottingen, Germany), replaced by fresh corresponding medium, and analyzed spectrophotometrically at a wavelength of 335 nm.
Evaluation of kinetics of drug release from different formulations was carried out using DDSolver, an add-in program for Microsoft Excel, for modeling and comparison of drug release profiles.18
Scanning electron microscopy
Morphological examination of selected formulas was carried out using scanning electron microscopy (JOEL Ltd, Tokyo, Japan). NPs powder was mounted onto metal stubs using double-sided adhesive tape. The stubs were then coated with gold using a sputter coater. The morphology of particles was then examined.
Differential scanning calorimetry
Thermal behavior of selected NPs was assessed using differential scanning calorimetry (DSC; PerkinElmer, Waltham, MA, USA). Samples were hermetically sealed in an aluminum pan and heated at a speed of 10 mL/min from 30°C to 250°C. Inert atmosphere was maintained by purging nitrogen at a flow rate of 10 mL/min. Thermograms of PX, P188, EC, their physical mixture (PM), in amounts equivalent to the ratios present in P188/0.2 NPs, and P188/0.2 NPs formula were examined. A control empty pan was subjected to the same conditions.
Fourier-transform infrared spectroscopy
Fourier-transform infrared (FT-IR) spectroscopy was used to characterize possible chemical interactions; it was conducted using FT-IR system (PerkinElmer). Samples were finely ground in a mortar and mixed with KBr and then pressed at a pressure of 10 T cm−2 for 5 minutes to form discs. Infrared (IR) spectra were then scanned over the range of 400–4,000 cm−1 using a resolution of 1 cm−1 and 16 scans. Spectra of PX, P188, EC, their PM, in amounts equivalent to the ratios present in P188/0.2 NPs, and P188/0.2 NPs formula were examined.
In vivo study
Experimental animal protocol
Experiments were performed in accordance with the European Community Guidelines for the use of experimental animals and were approved by the Animal Care and Use Committee (ACUC), Faculty of Pharmacy, Alexandria University. Male Wistar rats, weighing 150–200 g, were fasted overnight but allowed water ad libitum. Twelve rats were divided into two groups, each comprising six rats. Group 1 was administered P188/0.2, while group 2 was administered marketed product, Feldene® 20 mg, both in a dose corresponding to 20 mg/kg. Doses were dispersed in 2 mL water and orally administered using an oral gavage passed through the esophagus into the stomach by a stainless steel catheter with blunt ends. Each rat was anesthetized in an ether-saturated chamber, and 0.5 mL blood samples were collected by puncture at the retro-orbital vein at the following intervals: 0, 0.5, 1, 2, 4, 6, 8, 24, 32, and 48 hours.
Preparation of plasma samples
Blood samples were double-centrifuged (Sigma Laboratory Centrifuge, Model 3K-30) at 5,000 rpm for 10 minutes. An aliquot of 200 μL plasma was added to 50 μL naproxen (NX) and 250 μL acetonitrile. The formed solution was vortexed (vortex mixer VM-300; Gemmy Industrial Corporation, Taipei, Taiwan) for 1 minute and centrifuged, and the supernatant was filtered through 0.2 μm polytetrafluoroethylene syringe filter. An aliquot of 20 μL of the filtered solution was then injected into high-performance liquid chromatography (HPLC) column. PX/NX peak area ratio of each sample was then recorded, and PX concentration was calculated using a calibration curve of PX in plasma.
HPLC of PX
PX was assayed using HPLC method reported by Lust et al,19 with slight modification. HPLC instrument (Agilent Technologies-1260 infinity; Agilent Technologies, Santa Clara, CA, USA) supplied with LC reversed-phase C18 column (Kinetex™; 250×4.6 mm, particle size =5 μm, pore size =100 Å), equipped with Security Guard™ ULTRA cartridge system (4.6 mm) (Phenomenex Co., Torrance, CA, USA) was used. The isocratic mobile phase consisted of 0.05 M KH2PO4 and acetonitrile in a ratio of 60:40. The pH of the mobile phase was adjusted to 3 by addition of 10% orthophosphoric acid, and the mixture was delivered at a flow rate of 1.5 mL/min at room temperature. PX was detected at 230 nm with an injection volume of 20 μL. NX solution (8 μg/mL) was used as an internal standard. The retention time of PX and NX was 5 and 8 minutes, respectively. A calibration curve of PX concentration in plasma was then plotted for quantification purpose. The linearity range of the method was 5–50 μg/mL, with a correlation coefficient (R2) of 0.999. Intraday and inter-day precision were represented by % relative SD, which ranged from 1.13% to 6.61%. Accuracy of the method, demonstrated by % recovery, ranged from 97% to 116%.
Pharmacokinetic study
Pharmacokinetic analysis of the data was performed using PKSolver, an add-in program for Microsoft Excel.20 The area under the curve for the plasma concentration-time profile (AUC0–t and AUC0–inf) was calculated using the linear trapezoidal method. The elimination half-life (t1/2) was computed from the slope of the log plasma concentration of the elimination phase in the plasma concentration-time profile plotted using the least square method. The maximum plasma concentration (Cmax) and the time to reach Cmax (tmax) were subsequently determined. Data were expressed as mean ± SD.
Gastric irritation test
The selected formula, P188/0.2, was tested for its ulcerogenic potential. Male Wistar rats weighing 150–180 g were fasted overnight but allowed water ad libitum. Rats were divided into three groups, each comprising six rats, and placed in cages with floors of wire mesh to prevent coprophagy. Group 1 was administered PX crystalline powder suspended in 0.3% Tween 80 solution, and group 2 was administered P188/0.2 suspended in water, both in a dose corresponding to 30 mg/kg, while group 3 was administered the vehicle, 0.3% Tween 80 solution, as a negative control. Oral administration was performed using an oral gavage. All rats were sacrificed 6 hours after dose administration. Stomach was removed and opened along the greater curvature, from the duodenum to the pyloric sphincter, washed with 0.9% saline, and then examined macroscopically for the presence of ulceration. Ulcers were scored, and ulcer index (UI) was calculated.21 The mean UI in any group was calculated by dividing total ulcer score by number of ulcerated animals. All values were expressed as mean ± standard error.
Histological examination
Immediately after macroscopic examination and ulcer scoring, the stomach was fixed in 10% formalin solution and was then embedded in paraffin for histological examination. Routine histological processing was carried out, where 5–6 μm sections were cut and stained with hematoxylin and eosin for microscopic evaluation.22
Statistical analysis
Analysis of variance was conducted using SPSS 17.0 software (SPSS Inc., Chicago, IL, USA). Duncan post hoc multiple comparisons were applied when required. A P-value of ≤0.05 was considered statistically significant.
Results and discussion
Preparation of polymeric NPs
Emulsification solvent evaporation technique is by far the most popular method used for NPs preparation. However, the main challenge in using this technique is the need for the optimization of various formulation parameters in order to obtain NPs of desirable size and size distribution.23 Since the intestinal uptake of NPs is size-dependent, the particle size is a critical determinant of the fate of orally delivered NPs. On this basis, key parameters influencing NPs size during the formulation process should be tailored.24 Consequently, many preliminary trials were carried out to study the parameters influencing NPs size and size distribution. These parameters included effect of addition of emulsifier, emulsification technique (emulsification method, sonication time following homogenization, and homogenization speed), type of organic solvent, ratio of organic/aqueous phase, and drug loading. Results of preliminary studies manifested that the use of PVA alone as stabilizer was inefficient for NPs formation; consequently, 0.2% Tween 80 was added as an emulsifier in the aqueous phase. The selected optimum emulsification technique was the use of homogenization at 13,000 rpm for 20 minutes. The organic solvent used was EA with an organic/aqueous phase ratio of 1/5.
On the basis of the preliminary trials, three stabilizers were used for further formula optimization and characterization. Stabilizers used were PVA, with 0.2% Tween 80 as an emulsifier, P188, and CA25.
For PVA-stabilized formula, PVA alone showed inefficient stabilization of the formed NPs and flocculates of particles formed on the homogenizer shaft and on the surface of the dispersion.
More efficient stabilization effect was observed upon addition of 0.2% Tween 80 as a surfactant with PVA, due to its effect on interfacial tension of the system. In other words, when the organic phase comes in contact with the aqueous phase, interfacial diffusion of solvents occurs providing the energy for NPs formation. The rate of this interfacial diffusion highly determines NPs size, and it is controlled by the interfacial tension between the two phases.1
The same finding was reported by Paruchuri et al,25 where PVA alone as a stabilizer was not able to stabilize emulsion droplets of irinotecan-loaded poly(lactic-co-glycolic acid) NPs.
Particle size analysis
Results of particle size analysis are listed in Table 2. For P188- and CA25-stabilized formulas, a significant decrease in mean particle size and polydispersity index (P≤0.05) was observed as the stabilizer concentration increased. On the other hand, PVA-stabilized particles showed a significant increase (P≤0.05) in mean particle size and polydispersity index (PDI) as the stabilizer concentration increased.
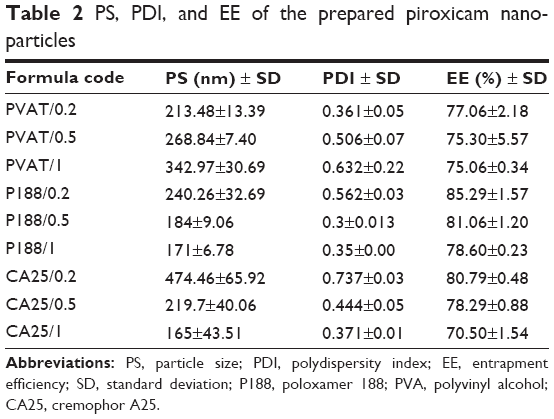 | Table 2 PS, PDI, and EE of the prepared piroxicam nanoparticles |
Duncan test for particle size data of P188- and CA25-stabilized formulas showed that there was no significant difference in particle size of formulas prepared using 0.5% and 1% stabilizer concentration, while 0.2% stabilizer concentration showed a significantly larger particle size (P≤0.05).
PDI data for P188-stabilized formulas showed insignificant difference between PDI of 0.5% and 1% stabilizer concentration, while 0.2% P188-stabilized formulas had a significantly higher PDI value than P188/0.5 and P188/1.
On the other hand, PDI values for CA25-stabilized formulas could significantly fit in the following order: 0.2%>0.5%>1%.
In the same context, Duncan tests for PVA-stabilized formulas showed particle size values to significantly fit in the following order: 0.2%<0.5%<1%. PDI data, on the other hand, showed insignificant difference between PDI values of 0.2% and 0.5% or 0.5% and 1% stabilized formulas, while PDI of PVAT/1 was significantly higher than that of PVAT/0.2.
For P188- and CA25-stabilized formulas, the decrease in particle size and PDI of NPs with the increase in stabilizers concentration can be explained on the basis of their surface activity. P188, chemically, is a block copolymer that is reported to possess a dispersing, emulsifying, and solubilizing effect, while CA25, a nonionic surfactant, is identified as an emulsifying and solubilizing agent with penetration-enhancing effects.26 As their concentration increased, their impact on the system surface tension increased, and energetic conditions were thus favorable for maximum division of the organic phase, and hence maximum contact between the organic and aqueous phase.27 This practically translated into a decreased particle size of emulsion globules and formed NPs.
Meanwhile, for PVA-stabilized particles, the results of particle size analysis could be attributed to coating properties and viscosity-imparting effect of PVA. By increasing PVA concentration, more PVA coats the particle surface in a manner that may cause a significant increase in particle size. Another possible factor is viscosity-imparting properties of PVA, where an increase in the aqueous phase viscosity could decrease the impact of shear stress applied to the system; this may decrease the extent of size reduction.
Entrapment efficiency
Even though particle size and PDI are crucial parameters to be optimized for NPs, EE remains one important determinant of drug release. The larger the drug entrapment within NPs, the higher the concentration gradient between the polymeric particle and the release medium, which highly affects the drug release rate.17
Entrapment efficiency studies, as listed in Table 2, showed a significant decrease in EE of PX (P≤0.05) as the stabilizer concentration in the aqueous phase increased, for P188- and CA25-stabilized formulas, while changing PVA concentration in the external aqueous phase caused insignificant change in EE of PX in PVA-stabilized formulas.
Post hoc Duncan test showed insignificant (P>0.05) difference in the EE of PX for P188/0.5 and P188/1, while EE of PX in P188/0.2 was significantly higher (P≤0.05).
In the same context, Duncan test showed that for CA25-stabilized formulas, EE values could significantly (P≤0.05) fit in the following order: 0.2%>0.5%>1%.
Generally, successful entrapment of a hydrophobic drug into NPs depends on many factors, namely the low drug solubility in the external aqueous medium, rapid precipitation of the polymeric matrix from the organic phase, which in turn depends on its solubility in the external aqueous phase, and finally high solid-state solubility of the drug in the polymeric matrix.28 Accordingly, two different approaches could serve to explain the results of EE.
First, the two colloid stabilizers P188 and CA25 possess emulsifying and dispersing properties. They decreased the surface tension between the organic and aqueous phase that would stabilize an emulsion as well as solubilize the water-insoluble drug.2 Thus, an increase in their concentration in the aqueous phase would allow the diffusion and solubilization of more drugs out of the hydrophobic core into the external aqueous phase.
A different approach can help explain the results in case of PVA-stabilized formulas. PVA is identified as a water-soluble colloid stabilizer with surface-coating properties. Consequently, by increasing the PVA concentration, the polymeric particles would gain a hydrophilic nature due to the increased inclusion of PVA into polymeric matrix of NPs. This would increase the loss of drug in solution.1
In vitro release study
For the release study, three formulas were selected, namely PVAT/0.2, P188/0.2, and CA25/0.2. These formulations were compared to the brand product, Feldene® 10 mg capsules. These formulas possessed optimal EE values together with reasonable mean particle size and PDI.
In vitro release patterns of different formulas at pH 1.2 are shown in Figure 1.
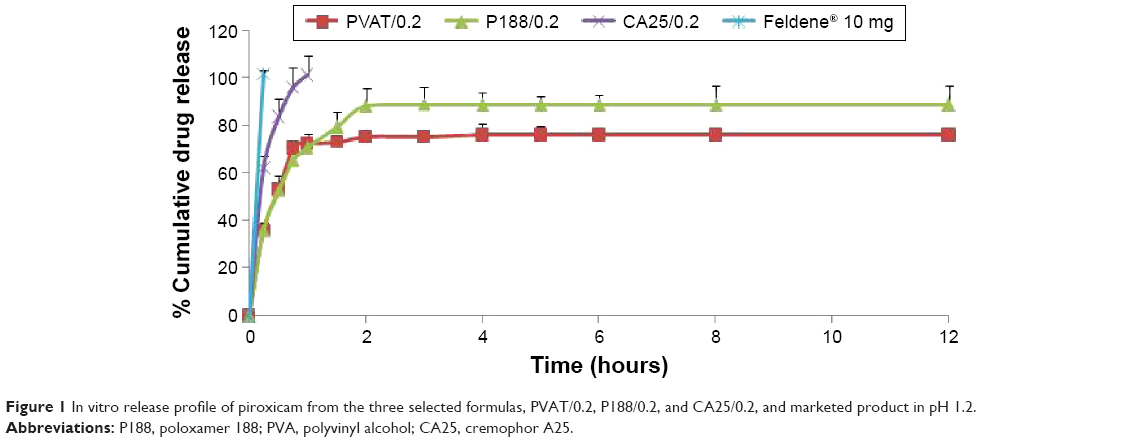 | Figure 1 In vitro release profile of piroxicam from the three selected formulas, PVAT/0.2, P188/0.2, and CA25/0.2, and marketed product in pH 1.2. |
A rapid burst effect of 100% drug release within the first 15 minutes was observed for marketed product. On the other hand, P188/0.2, PVAT/0.2, and CA25/0.2 formulations showed more drug-modulated release pattern, with only 50% of drug released in case of P188/0.2 and PVAT/0.2 formulations and 80% in case of CA25/0.2, after 30 minutes. PVAT/0.2 and P188/0.2 varied in the cumulative percentage of PX released by the end of the experiment. For PVAT/0.2, a cumulative PX release of 75% was observed, while P188/0.2 showed a cumulative PX release of 88% after 12 hours.
It is worth mentioning that the polymeric matrix can be in part accounted for the modulated PX release from NPs. The polymer used in this work is EC, a nonbiodegradable polymer that is not water soluble yet water permeable. It could relatively control the drug release from NPs to different extents where PX, being a weak acid, would be nonionized at pH 1.2. This unionized form would favor to partition in a more hydrophobic matrix, like EC, than in an external aqueous phase.29
This release behavior, however, is not merely encouraged by the polymeric matrix but also obviously affected by the stabilizer used. For PVA-stabilized particles, the slow incomplete drug release could be attributed to the hydrophilic nature, swellability, and coating properties of PVA. It is possible that PVA present on the surface may form a hydrogel barrier to the drug release resulting in a slower and an incomplete release of drug from the polymeric matrix. Similar findings were reported by Vineeth et al,28 where PVA-stabilized poly(lactic-co-glycolic acid) NPs showed a slow release of costunolide, reaching a maximum value of only 86% after 48 hours.
P188/0.2 and CA25/0.2, which are stabilizers with emulsifying properties, can form molecular micelles through the interaction between their hydrophobic portion and the hydrophobic polymer, which could highly affect the release of drug from the formed NPs, in different patterns for both P188 and CA25, possessing different surface activities.2
Drug release data were fitted into various kinetics equations, namely zero-order, first-order, Higuchi, Korsmeyer–Peppas, Hixson–Crowell, Baker–Lonsdale, and Weibull. Coefficient of correlation (R2) and mean standard error (MSE) values were calculated together with kinetics parameters for different models used. Based on the values of correlation coefficients (R2) and MSE, Weibull model was found to be the best model fitting the release profiles of each of PVAT/0.2 (R2=0.976, MSE =18.65) and P188/0.2 (R2=0.996, MSE =3.43). CA25/0.2 release data, however, demonstrated best linearity in case of first-order model equation (R2=0.997, MSE =3.99), describing drug release in a manner proportional to the amount of drug remaining within the formula. Mean dissolution time, indicated by Weibull model as Td, was calculated. Td is representative of the time needed for 63.2% of drug to be released from the dosage form. Td values of the three formulations, PVAT/0.2, P188/0.2, and CA25/0.2, were 0.666, 0.722, and 0.264 hours, respectively. It was obvious that CA25/0.2 demonstrated the higher drug release rate and P188/0.2 offered the lowest one, and hence, P188/0.2 was selected for in vivo drug release study.
Scanning electron microscopy
Morphological examination of selected formulas confirmed the formation of spherical NPs with slightly porous surface, shown in Figure 2. This complies with the typical nature of solid particles formed using emulsion or precipitation methods, due to the favorable energetics associated with minimization of surface area.30 It was also reported that spherical nature of the formed NPs itself provided favorable controlled release of incorporated drug where it provided a long diffusion pathway.17
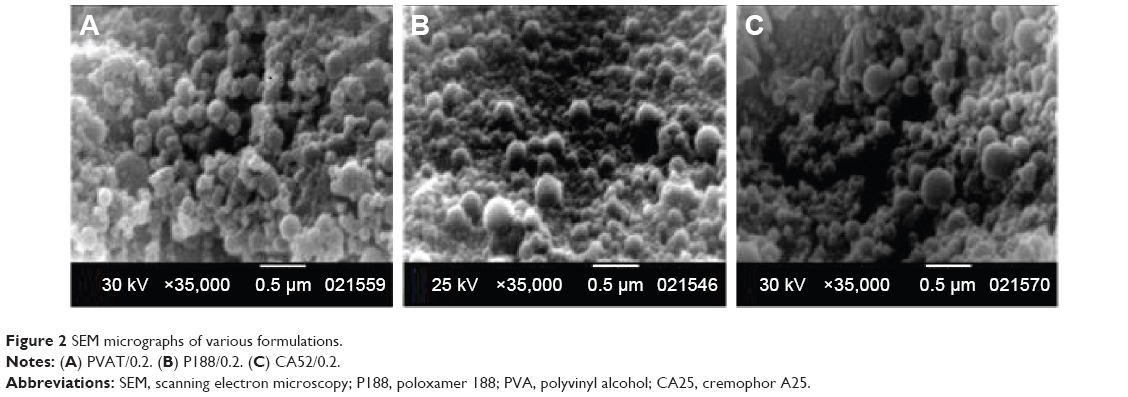 | Figure 2 SEM micrographs of various formulations. |
Differential scanning calorimetry
DSC thermograms of PX, P188, EC, their PM, and P188/0.2 are presented in Figure 3. PX thermogram showed a sharp endothermic peak at 200.5°C that corresponds to the melting point of the crystalline form.7,11 This peak disappeared in the DSC thermogram of P188/0.2, which depicted PX transformation into a molecular dispersion in an amorphous form.31
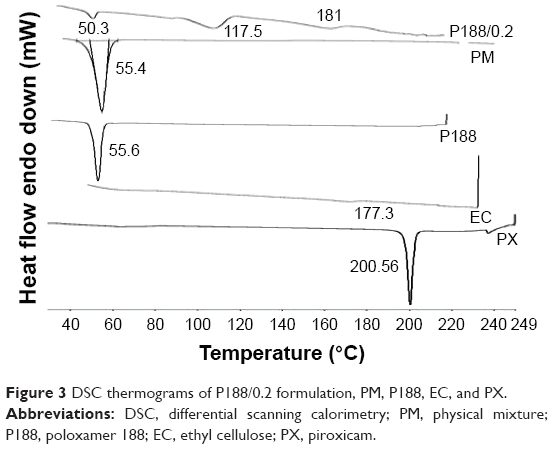 | Figure 3 DSC thermograms of P188/0.2 formulation, PM, P188, EC, and PX. |
In case of P188/0.2 thermogram, a sharp endothermic peak occurred at 50.3°C, representative of P188 and indicative of its presence in a crystalline form.32 Another endothermic peak was reported at 181°C representative of EC melting point. It also showed a broad endothermic peak at 117.5°C that could be due to formation of hydrogen bond between the –OH group on benzothiazine ring of PX and the stabilizer used during NPs preparation.33 PM thermogram only showed an endothermic peak at 55.4°C, representative of endothermic peak of P188.
Taken collectively, DSC results proved no evidence of chemical interaction between the ingredients of the selected formulation. It also confirmed the presence of PX in an amorphous form in the NPs formula.
FT-IR spectroscopy
IR spectra of PX, P188, EC, their PM, and P188/0.2 are illustrated in Figure 4. PX is reported to exist in two different interconvertible crystal polymorphs, a cubic form and a needle form. The band of hydrogen bond donor, amide NH or enolic OH stretching, lies at 3,330 cm−1 for the cubic form and at 3,385 cm−1 for the needle form.11 PX spectrum showed a significant band at 3,336 cm−1, for amide NH or enolic OH stretching; this confirms the cubic form of PX. It also showed significant stretching bands at 1,630 cm−1, for the amide carbonyl C=O, and at 1,351 cm–1, for the S=O stretching.31 EC IR spectrum showed a band at 3,472 cm−1, which could be attributed to the OH stretching vibration.29 P188 spectrum showed characteristic bands at 3,471 cm−1, for OH stretching. It also showed OH bending vibrations at 1,350 cm−1 and C–O–C stretching vibrations at 1,284 cm−1.34 Spectrum of PM was the sum of the spectrum of PX, P188, and EC. As for P188/0.2, a shift of EC band from 3,472 to 3,463 cm−1 may be attributed to hydrogen bond formation.29 In addition, PX bands at 1,630 and 1,351 cm−1 were shifted to 1,641 and 1,385 cm−1, respectively. Concerning P188 bands at 1,350 cm–1, a shift to 1,329 cm–1 was noted. This may be attributed to hydrogen bonding between PX carbonyl or sulfonyl groups and hydroxyl groups in P188.11 In the same context, the disappearance of OH or NH stretching band of PX and the shift of P188 band from 1,284 to 1,238 cm−1 can be explained by hydrogen bond formation between OH or NH of PX and etherial oxygen in P188.35
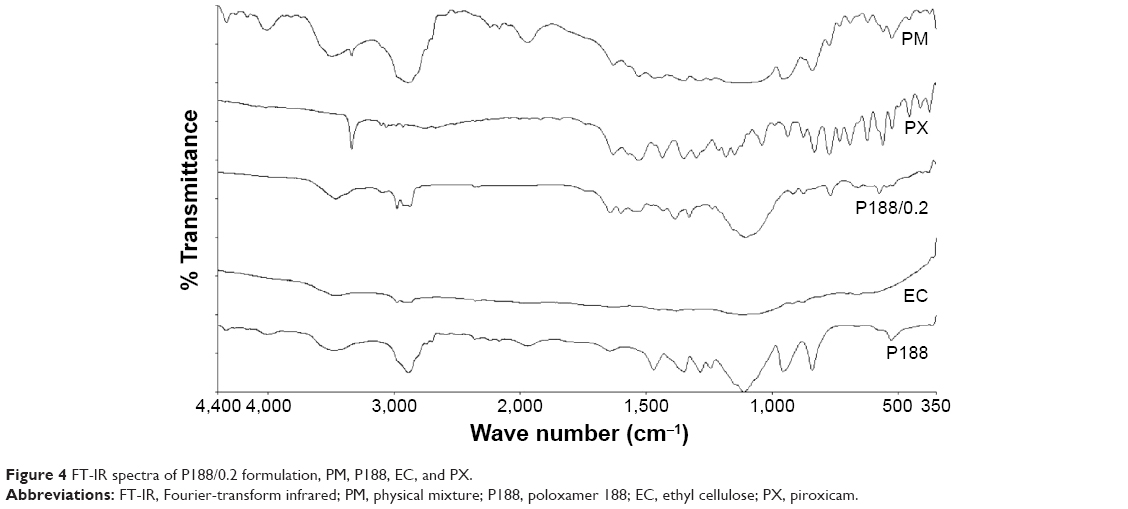 | Figure 4 FT-IR spectra of P188/0.2 formulation, PM, P188, EC, and PX. |
In vivo study
Figure 5 shows the plasma concentration–time profile of PX after oral administration of Feldene® 20 mg and P188/0.2 formulation to rats, in a dose corresponding to 20 mg/kg.
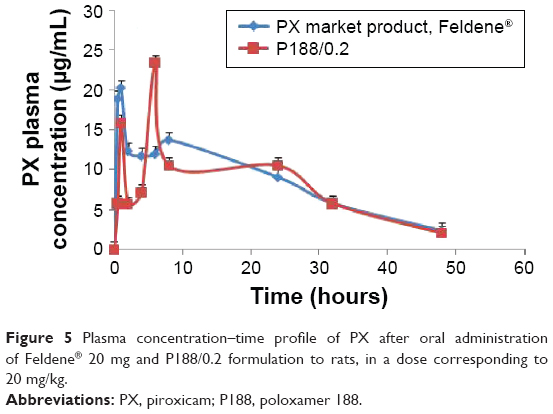 | Figure 5 Plasma concentration–time profile of PX after oral administration of Feldene® 20 mg and P188/0.2 formulation to rats, in a dose corresponding to 20 mg/kg. |
The pharmacokinetic parameters of Feldene® 20 mg capsules and P188/0.2 are summarized in Table 3. Data obtained showed no statistically significant difference (P>0.05) regarding Cmax, AUC0–48, and AUC0–∞. However, the time to reach maximum concentration, tmax, for P188/0.2 formulation was significantly different from that of Feldene® 20 mg (P≤0.001).
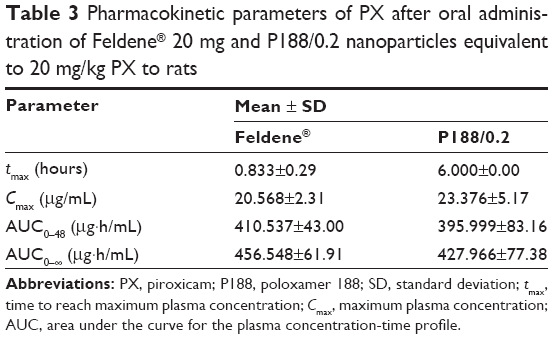 | Table 3 Pharmacokinetic parameters of PX after oral administration of Feldene® 20 mg and P188/0.2 nanoparticles equivalent to 20 mg/kg PX to rats |
In other words, there was no significant difference (P>0.05) in the extent of absorption as indicated by the values of the area under the curve. Meanwhile, an obvious decrease in the rate of absorption, marked by a longer time to reach peak plasma concentration, was recorded in case of P188/0.2. These findings conform with the results of in vitro release study, where P188/0.2 formulation showed modulated release of PX, while Feldene® exhibited a very rapid dissolution with 100% PX dissolved within the first 15 minutes. It is worth mentioning that the double peaks observed in the plasma concentration–time curves of both Feldene® and P188/0.2 formulation were previously reported by Joseph et al.36 It could be attributed to variation in region-dependent absorption, gastric emptying, intestinal transit rates, and intestinal bacterial reconversion of biliary metabolite. The fact that PX is mainly eliminated through the biliary route could also account for multiple peaking in plasma due to enterohepatic circulation.37
Gastric irritation testing
Morphological examination
Initial preliminary experiments were undertaken to optimize time to animal sacrifice. As a preliminary study, rats were sacrificed after 4, 5, and 6 hours. Results showed that ulceration was maximum for rats administered 30 mg/kg PX and sacrificed 6 hours after dose administration. The selected dose was in agreement with the previously reported study that documented a dose of 30 mg/kg PX powder as a positive control for gastric irritation testing.38
Morphological examination of the mucosal surface of stomach, illustrated in Figure 6, showed that in group 1 (PX crystalline powder), the mucosal surface demonstrated severe linear hemorrhagic lesions that penetrated to deeper layers of gastric mucosa, while the stomach of group 2 (P188/0.2) showed less severe gastric lesions with hyperemia and lesions shorter in length and less deeply penetrating. For group 3 (0.3% Tween 80), mucosal surface of stomach was completely unoffended. Protection against gastric ulceration shown in case of group 2 was further confirmed by ulcer scoring and histological analysis.
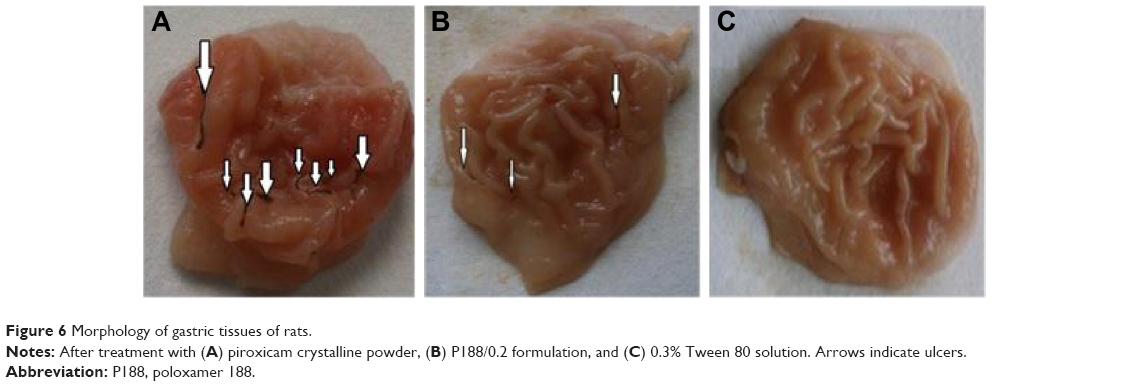 | Figure 6 Morphology of gastric tissues of rats. |
Several models are used to assess ulceration severity, and hence, the choice of a convenient model is sometimes tricky. Generally, the choice of a specific model is influenced by local resources, the objectives of the study, the tested hypothesis, and the convenience regarding the ulcer type. Based on availability of resources and the feasibility of ulcer scoring procedure, Dekanski scoring system, as reported by Adinortey et al,21 was selected for calculation of UI. The system depends on measurement of the length and number of ulcers.
At the given dose (30 mg/kg), group 1 (PX crystalline powder) showed a mean UI of 10.67±0.33. Group 2 (P188/0.2) demonstrated a mean UI of 4±1.437, while group 3 (0.3% Tween 80 solution) showed no ulceration with a mean UI of 0±0 (Figure 7). Statistical analysis showed the lower mean UI value of group 2 to be of high statistical significance (P≤0.001).
 | Figure 7 Ulcer index in rats after administration of PX, P188/0.2 formulation, both in a dose corresponding to 30 mg/kg, and 0.3% Tween 80 solution. |
So, preparation of the acidic, gastric offender drug, PX, in the form of polymeric NPs managed to significantly suppress its gastric ulceration potential in rats. A reduction of 66% in mean UI was detected after oral administration of P188/0.2 in a dose equivalent to 30 mg/kg.
Histological/microscopic examination
Figure 8 shows histopathological images of the stomach of rats treated by PX crystalline powder (group 1), P188/0.2 (group 2), and 0.3% Tween 80 (group 3).
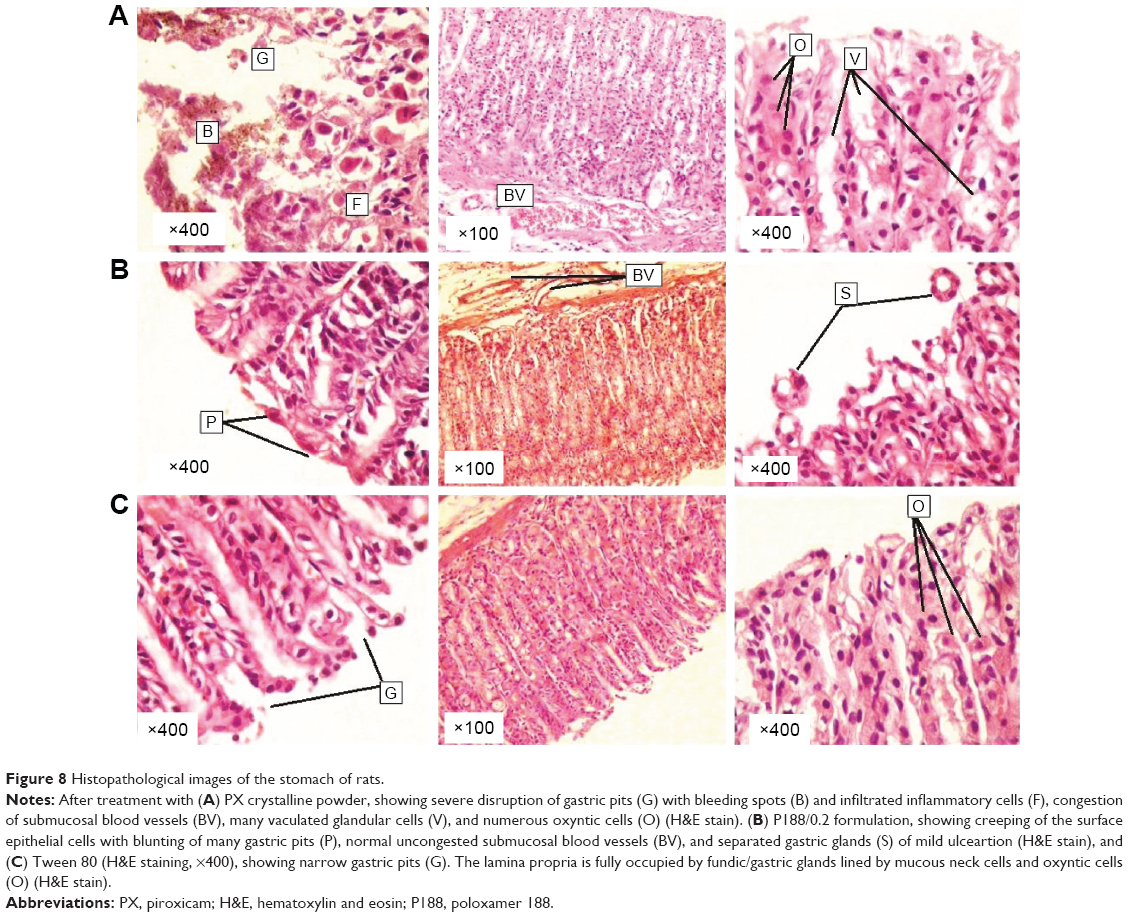 | Figure 8 Histopathological images of the stomach of rats. |
Stomach tissues of group 1 (PX crystalline powder) showed signs of acute gastritis and ulceration with severe disruption of gastric pits, complete loss of mucosa, obvious bleeding spots, and infiltrated inflammatory cells. Also, submucosal blood vessels revealed clear congestion with numerous oxyntic cells and vacuolated stomach cells, indicating cell death. On the other hand, stomach tissues of group 2 (P188/0.2) showed almost normal fundic glands/glandular cells with minute mucosal disruption indicated by detached gastric glands.
This group also showed creeping of the surface-intact epithelial cells along the basement membrane with blunting of many gastric pits indicating tissue regeneration and restoration of epithelial integrity. It also showed uncongested submucosal blood vessels. The negative control group (group 3, 0.3% Tween 80 solution) showed unviolated tissue with narrow gastric pits (G), and the lamina propria fully occupied by fundic/gastric glands, lined by mucous neck cells and oxyntic cells. Images of P188/0.2-treated groups showed evidence of great potential of gastric ulceration protection.
Results of gastric irritation test revealed significant reduction of gastric irritation after administration of PX formulated as NPs (P188/0.2) compared to the positive control (PX crystalline powder). A similar finding was reported by Hu et al,39 where indomethacin NPs incorporated in three dimensional-ordered macroporous silica enhanced indomethacin dissolution and reduced gastric irritation.
The encapsulation of the gastric irritant, acidic drug, PX, in the polymeric matrix of EC-NPs might have limited the direct contact of the drug with gastric mucosa. Furthermore, the amorphous form in which the encapsulated drug existed, as demonstrated by DSC results, could be accounted for the decreased ulceration that would precipitate upon prolonged contact of gastric mucosa with NSAID crystals.
In addition, the development of modulated-release PX NPs with less burst effect and prolonged tmax, compared with the commercial product Feldene®, could help minimize the side effects with less prolonged contact of PX with the gastric mucosa. Meanwhile, PX plasma concentration remained within therapeutic range as indicated by the value of Cmax, compared to the commercial product.
Conclusion
In the present study, EC-NPs were developed to overcome severe gastrointestinal irritation of an NSAID, PX, after oral administration. Formulation was achieved through solvent evaporation technique utilizing different stabilizers. Poloxamer-stabilized NPs provided optimum particle size, size distribution, and EE with modulated release of PX that could ameliorate its gastric side effects. It could be concluded that the EC-NPs have reduced ulcerogenicity, which will open a novel view in the field of NSAID therapy and offer a better management for pain control. However, toxicological and biodistribution studies are required to prove the biological safety of the prepared system.
Acknowledgments
The authors wish to acknowledge Dr Neveen A Elnozahi, lecturer, Department of Pharmacology and Toxicology, Faculty of Pharmacy, Alexandria University, for her great help in the experimental conduction of the gastric irritation test. The authors would also like to acknowledge Professor Hoda M Khalifa, Department of Histology, Faculty of Medicine, Alexandria University, for her help in histological interpretation.
Disclosure
The authors report no conflicts of interest in this work.
References
Cooper DL, Harirforoos S. Effect of formulation variables on preparation of celecoxib loaded polylactide-co-glycolide nanoparticles. PLoS One. 2014;9(12):e113558. | ||
Cooper DL, Harirforoosh S. Design and optimization of PLGA-based diclofenac loaded nanoparticles. PLoS One. 2014;9(1):e87326. | ||
Zidar N, Odar K, Glavac D, Jerse M, Zupanc T. Cyclooxygenase in normal human tissues – is COX-1 really a constitutive isoform, and COX-2 an inducible isoform. J Cell Mol Med. 2009;13:3753–3763. | ||
Mishra DN, Vijaya Kumar SG. Investigations on analgesic, anti-inflammatory and ulcerogenic potential of meloxicam solid dispersion prepared with skimmed milk. Yakugaku Zasshi. 2006;126(7):495–498. | ||
Nagarsenker MS, Meshram RN, Ramprakash G. Solid dispersion of hydroxypropyl beta-cyclodextrin and ketorolac: enhancement of in-vitro dissolution rates, improvement in anti-inflammatory activity and reduction in ulcerogenicity in rats. J Pharm Pharmacol. 2000;52:949–956. | ||
Khachage P, Date AA, Nagarsenker MS. Positively charged polymeric nanoparticles: application in improving therapeutic efficacy of meloxicam after oral administration. Pharmazie. 2011;66:334–338. | ||
Rajesh N, Siddaramaiah. Design and evaluation of controlled release of piroxicam from the pellets of microcrystalline cellulose and hydroxypropylmethyl cellulose blends. Int J PharmTech Res. 2010;2:1465–1473. | ||
Lai F, Pini E, Angioni G, et al. Nanocrystals as tool to improve piroxicam dissolution rate in novel orally disintegrating tablets. Eur J Pharm Biopharm. 2011;79(3):552–558. | ||
Debunne A, Vervaet C, Remon JP. Development and in vitro evaluation of an enteric-coated multiparticulate drug delivery system for the administration of piroxicam to dogs. Eur J Pharm Biopharm. 2002;54:343–348. | ||
Laudanno OM, Cesolari JA, Esnarriaga J, San Miguel P, Bedini OA. In vivo selectivity of nonsteroidal antiinflammatory drugs and gastrointestinal ulcers in rats. Dig Dis Sci. 2000;45(7):1359–1365. | ||
Jug M, Bećirević-Laćan M. Influence of hydroxypropyl-β-cyclodextrin complexation on piroxicam release from buccoadhesive tablets. Eur J Pharm Sci. 2004;21(2–3):251–260. | ||
Ghosh P, Bhise KS, Paradkar AP, Bodhankar SL, Kadam SS. Reduced ulcerogenic potential and antiarthritic effect of chitosan–naproxen sodium complexes. AAPS PharmSciTech. 2012;13:896–902. | ||
Paaver U, Heinämäki J, Laidmäe I, et al. Electrospun nanofibers as a potential controlled-release solid dispersion system for poorly water-soluble drugs. Int J Pharm. 2015;479(1):252–260. | ||
Verma MM, Kumar MT, Balasubramaniam J, Pandit JK. Dissolution, bioavailability and ulcerogenic studies on piroxicam-nicotinamide solid dispersion formulations. Boll Chim Farm. 2003;142:119–124. | ||
Italia JL, Bhatt DK, Bhardwaj V, Tikoo K, Kumar MN. PLGA nanoparticles for oral delivery of cyclosporine: nephrotoxicity and pharmacokinetic studies in comparison to Sandimmune Neoral. J Control Release. 2007;119:197–206. | ||
Arias JL, Lopez-Viota M, Delgado AV, Ruiz MA. Iron/ethylcellulose (core/shell) nanoplatform loaded with 5-fluorouracil for cancer targeting. Colloids Surf B Biointerfaces. 2010;77(1):111–116. | ||
Silva R, Ferreira H, Carvalho AC, Gomes AC, Cavaco-Paulo A. Protein microspheres as suitable devices for piroxicam release. Colloid Surf B Biointerfaces. 2012;92:277–285. | ||
Zhang Y, Huo M, Zhou J, et al. DDSolver: an add-in program for modeling and comparison of drug dissolution profiles. AAPS J. 2010;12(3):263–271. | ||
Lust A, Laidmäe I, Palo M, et al. Solid-state dependent dissolution and oral bioavailability of piroxicam in rats. Eur J Pharm Biopharm. 2013;48(1–2):47–54. | ||
Zhang Y, Huo M, Zhou J, Xie S. PKSolver: an add-in program for pharmacokinetic and pharmacodynamic data analysis in Microsoft excel. Comput Methods Programs Biomed. 2010;99(3):306–314. | ||
Adinortey MB, Ansah C, Galyuon I, Nyarko A. In vivo models used for evaluation of potential antigastroduodenal ulcer agents. Ulcers. 2013;2013:796405. | ||
Alsarra IA, Ahmed MO, Alanazi FK, et al. Influence of cyclodextrin complexation with NSAIDs on NSAID/cold stress-induced gastric ulceration in rats. Int J Med Sci. 2010;7(4):232–239. | ||
Dinda A, Biswal I, Das D, et al. Effect of stabilizers and process parameters for budesonide loaded PLGA-nanoparticles. Int J Drug Deliv. 2011;3(4):371–380. | ||
des Rieux A, Fievez V, Garinot M, Schneider YJ, Preat V. Nanoparticles as potential oral delivery systems of proteins and vaccines: a mechanistic approach. J Control Release. 2006;116(1):1–27. | ||
Paruchuri R, Trivedi S, Joshi SV, Pavuluri G, Senthil Kumar M. Formulation, optimization and characterization of irinotecan nanoparticles. Int J Pharm Chem Biol Sci. 2012;2(1):1–10. | ||
Rowe RC, Sheskey PJ, Quinn ME. Handbook of Pharmaceutical Excipients. 6th ed. London, UK: Pharmaceutical Press, American Pharmacists Association; 2009. | ||
O’Donnell PB, McGinity JW. Preparation of microspheres by the solvent evaporation technique. Adv Drug Deliv Rev. 1997;28:25–42. | ||
Vineeth P, Vadaparthi PRR, Kumar K, Babu BDJ, Rao AV, Babu KS. Influence of organic solvents on nanoparticle formation and surfactants on release behaviour in-vitro using costunolide as model anticancer agent. Int J Pharm Pharm Sci. 2014;6(4):638–645. | ||
Li XW, Yang TF. Fabrication of ethyl cellulose microspheres: chitosan solution as a stabilizer. Korean J Chem Eng. 2008;25(5):1201–1204. | ||
Morgen M, Bloom C, Beyerinck R, et al. Polymeric nanoparticles for increased oral bioavailability and rapid absorption using celecoxib as a model of a low-solubility, high-permeability drug. Pharm Res. 2012;29(2):427–440. | ||
Varshosaz J, Khajavinia A, Ghasemlu M, Ataei E, Golshiri K, Khayam I. Enhancement in dissolution rate of piroxicam by two micronization techniques. Dissolut Technol. 2013;20(3):15–23. | ||
El-Badry M, Fathy M. Properties of solid dispersion of piroxicam in Pluronic F-98. J Drug Deliv Sci Technol. 2004;14(3):199–205. | ||
Karataş A, Yüksel N, Baykara T. Improved solubility and dissolution rate of piroxicam using gelucire 44/14 and labrasol. Farmaco. 2005;60(9):777–782. | ||
Ansari MT, Hussain A, Nadeem S, et al. Preparation and characterization of solid dispersions of artemether by freeze-dried methods. Biomed Res Int. 2010;2015:1–11. | ||
Wu KE, Li J, Wang W, Winstead DA. Formation and characterization of solid dispersions of piroxicam and polyvinylpyrrolidone using spray drying and precipitation with compressed antisolvent. J Pharm Sci. 2009;98(7):2422–2431. | ||
Joseph NJ, Lakshmi S, Jayakrishnan A. A floating-type oral dosage form for piroxicam based on hollow polycarbonate microspheres: in vitro and in vivo evaluation in rabbits. J Control Release. 2002;79(1–3):71–79. | ||
Yüksel N, Karataş A, Özkan Y, Savaşer A, Özkan SA, Baykara T. Enhanced bioavailability of piroxicam using Gelucire 44/14 and Labrasol: in vitro and in vivo evaluation. Eur J Pharm Biopharm. 2003;56(3):453–459. | ||
Basu A, Mitra E, Mukherjee D, et al. Aqueous tulsi leaf (Ocimum Sanctum L.) extract protects against piroxicam-induced gastric ulceration in rats: involvement of antioxidants mechanisms. Int J Pharm Pharm Sci. 2013;5(1):437–447. | ||
Hu Y, Zhi Z, Wang T, Jiang T, Wang S. Incorporation of indomethacin nanoparticles into 3-D ordered macroporous silica for enhanced dissolution and reduced gastric irritancy. Eur J Pharm Biopharm. 2011;79:544–551. |
 © 2016 The Author(s). This work is published and licensed by Dove Medical Press Limited. The
full terms of this license are available at https://www.dovepress.com/terms
and incorporate the Creative Commons Attribution
- Non Commercial (unported, 3.0) License.
By accessing the work you hereby accept the Terms. Non-commercial uses of the work are permitted
without any further permission from Dove Medical Press Limited, provided the work is properly
attributed. For permission for commercial use of this work, please see paragraphs 4.2 and 5 of our Terms.
© 2016 The Author(s). This work is published and licensed by Dove Medical Press Limited. The
full terms of this license are available at https://www.dovepress.com/terms
and incorporate the Creative Commons Attribution
- Non Commercial (unported, 3.0) License.
By accessing the work you hereby accept the Terms. Non-commercial uses of the work are permitted
without any further permission from Dove Medical Press Limited, provided the work is properly
attributed. For permission for commercial use of this work, please see paragraphs 4.2 and 5 of our Terms.