Back to Journals » Clinical Ophthalmology » Volume 19
Ethnicity-Based Differences in Corneal Asphericity: Intraocular Lens Power Calculation, Image Quality, and Visual Acuity After Cataract Surgery Using Eye Models
Authors Das KK, Suryakumar R, Lu W, Maxwell A
Received 11 March 2025
Accepted for publication 7 July 2025
Published 28 July 2025 Volume 2025:19 Pages 2463—2473
DOI https://doi.org/10.2147/OPTH.S527570
Checked for plagiarism Yes
Review by Single anonymous peer review
Peer reviewer comments 3
Editor who approved publication: Dr Scott Fraser
Kamal K Das,1 Rajaraman Suryakumar,1 Wei Lu,1 Andrew Maxwell2
1Research and Development, Alcon Research LLC, Fort Worth, TX, USA; 2California Eye Institute, Fresno, CA, USA
Correspondence: Kamal K Das, Alcon Research LLC, 6201 South Freeway, Fort Worth, TX, 76134, USA, Tel +1 817 615 2563, Email [email protected]
Purpose: To evaluate whether differences in asphericity or corneal spherical aberration (SA) affect intraocular lens (IOL) power and visual acuity (VA) among different ethnicities.
Design: Modeling and simulation study based on published clinical data.
Methods: Individual eye models were developed with corneas designed to represent different ethnicities, based on clinical study data, to simulate and determine SA for a 6-mm pupil. The study included Black, Brazilian, Chinese, Egyptian, Indian, Japanese, Portuguese, Saudi Arabian, Tanzanian, Taiwanese, and White population groups. Corneal SA ranged from 0.17 to 0.31 μm among different ethnic and age groups. Differences in power in model eyes with various ethnic asphericities were assessed using spherical SA60AT, Clareon CNA0T0 (− 0.20 μm SA), and a monofocal aspheric IOL (− 0.28 μm SA). Modulation transfer function (MTF) and VA were calculated at different defocus. Defocus was applied from − 0.5 to 0.5 D, using 0.05 D intervals.
Results: Emmetropic IOL power for CNA0T0 was 20.756 D based on the A-Constant and an SRK/T model with 0.28-μm SA. For all ethnicities with CNA0T0, the maximum IOL power difference was approximately − 0.1 D when compared with an average cornea. For spherical IOL, MTF was 0.562 units at best focus and 0.529 units at 0.1 D defocus; VA was − 0.028 logMAR at best focus and − 0.023 logMAR at 0.1 D defocus. For aspheric IOLs, MTF was 0.604 units at best focus and 0.579 units at 0.1 D defocus; VA was − 0.033 logMAR at the best focus and − 0.030 logMAR at 0.1 D defocus.
Conclusion: The calculated A-Constants for CNA0T0 for different ethnicities ranged from 119.029 to 119.151. Based on the specific model eye generated from published clinical data for each ethnicity and using a spherical and two aspheric monofocal intraocular lenses, the use of a different A-Constant for different ethnic populations would not impact visual outcomes.
Keywords: A-Constant, asphericity, ethnicity, IOL power calculation, spherical aberration, visual acuity
Introduction
Determination of intraocular lens (IOL) power is critical for achieving optimal postoperative refractive outcomes and patient satisfaction after cataract surgery. In the years since the introduction of the first-generation IOL power calculation formula, cataract surgery improvements related to the use of small-incision lenses, the development of multifocal and toric IOLs, and advances in laser surgery have led to increased interest in achieving the best refractive outcomes. Current formulas used to calculate lens power, such as the SRK/T formula,1 are based on a combination of biometric measurements and manufacturer-provided constants. The A-Constant is an empirical value that varies with IOL design, material, and physical properties. It is meant to balance the shortcomings of IOL formula variables and can be optimized based on the patient’s biometric parameters.2
The A-Constant is calculated from a model eye based on clinical parameters to determine the IOL power required for an image to be in focus on the retina. These parameters include axial length of the eye and corneal power to estimate the postoperative axial location of the IOL optic. A specific eye can be modeled in a ray tracing program, and the effects of aberrations can be included in the estimation of the required IOL power.3 The best visual focus is usually achieved by balancing the effects of defocus and the effects of aberrations for the eye. An improved method for predicting the A-Constant to achieve the best target IOL power is an ongoing activity for the ophthalmic communities.
In published reports, different descriptors are used to define corneal shape, including Q-factor, Q-value, eccentricity, p-factor, and shape factor. The Q-value, which does not have units and is usually a negative number, can be used to describe the asphericity of the cornea. Both anterior and posterior corneal asphericity have been reported to be age dependent4,5; age-related decrease in corneal asphericity may cause the aberration of the eye to increase as the cornea becomes more spherical. Corneal asphericity may affect the accuracy of IOL power calculations, affecting visual outcomes and patient satisfaction.6
The natural cornea is aspheric, with a typical range for corneal asphericity (Q values) between −0.03 and −0.33, where Q=0 represents a perfect sphere. The Q value is <0 for prolate corneas (relatively flatter periphery), and Q is >0 for oblate corneas (relatively steeper periphery). A normal cornea is prolate, with an average asphericity Q value of −0.26.7–9 However, substantial variations have been reported in corneal Q values, including among White (mean, −0.20), Black (mean, −0.26),9 Chinese (mean, −0.30),10 Portuguese (mean, −0.24),11 North American (mean, −0.08),12 and Australian (mean, −0.19)13 populations. These variations may need to be considered by surgeons who are working internationally with diverse populations.
Most corneal aberrations stem from the anterior cornea surface.14 Corneal spherical aberration (SA), which is generally represented in microns, can be affected by various factors, including ethnicity, race, and age.15,16 Mean corneal SA in a Tanzanian population was 0.19 µm compared with a range of 0.27 to 0.33 µm in other regions (including populations in North America, Europe, Middle East, and Asia).16 The mean corneal SA for Chinese individuals in Southeast Asia was 0.312 µm compared with 0.27 to 0.281 µm for the populations of Sweden, Canada, and the United States.17
For patients with cataracts, effects of aberrations can be included in the eye model used to estimate the IOL power. The typical modeling method is to use a conic surface to model the physical cornea and to use a Zernike description for the wavefront that passes through the cornea to characterize the aberration. In an average eye, the conic constant value of −0.06 generates approximately 0.28 µm for the SA value of a 6-mm pupil.18
The purpose of this study was to evaluate whether the differences in asphericity or corneal SA would impact the IOL power and visual acuity (VA) for different ethnicities using respective eye models generated from clinical data. To the best of our knowledge, this is the first study to assess the calculations of A-Constants and the differences in IOL powers for corneas across a wide range of ethnicities.
Materials and Methods
Clinical Data
Published clinical data on a wide range of corneal asphericities for different ethnicities across diverse geographic regions were reviewed (Table 1). Included were data on Black, Brazilian, Chinese, Egyptian, Indian, Japanese, Portuguese, Saudi Arabian, Tanzanian, Taiwanese, and White population groups.9,11,15–17,19–23 These studies provided information about race or ethnicity and SA or Q values. For individual models, the standard SA value of a 6-mm pupil was used.
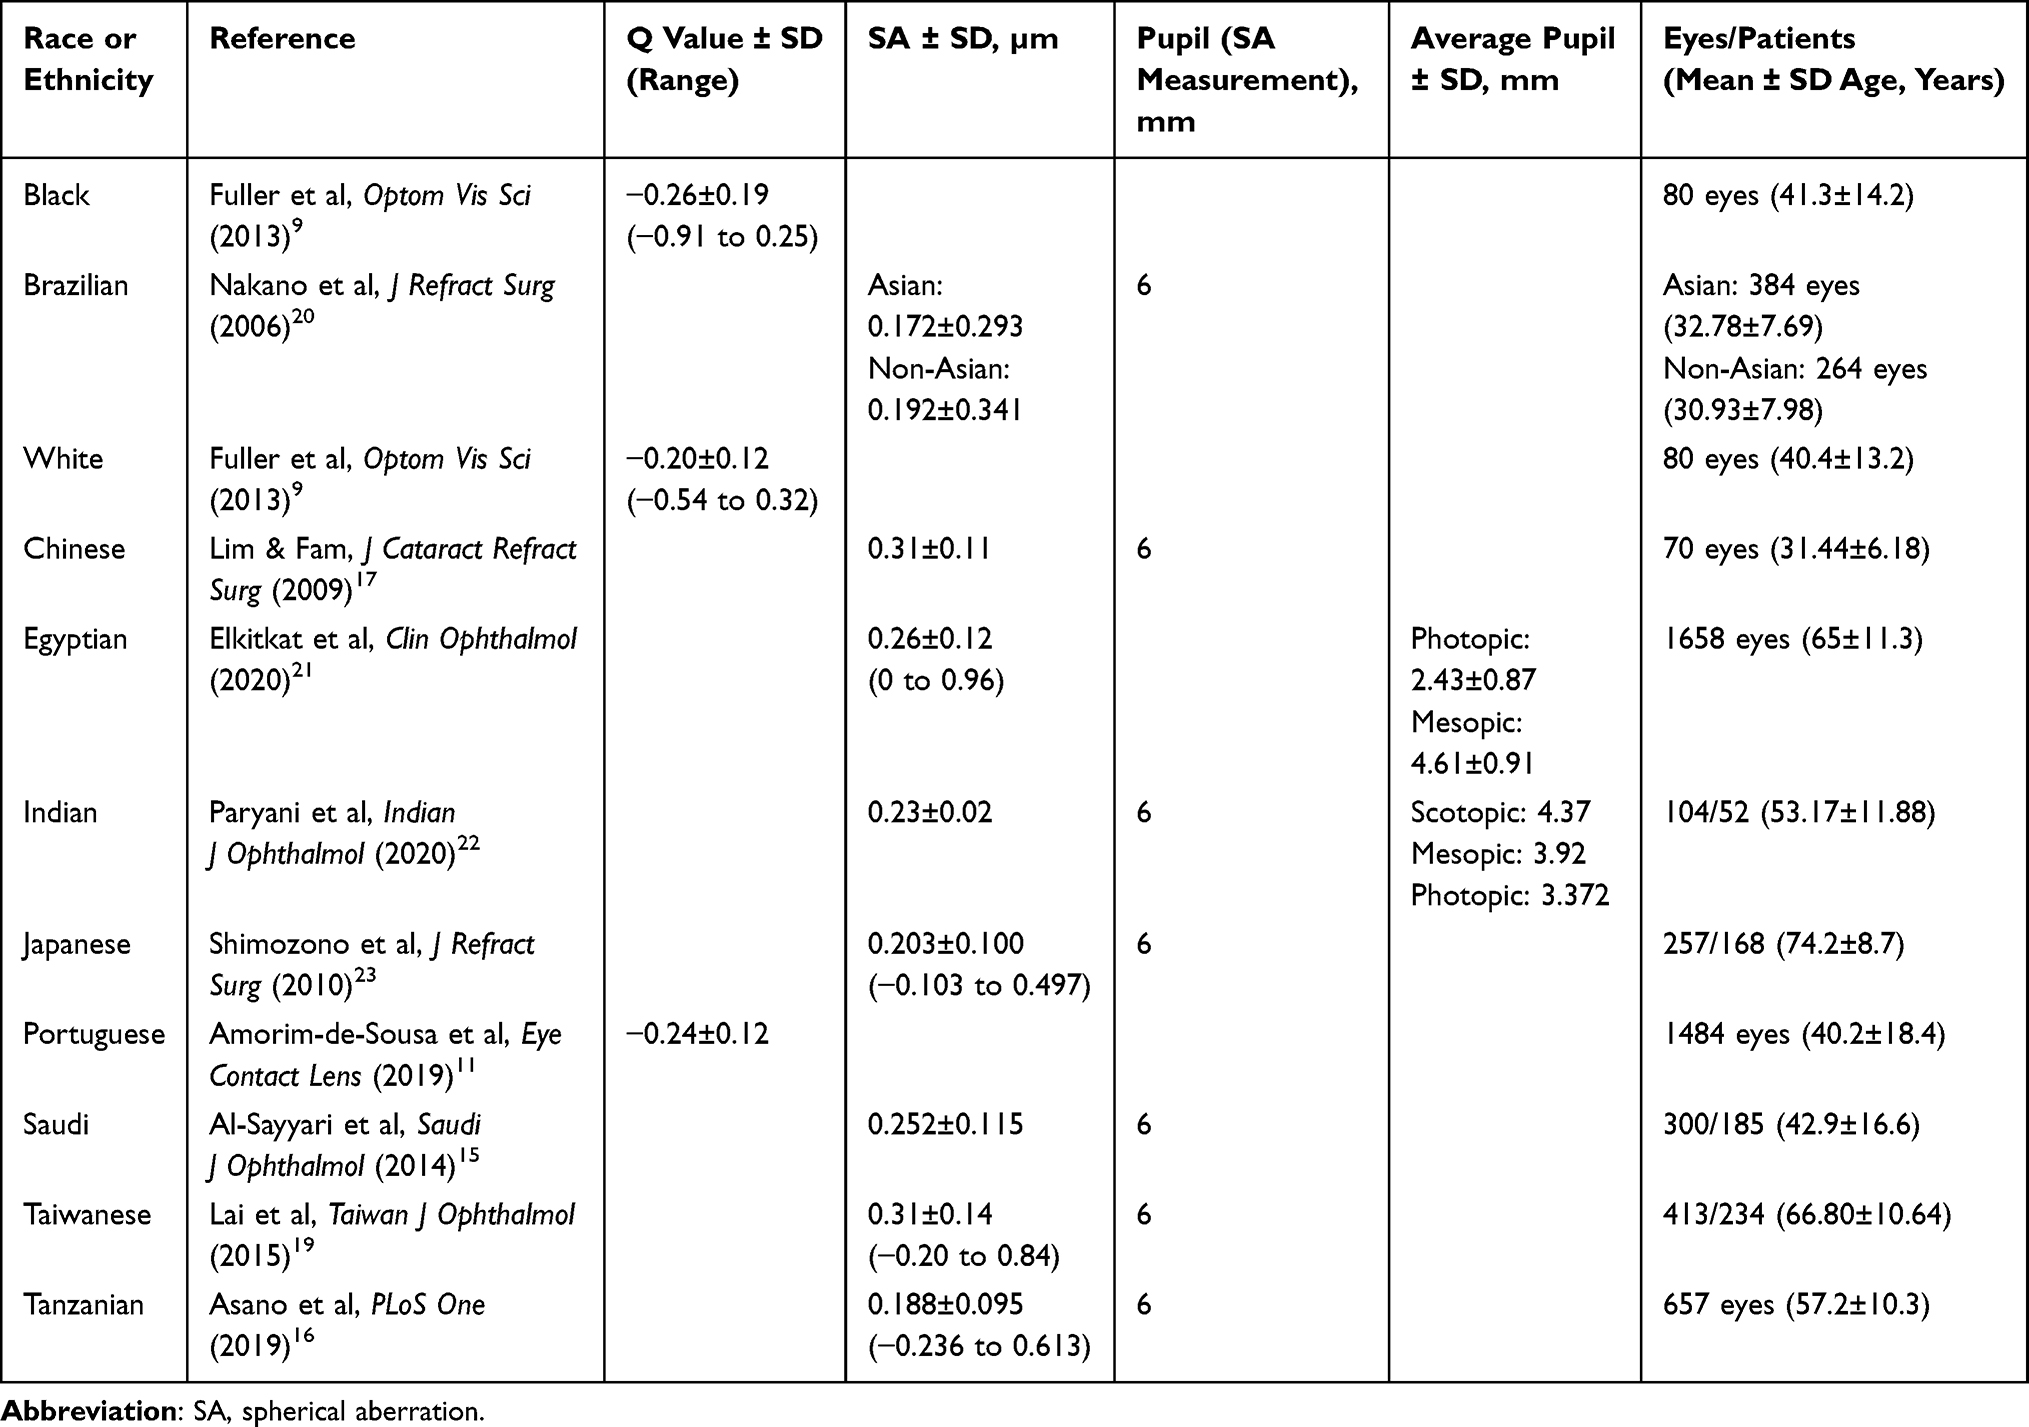 |
Table 1 Summary of Clinical Studies |
Intraocular Lens Power in Model Eyes
Individual eye models were developed, with each cornea design based on published clinical data for a specific ethnic group, to simulate and determine the SA of a 6-mm pupil for each ethnicity. Three different monofocal IOL types were used to assess the difference in power in a schematic model eye with asphericities representative of each ethnic group. First, an aspheric monofocal IOL (Clareon CNA0T0; −0.2 µm SA; Alcon Vision LLC, Fort Worth, TX, USA) was used to form an image on the retina to achieve emmetropia for the average corneal asphericity (Figure 1). The same emmetropic IOL power was set up in each model eye separately to determine the difference in power from the best focus. A spherical monofocal IOL (SA60AT; Alcon Vision LLC) and a monofocal IOL designed to correct the mean SA of −0.28 µm were also used to evaluate the change in modulation transfer function (MTF) and VA values as a function of defocus.
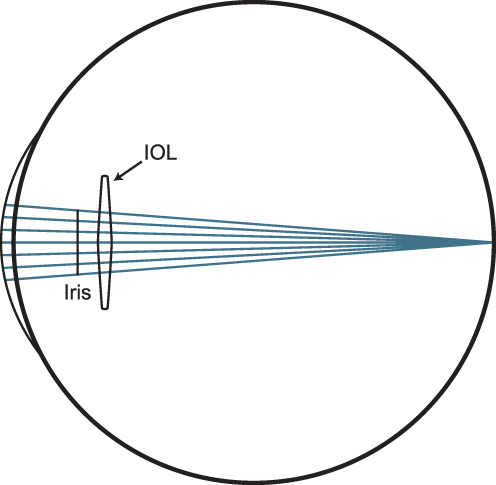 |
Figure 1 Diagram of an IOL in an average schematic model eye to evaluate modulation transfer function and visual acuity. Abbreviation: IOL, intraocular lens. |
A-Constant Calculation in Model Eyes
Emmetropic IOL power was used to determine the A-Constant based on the SRK/T formula in the average model eye with 0.28 µm SA. A-Constant values and IOL powers were then obtained for all other corneal asphericities based on the respective eye model for each ethnicity. MTF and VA were first calculated for a 3-mm pupil for all three monofocal IOLs. The selection of the 3-mm pupil size was based on the relevance to A-Constant and IOL power calculation. IOL power calculations are typically done for a 3-mm pupil to represent distance vision for both monofocal and multifocal IOLs, based on International Organization for Standardization (ISO) guidelines. The EN ISO 11979–2: 2014 guidance recommends a 3-mm aperture to measure either effective focal length or back focal length to obtain the IOL power. MTF and VA values were also obtained for 3-, 4-, and 4.5-mm pupils to investigate the effect of SA on IOL power calculation. The reported pupil sizes are at the IOL plane. The actual pupil size is 5.1 mm at the corneal plane for a 4.5-mm pupil at the IOL plane.
Correlation Between Modulation Transfer Function and Visual Acuity
To assess the impact produced by differences in power, MTF and VA values were calculated for various amounts of defocus. Correlation coefficients between theoretical MTF and clinical VA were assessed for various IOL models using clinical data.24,25 This methodology was applied in a mean cornea with a 3-mm pupil in polychromatic light for the frequency range of 0 to 100 line pairs (lp)/mm, with VA defocus at the spectacle plane.
Modeling results showed a maximum IOL power difference of approximately 0.1 D. The evaluation of the impact of defocus or potential error in power calculation was extended up to 0.5 D to ensure the image quality for a wider range. Defocus was applied from −0.5 D to 0.5 D, using 0.05-D intervals. Polychromatic VA values were obtained using a frequency MTF between 0 and 100 lp/mm of spatial frequency.
Results
The A-Constant value was obtained based on the SRK/T model with a mean corneal SA of 0.28 µm used to calculate the emmetropic IOL power of 20.756 D. The same IOL power was used to determine the difference in power for the corneal asphericities of all ethnic groups. The calculated A-Constants for CNA0T0 ranged from 119.029 in a Taiwanese population to 119.151 in a Tanzanian population (Figure 2A). The maximum IOL power difference compared with the average cornea was approximately −0.11 D for any of the studied ethnicities. For Tanzanian, Brazilian, and Japanese populations, IOL power differences compared with an average cornea were −0.111, −0.107, and −0.076 D, respectively (Figure 2B).
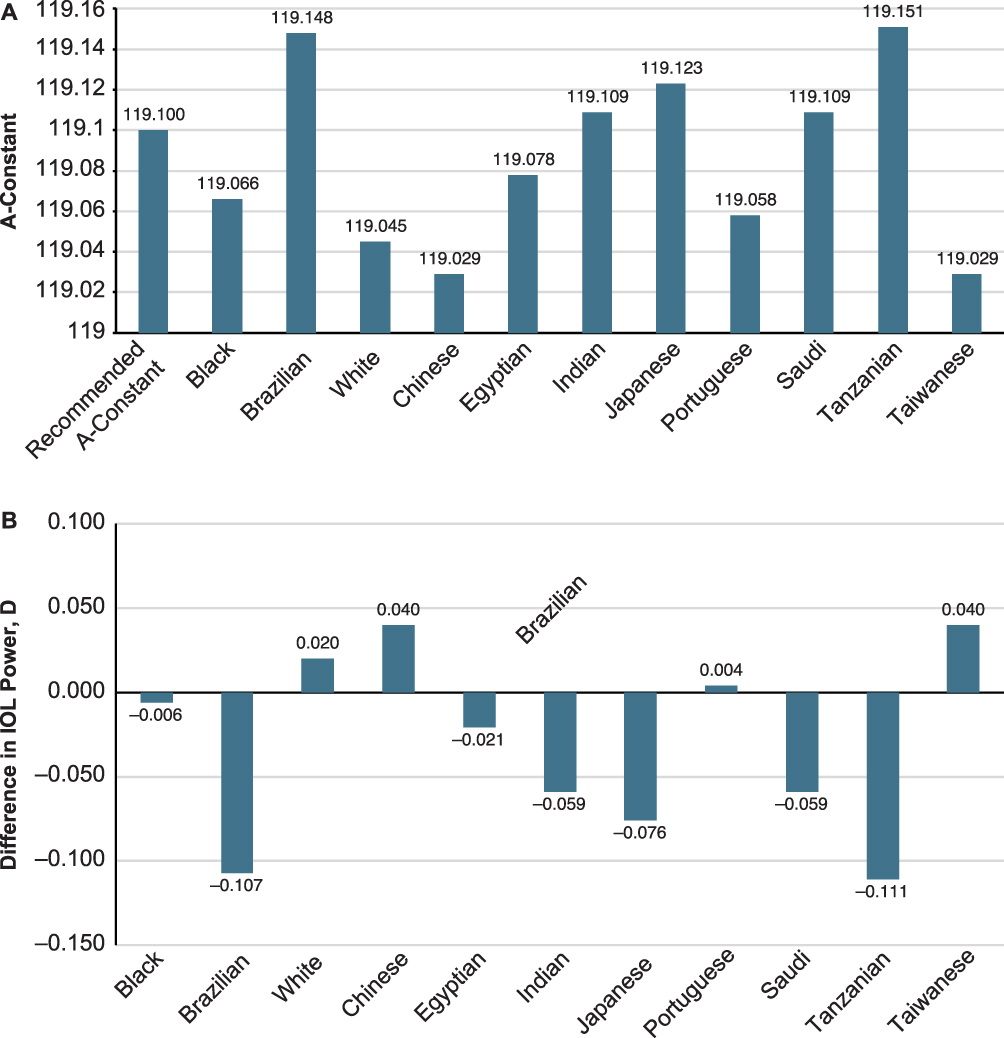 |
Figure 2 A-Constant for CNA0T0 IOL for different ethnic populations (A) and difference in calculated versus recommended effective IOL power for different ethnic populations (B). Abbreviation: IOL, intraocular lens. |
The MTF curves for the spherical IOL (ie, 0 µm SA), aspheric IOL (−0.2 µm SA), and aspheric IOL correcting for mean −0.28 µm of corneal SA in a model eye with an average cornea are shown in Figure 3. The MTF curves for the 2 aspheric IOLs were nearly identical.
 |
Figure 3 MTF comparison of three IOLs with different spherical aberrations in an average model eye. Abbreviations: IOL, intraocular lens; lp, line pair; MTF, modulation transfer function. |
The photopic MTF and VA for the 3-mm pupil were calculated for the spherical and two aspheric IOLs in the same schematic model eye with various amounts of defocus (Figure 4A and B). Photopic MTF for spherical IOL was 0.562 units at the best focus and 0.529 units at 0.1 D defocus. Photopic MTF for both aspheric IOLs were similar: MTF was 0.604 units at the best focus and 0.579 units at 0.1 D defocus. Photopic VA for spherical IOL was −0.028 logarithm of the minimum angle of resolution (logMAR) at the best focus and −0.023 logMAR at 0.1 D defocus. Photopic VA for the aspheric IOLs with −0.2 and −0.28 µm correction was −0.033 logMAR at the best focus and −0.030 logMAR at 0.1 D defocus.
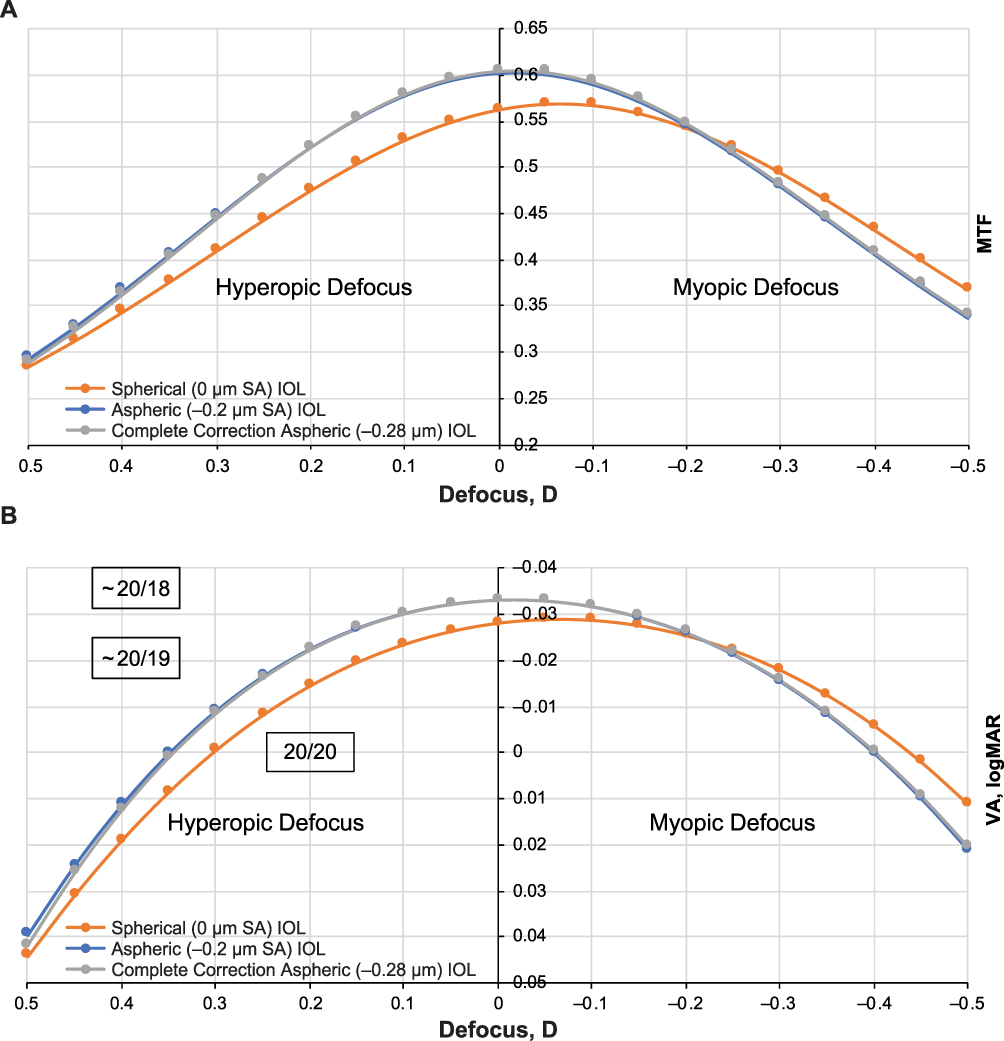 |
Figure 4 Photopic MTF (A) and photopic VA (B) comparison of three IOLs in a model eye with average cornea and 3-mm pupil. Abbreviations: IOL, intraocular lens; MTF, modulation transfer function; VA, visual acuity. |
The mesopic MTF and VA for the 4.5-mm pupil were also calculated for the spherical and the two aspheric IOLs (Figure 5A and B). Mesopic MTF for spherical IOL was 0.317 units at the best focus and 0.292 units at 0.1 D defocus. Mesopic MTF for the aspheric IOLs with −0.2 and −0.28 µm correction was 0.490 and 0.512 units, respectively, at the best focus and 0.463 and 0.490 units at 0.1 D defocus. Mesopic VA for the spherical IOL was 0.029 logMAR and at the best focus and 0.0405 logMAR at 0.1 D. Mesopic VA for the aspheric IOLs with −0.2-µm and −0.28-µm correction was −0.017 and −0.021 logMAR, respectively, at the best focus and −0.012 and −0.017 logMAR at 0.1 D defocus.
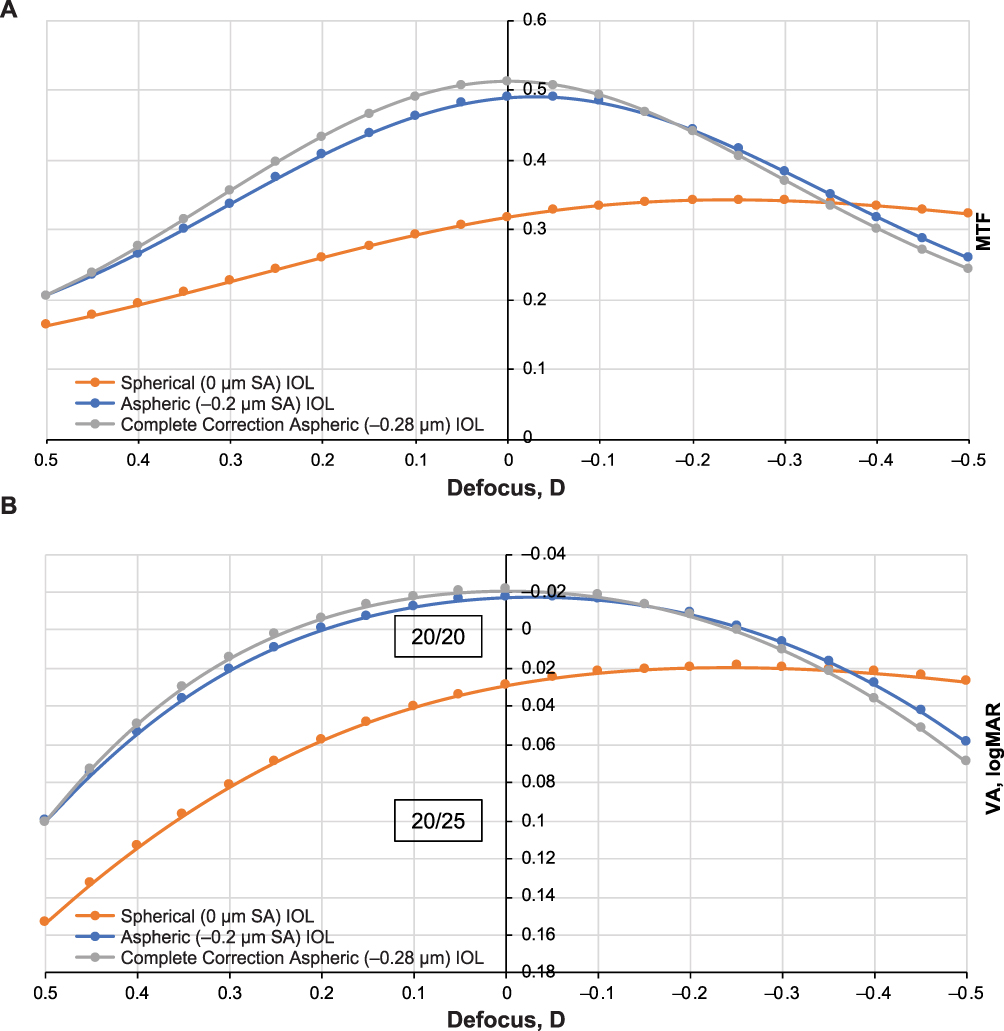 |
Figure 5 Mesopic MTF (A) and mesopic VA (B) comparison of three IOLs in a model eye with average cornea and 4.5-mm pupil. Abbreviations: IOL, intraocular lens; MTF, modulation transfer function; VA, visual acuity. |
The photopic MTF and VA values were obtained using three pupil sizes in the schematic model eye with various amounts of defocus. Photopic VA for a 3-mm pupil ranged from −0.033 to −0.021 logMAR (best focus to 0.25 D defocus; Figure 6). Photopic VA for a 4-mm pupil ranged from −0.025 to −0.010 logMAR, and photopic VA for a 4.5-mm pupil ranged from −0.021 to 0.00 logMAR.
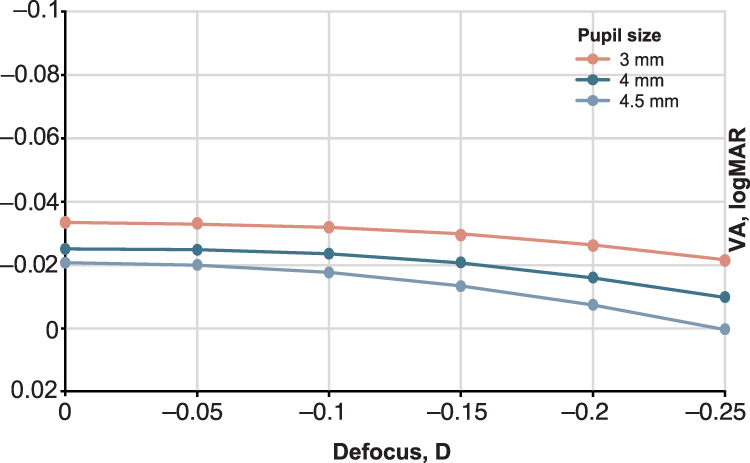 |
Figure 6 Visual acuity comparison at three pupil sizes in a model eye with average cornea. Abbreviations: IOL, intraocular lens; VA, visual acuity. |
Discussion
The US Food and Drug Administration (FDA) recommends collecting race and ethnicity data in studies involving medical devices.26 Based on the definitions provided by the US Office of Management and Budget and adopted by the FDA, race and ethnicity categories describe the sociocultural construct of the society and are not anthropologically or scientifically based.26,27 Race refers to genetically defined physical characteristics, whereas ethnicity describes the individual’s culture, including language and religion. Differences among racial and ethnic groups in clinical responses to medical products and devices may be the result of both intrinsic (ie, genetics, metabolism) and extrinsic (ie, diet, environment) factors.28,29 As defined by the FDA, race categories include American Indian or Alaska Native; Asian (ie, Asian Indian, Chinese, Filipino, Japanese, Korean, Vietnamese, Other Asian); Black or African American (ie, origins in any of the Black racial groups of Africa), Native Hawaiian or Other Pacific Islander (ie, Guamanian, Samoan, or other Pacific Islander), and White (ie, origins in Europe, Middle East, or North Africa). For ethnicity, the FDA suggests the choice of Hispanic or Latino (ie, Cuban, Mexican, Puerto Rican, or other Spanish origin) or Not Hispanic or Latino.26 However, FDA-recommended categories for race and ethnicity were developed in the United States and may not describe racial and ethnic groups in foreign countries with sufficient granularity. In this study, the term “ethnicity” is used to assess asphericity in distinct populations from diverse geographic regions, based on the terminology used in the cited literature (Table 1).
Asphericity, corneal SA, and accuracy of IOL power calculations may be affected by multiple factors, including race or ethnicity, which is noteworthy because optical aberrations can degrade retinal image quality.9 To our knowledge, this study is the first quantitative analysis to assess the effects of differences in asphericity and corneal SA among different ethnicities on IOL power calculation, and it showed no noticeable degradation of MTF or VA for either −0.2 or −0.28 µm SA–corrected IOLs. The calculated A-Constants for CNA0T0 for different ethnicities ranged from 119.029 to 119.151, and the IOL power difference compared with the average cornea was between 0.004 and −0.111 D. This study also revealed that CNA0T0 with a −0.2-µm SA or an IOL with a −0.28-µm SA correction would not affect VA at ±0.5 D of defocus or refractive error. This comparative analysis clarifies that, with a refractive error of 0.25 D, patients can achieve 20/20 vision or emmetropia. Additionally, results of this study suggest that spherical IOLs (with no SA correction) would have a higher tolerance to refractive error at the expense of lower VA.
The asphericity of the cornea affects the aberrations, and this is an area of active research. Human cornea Q values may vary with ethnicity and race, as well as degree of ametropia and age.9,30 Furthermore, ethnicity- and age-dependent variations in corneal SA have also been reported. Based on the clinical studies in the different ethnic groups included in this analysis, average Q values varied between −0.26 and −0.20, and corneal SA varied between 0.17 and 0.31 µm among different ethnic and age groups (Table 1). Additionally, a statistically significant positive correlation between SA and increasing age (P<0.0001) has been reported. Aberrometer-based measurements in 300 eyes suggested that SA increases with aging.15 For patients aged 15 to 35 years, mean ± SD SA was +0.207±0.07 µm. Mean ± SD SA increased to +0.237±0.08 and +0.315±0.02 µm for patients aged 35 to 50 years and 50 to 85 years, respectively.15
Taking into consideration a patient’s corneal SA when selecting a particular IOL may improve visual outcomes,22 highlighting the need to determine corneal SA. For example, the calculated A-Constants for Brazilian and Tanzanian groups were 119.148 and 119.151, respectively. Some surgeons may prefer to use the A-Constant of 119.2 to determine the IOL power because of their preferred surgical technique and practice. The SA value is the normalized Zernike term, as specified in the ANSI Z80.28 standard.31 In this analysis, 0.28-µm SA was used for modeling the average eye for which conic function represented the corneal surface. However, the spherical aberration value calculated by approximating the anterior corneal surface as a simple conic may differ from the SA value obtained from a full Zernike fit to the cornea. Various values have been discussed in the literature for the Zernike SA created by an average cornea. For a 6-mm pupil, which is a standard reference diameter, mean SA ± SD in the general population has been reported to be +0.28±0.1 µm (n=228 eyes) and +0.27±0.1 µm (n=602 eyes) in two separate studies.18,32 The SA value proposed for a revised ISO 11979–2:2014 IOL standard for an aspheric model eye was 0.285 µm for a 6-mm pupil.33 Additional analyses are needed to confirm the model used in the current study.
Limitations of this study included the eye simulation schematics, which were not clinically tested. This study assessed spherical and aspheric monofocal IOLs from a single manufacturer; future work should include other types of IOLs and IOLs from different manufacturers as well as advanced IOL types. Furthermore, factors other than race and ethnicity may influence surgical outcomes, including age-dependent variation, biometry instrumentation error, and individual surgical techniques. Although this needs to be confirmed in future studies, it is expected that the outcomes presented here will be comparable for a variety of aberration-correcting lenses. Additional analyses would be needed to establish whether differences in corneal SA among different ethnicities are statistically significant and if these differences are minimized by variations in corneal higher-order aberrations.
The IOL power calculation is an important aspect of cataract surgery and can help achieve optimal outcomes and patient satisfaction. Calculating the optimal IOL power using the A-Constant can be potentially affected by factors such as asphericity.6 However, formulas and calculations for commercially available aspheric IOLs are typically based on data from studies in average eyes.22 In clinical settings, if there is a substantial variation in corneal SA among different ethnic groups, customizing IOL selection for specific populations may be relevant. Additional studies are needed to further evaluate effects of variations in patient Q values and corneal SA on VA, contrast sensitivity, halos, and glare and patient satisfaction.
Intraocular lens power calculations (including formulas for A-Constant and other lens constants) are mostly based on the 3-mm pupil to represent distance vision for both monofocal and multifocal IOLs. The current experimental setup (ie, 3-mm pupil size) was selected to best reflect this standard. This study, however, was extended to include larger pupils (4 and 4.5 mm) to evaluate the impact of SA on IOL power calculations. Although VA was lower with larger pupils because of the effect of SA, it would not affect the A-Constant or the selection of IOL. The change in VA as a function of defocus followed a similar trend across each pupil diameter (Figure 6). Thus, the reduction of MTF and VA will have a relative impact for each lens type irrespective of the pupil size.
In conclusion, the results of this study based on ethnicity-specific eye models suggest that the use of a different A-Constant for different ethnic populations would not impact visual outcomes. Furthermore, based on this study, we found that the use of different ethnicity-based A-Constants with spherical SA60AT, aspheric CNA0T0 −0.2 µm SA, and aspheric −0.28 µm SA IOL would not impact visual outcomes in selecting IOL power. This finding may be of interest to surgeons working with diverse patient populations internationally, as well as in the United States because a surgeon may choose the next available IOL power for an A-Constant of 119.029 compared with 119.151, based on their practice. Calculations using data from clinical studies and model eyes designed for individual ethnic populations suggest VA of 20/20 or better for all studied ethnicities for a defocus of −0.25 to 0.25 D. Additionally, this study revealed why surgeons may prefer a target refraction of +/−0.25 D or less for optimal patient vision. The outcomes of these findings may be informative for IOL power selection based on a specific A-Constant for achieving optimal visual outcomes in patients of different races and ethnicities undergoing cataract surgery.
Data Sharing Statement
The data used to support the primary findings of this study are available upon reasonable request from the study sponsor, Alcon Research LLC.
Ethics Approval and Informed Consent
Ethical approval was not required for this non-interventional study.
Acknowledgments
Medical writing support was provided by Natalia Zhukovskaya, PhD, of ICON plc (Blue Bell, PA, USA), and was funded by Alcon Research LLC. The authors thank Val P. Injev, PE, MBA, for his assistance in the development of this manuscript.
This analysis was presented, in part, at the 2023 Association for Research in Vision and Ophthalmology Annual Meeting in New Orleans, LA, April 23–27. The abstract was published in Invest. Ophthalmol. Vis. Sci. 2023;64(8):2517; https://iovs.arvojournals.org/article.aspx?articleid=2787715
Author Contributions
All authors made a significant contribution to the work reported, whether that was in the conception, study design, execution, acquisition of data, or analysis and interpretation or in all these areas. All authors took part in drafting, revising or critically reviewing the article; gave final approval of the version to be published; agreed on the journal to which the article has been submitted; and agreed to be accountable for all aspects of the work.
Funding
This study was funded by Alcon Research LLC.
Disclosure
K.K. Das, R. Suryakumar, and W. Lu are employees of Alcon Research LLC. A. Maxwell is a consultant to Alcon and has no financial interest related to this study.
References
1. Retzlaff JA, Sanders DR, Kraff MC. Development of the SRK/T intraocular lens implant power calculation formula. J Cataract Refract Surg. 1990;16(3):333–340. doi:10.1016/S0886-3350(13)80705-5
2. Sheard R. Optimising biometry for best outcomes in cataract surgery. Eye (Lond). 2014;28(2):118–125. doi:10.1038/eye.2013.248
3. Das KK, Suryakumar R, Lu W, Maxwell A. Ethnicity based differences in corneal asphericity has minimal impact on optical quality or visual acuity after cataract surgery. Invest Ophthalmol Vis Sci. 2023;64(8):2517.
4. Dubbelman M, Sicam VA, Van der Heijde GL. The shape of the anterior and posterior surface of the aging human cornea. Vision Res. 2006;46(6–7):993–1001. doi:10.1016/j.visres.2005.09.021
5. Dubbelman M, Weeber HA, van der Heijde RG, Volker-Dieben HJ. Radius and asphericity of the posterior corneal surface determined by corrected Scheimpflug photography. Acta Ophthalmol Scand. 2002;80(4):379–383. doi:10.1034/j.1600-0420.2002.800406.x
6. Savini G, Hoffer KJ, Barboni P, Schiano Lomoriello D, Ducoli P. Corneal asphericity and IOL power calculation in eyes with aspherical IOLs. J Refract Surg. 2017;33(7):476–481. doi:10.3928/1081597X-20170504-05
7. Benes P, Synek S, Petrova S. Corneal shape and eccentricity in population. Coll Antropol. 2013;37(suppl 1):117–120.
8. Lindsay R, Smith G, Atchison D. Descriptors of corneal shape. Optom Vis Sci. 1998;75(2):156–158. doi:10.1097/00006324-199802000-00019
9. Fuller DG, Alperin D. Variations in corneal asphericity (Q value) between African-Americans and whites. Optom Vis Sci. 2013;90(7):667–673. doi:10.1097/OPX.0b013e318296befe
10. Zhang Z, Wang J, Niu W, et al. Corneal asphericity and its related factors in 1052 Chinese subjects. Optom Vis Sci. 2011;88(10):1232–1239. doi:10.1097/OPX.0b013e31822717ca
11. Amorim-de-Sousa A, Vieira AC, González-Méijome JM, Queirós A. Age-related variations in corneal asphericity and long-term changes. Eye Contact Lens. 2019;45(2):99–104. doi:10.1097/ICL.0000000000000540
12. Horner DG, Soni PS, Vyas N, Himebaugh NL. Longitudinal changes in corneal asphericity in myopia. Optom Vis Sci. 2000;77(4):198–203. doi:10.1097/00006324-200004000-00012
13. Read SA, Collins MJ, Carney LG, Franklin RJ. The topography of the central and peripheral cornea. Invest Ophthalmol Vis Sci. 2006;47(4):1404–1415. doi:10.1167/iovs.05-1181
14. Lu N, Lin F, Huang Z, He Q, Han W. Changes of corneal wavefront aberrations in dry eye patients after treatment with artificial lubricant drops. J Ophthalmol. 2016;2016:1342056. doi:10.1155/2016/1342056
15. Al-Sayyari TM, Fawzy SM, Al-Saleh AA. Corneal spherical aberration in Saudi population. Saudi J Ophthalmol. 2014;28(3):207–213. doi:10.1016/j.sjopt.2014.03.003
16. Asano H, Hiraoka T, Seki Y, et al. Distribution of corneal spherical aberration in a Tanzanian population. PLoS One. 2019;14(9):e0222297. doi:10.1371/journal.pone.0222297
17. Lim KL, Fam HB. Ethnic differences in higher-order aberrations: spherical aberration in the South East Asian Chinese eye. J Cataract Refract Surg. 2009;35(12):2144–2148. doi:10.1016/j.jcrs.2009.06.031
18. Wang L, Dai E, Koch DD, Nathoo A. Optical aberrations of the human anterior cornea. J Cataract Refract Surg. 2003;29(8):1514–1521. doi:10.1016/S0886-3350(03)00467-X
19. Lai YJ, Yeh SI, Cheng HC. Distribution of corneal and ocular spherical aberrations in eyes with cataract in the Taiwanese population. Taiwan J Ophthalmol. 2015;5(2):72–75. doi:10.1016/j.tjo.2015.03.003
20. Nakano EM, Bains H, Nakano K, et al. Wavefront analysis in Asian-Brazilians. J Refract Surg. 2006;22(9 suppl):S1024–1026. doi:10.3928/1081-597X-20061102-03
21. Elkitkat RS, Fouad YA, Shams A, Hamza I. Normative values of corneal spherical aberration, pupil size, and other key refractive and topographic parameters in a large cohort of Egyptian cataract surgery candidates. Clin Ophthalmol. 2020;14:4571–4577. doi:10.2147/OPTH.S288738
22. Paryani MJ, Kharbanda V, Kummelil MK, Wadia K, Darak AB. Pupillodynamics and corneal spherical aberrations in a set of Indian cataract patients and its implications for aberrometric customisation of intraocular lenses. Indian J Ophthalmol. 2020;68(12):3012–3015. doi:10.4103/ijo.IJO_218_20
23. Shimozono M, Uemura A, Hirami Y, Ishida K, Kurimoto Y. Corneal spherical aberration of eyes with cataract in a Japanese population. J Refract Surg. 2010;26(6):457–459. doi:10.3928/1081597X-20100212-03
24. Vega F, Millán MS, Garzón N, et al. Visual acuity of pseudophakic patients predicted from in-vitro measurements of intraocular lenses with different design. Biomed Opt Express. 2018;9(10):4893–4906. doi:10.1364/BOE.9.004893
25. Alarcon A, Canovas C, Rosen R, et al. Preclinical metrics to predict through-focus visual acuity for pseudophakic patients. Biomed Opt Express. 2016;7(5):1877–1888. doi:10.1364/BOE.7.001877
26. US Food and Drug Administration. Collection of race and ethnicity data in clinical trials: guidance for industry and Food and Drug Administration staff. Available from: https://www.fda.gov/regulatory-information/search-fda-guidance-documents/collection-race-and-ethnicity-data-clinical-trials.
27. Office of Management and Budget. Revisions to the standards for the classification of federal data on race and ethnicity. Available from: https://obamawhitehouse.archives.gov/omb/fedreg_1997standards.
28. Burroughs VJ, Maxey RW, Levy RA. Racial and ethnic differences in response to medicines: towards individualized pharmaceutical treatment. J Natl Med Assoc. 2002;94(10 suppl):1–26.
29. Huang SM, Temple R. Is this the drug or dose for you? Impact and consideration of ethnic factors in global drug development, regulatory review, and clinical practice. Clin Pharmacol Ther. 2008;84(3):287–294. doi:10.1038/clpt.2008.144
30. Gonzalez-Meijome JM, Villa-Collar C, Montes-Mico R, Gomes A. Asphericity of the anterior human cornea with different corneal diameters. J Cataract Refract Surg. 2007;33(3):465–473. doi:10.1016/j.jcrs.2006.11.004
31. American national standards for ophthalmics - ANSI Z80.28-2004. American National Standards Institute, Inc.: 2004.
32. Beiko GH, Haigis W, Steinmueller A. Distribution of corneal spherical aberration in a comprehensive ophthalmology practice and whether keratometry can predict aberration values. J Cataract Refract Surg. 2007;33(5):848–858. doi:10.1016/j.jcrs.2007.01.035
33. Ophthalmic implants — intraocular lenses — part 2: optical properties and test methods (ISO 11979-2:2014). International Organization for Standardization; 2014.
 © 2025 The Author(s). This work is published and licensed by Dove Medical Press Limited. The
full terms of this license are available at https://www.dovepress.com/terms
and incorporate the Creative Commons Attribution
- Non Commercial (unported, 4.0) License.
By accessing the work you hereby accept the Terms. Non-commercial uses of the work are permitted
without any further permission from Dove Medical Press Limited, provided the work is properly
attributed. For permission for commercial use of this work, please see paragraphs 4.2 and 5 of our Terms.
© 2025 The Author(s). This work is published and licensed by Dove Medical Press Limited. The
full terms of this license are available at https://www.dovepress.com/terms
and incorporate the Creative Commons Attribution
- Non Commercial (unported, 4.0) License.
By accessing the work you hereby accept the Terms. Non-commercial uses of the work are permitted
without any further permission from Dove Medical Press Limited, provided the work is properly
attributed. For permission for commercial use of this work, please see paragraphs 4.2 and 5 of our Terms.