Back to Journals » Journal of Asthma and Allergy » Volume 12
Essential oils, asthma, thunderstorms, and plant gases: a prospective study of respiratory response to ambient biogenic volatile organic compounds (BVOCs)
Authors Gibbs JEM ![]()
Received 11 November 2018
Accepted for publication 25 March 2019
Published 21 June 2019 Volume 2019:12 Pages 169—182
DOI https://doi.org/10.2147/JAA.S193211
Checked for plagiarism Yes
Review by Single anonymous peer review
Peer reviewer comments 3
Editor who approved publication: Dr Amrita Dosanjh
Jane EM Gibbs
School of Medicine, Griffith University, Gold Coast, Queensland, Australia
Purpose: Prevailing opinion is that wind-pollinated plants affect asthma negatively and that insect- pollinated ones do not. “Thunderstorm” asthma, too, is attributed to bursting grass pollens. Additional biogenic volatile organic compounds (BVOCs) are identified here. Essential oils’ BVOCs are inhaled from plants, oil diffusers, candles, room “fresheners”, perfumes, and hygiene products. Claims of BVOC “safety” for sensitive respiratory systems are questioned.
Methods: Fourteen volunteers, of mixed-age and gender, with seasonal asthma recorded peak expiratory flow (PEF) and 11 symptom scores. BVOCs were collected on Tenax tubes from ambient air in autumn and spring, as were live flower emissions, before and after a thunderstorm. Gas chromatography–mass spectrometry analysis identified frequently occurring BVOCs. Air spora, meteorological, outdoor air pollution variables, and BVOCs predict respiratory symptoms in univariate linear regression models, seasonally.
Results: Increased pinene, camphor, linalool, linalyl acetate, benzaldehyde, and benzoic acid predict respiratory symptoms, including reduced PEF, and increased nasal congestion; day length, atmospheric pressure and temperature predict symptoms in both seasons, differently; other variables predict a range of symptoms (0.0001≤p≤ 0.05). Thunder predicts different BVOC emissions in spring, compared to autumn (p≤ 0.05). An uncut Grevillea flower emitted linalool and hexenal before a storm; the latter is also emitted from cut grass. Increased nitrogen oxides and pinene in autumn may combine to form harmful oxidation products.
Conclusion: This research supports BVOCs as contributors to seasonal asthma and allergic rhinitis, and “thunderstorm” asthma. Pinene emissions from Myrtaceae species (Eucalyptus, Melaleuca, Leptospermum, Callistemon), Brassicaceae (canola), and conifers, worldwide, may induce respiratory inflammation and maintain it, by inhibiting eosinophilic apoptosis. Widely used essential oil products containing BVOCs, like linalool, are associated here with respiratory symptoms. Lagged responses suggest that users’ cognitive associations between exposure and response are unlikely, increasing potential for impaired health for vulnerable children.
Keywords: asthma, allergic rhinitis, BVOC, terpenes, Eucalyptus, essential oils
Corrigendum for this paper has been published
Introduction
Essential oils, consisting of terpenes,1 and fragrant components are emitted from aerial parts of plants to communicate with pollinators and predators.2 They are widely used in hygiene and lifestyle products3–5 like essential oil diffusers, candles, room “fresheners”, cleansers, perfumes, soaps, shower gels, and deodorants and may be a source of sensitivity6 and asthma.7 Asthma affects more than 334 million people worldwide, and its prevalence in the United Kingdom, Australia, New Zealand, Canada, and the United States of America (USA) is notable,8 but adequate explanations of world patterns remain elusive. Australian causes of asthma have been unclear too, despite a prevalence of 10.8%, one in nine, over 2.5 million people;9 one in five Australians experiences allergic rhinitis, nearly 4.5 million people.10 This research investigates respiratory effects of biogenic volatile organic compounds (BVOCs) from Australasian plants, shared by canola, conifers, and other plants, globally.
In late spring 2016, within 30 hrs of a thunderstorm in Melbourne, Australia, there were 3365 (672%) excess respiratory-related presentations to emergency departments, and 476 (992%) excess asthma-related admissions to hospital, and 10 people died.11 This was attributed to the accepted explanation, that is, inhalation of burst pollen grains that release cytoplasmic granules.12 Likely additional contributors, BVOCs, are identified here, and results from floral BVOC emissions before and after a thunderstorm are presented.
Asthma prevalence varies, and Queensland’s rate is higher than other states at 11.8%.13 A high level of asthma morbidity has been noted over several decades in South-East Queensland (SEQ) especially in autumn14 and slightly less in spring.15 While thunderstorms and their effect upon pollens and fungi explain some spring and summer asthma in SEQ, they are scarce in the cooler and drier autumn peak of asthma symptoms. This is when vast numbers of Myrtaceae family member Melaleuca quinquenervia (M. quinquenervia) flower; it is often called “bottlebrush” (Figure 1). Large tracts of M. quinquenervia, introduced from Australia, have naturalized in Florida, USA. Considered a pest, it thrives,16 and has been controversial regarding its possible source of irritancy and respiratory disease.17
 |
Figure 1 Melaleuca quinquenervia. |
The focus in Australia,18–20 and elsewhere,21 regarding plant-associated asthma, has been anemophilous pollen (wind disseminated), especially grasses and weed pollens. Oil-bearing plants, especially from the Myrtaceae family, containing terpenoids and aromatic compounds blanket the Australasian landscape and have entomophilous (insect-pollinated) pollens that are oily, sticky, and clump together, reducing numbers in pollen traps.
Myrtaceae family species are championed as safe garden plants for those with allergies and asthma,22,23 but evidence is lacking. Contrary evidence involves children in SEQ with asthma, who were compared to those without symptoms, in responses to skin-prick tests with 15 allergens.24 Response to Eucalyptus pollen (“gum” tree) was 31 times greater for children with asthma, a difference greater than any other allergen.
Plant emissions
Emission of volatile compounds depends upon the rate of biosynthesis, rate of release,25 growth stage,26 daily emission cycles,27 temperature,28 light intensity,28 and vapor pressure29 within plant tissues. Emission changes may be relevant in “thunderstorm” asthma, when atmospheric pressure reduces, and may increase floral emissions.30
Previous time-series research regarding gaseous emissions from plants is scarce. Influential work concerns canola, Brassica napus. This cultivar of rapeseed or oilseed rape (OSR) is grown extensively in Australia, Canada, Scotland, the USA, and many other countries and may contribute to asthma there. Emissions of sabinene, alpha-pinene, limonene, delta-3-carene, benzaldehyde, and linalool vary over a growing season.31 Familiar conifers like pine, spruce, birch, juniper, and cypress, that forest the temperate and cooler parts of the world, also produce these terpenes,32 as do many other plants.33 Also found in the oils of the Australian Myrtaceae family plants, they vary in bioactivity33 and are related to inflammatory response.1
Sensitizing processes
Linalool and linalyl acetate, found in fragrance products, are common sensitizers34–36 and are components of Myrtaceae leaf oil that oxidize readily. Oxidation makes a terpene more sensitizing,1,37 for example, limonene,38 that is used in household cleansers for its lemon scent.39 Aliphatic aldehydes (eg hexenal, from cut grass, and citral, the lemon scent in lemongrass) and the aromatic aldehydes (eg benzaldehyde) are common in nature;33 they feature in domestic products and are variously sensitizing.40 Camphor, a well-known bicyclic ketone found in plants, is used domestically and industrially and is very toxic.41 Polya33 identifies thousands of biochemical targets of bioactive terpenes in essential oils and many autoxidize.34
Objective
The objective here is exploration of the contribution of plant emissions to symptoms associated with asthma and allergic rhinitis in participants from a coastal location with consistently high levels of seasonal asthma. Air spora, air pollutants, and meteorological variables are measured as well as floral response to a thunderstorm.
Prospective studies investigating the effects of ambient plant-related BVOC’s, upon human respiratory processes, are not evident in the literature. This research enhances understanding of respiratory effects of plant gases and domestic usage of essential oil products and urban landscaping choices; it supports the premise that some plant gases contribute to respiratory symptoms.
Methods
Location
Rothwell, part of Redcliffe City, population 55,000, is an outer northern suburb of the Queensland state capital, Brisbane; it is 960 km north of Sydney, Australia. At sea level and coast, it features street plantings of bottle brushes and is adjacent to the Melaleuca wetlands and natural Eucalyptus woodland. The M. quinquenervia flowers from late summer through autumn, and more Eucalyptus species flower in autumn, winter, and spring, than summer (Figure 2).
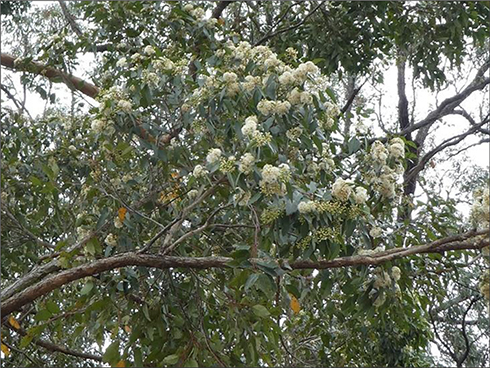 |
Figure 2 Eucalyptus flowers. |
Sampling site
Equipment was sited at Rothwell in a typical suburban backyard of a privately owned home on a 1000 m2 block of land. The air sampling pump was inside a covered shed with a Tygon tube extending outside, open to the air, and under the roofline, at adult head height. A pool was within 5 m, with foliage plants and lawn, not flowering during the sampling. Adjacent houses were similar. Typical verge plantings were Callistemon viminalis, “bottlebrushes“. Figure 3 shows this Myrtaceae species that is commonly planted in public spaces and private gardens.
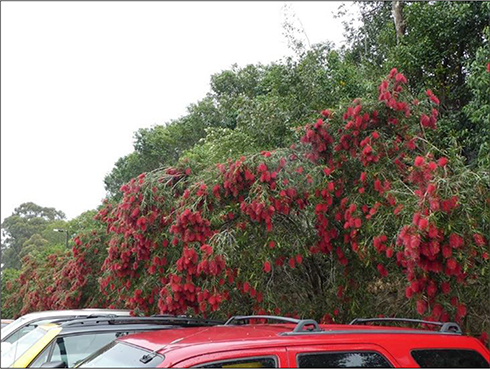 |
Figure 3 Callistemon viminalis (bottlebrush) in a railway carpark. |
Sampling periods
Samples from 1 October until 15 December 2000 (spring) and from 1 April until 30 May 2001 (autumn) were collected three times per week. This new separate-season analysis was prompted by the 2016 thunderstorm asthma event that was discussed in the Introduction. Previous analysis of the combined season dataset was inconclusive and not offered for publication.
Participants
Participants with doctor-diagnosed seasonal asthma, during the previous 12 months, were recruited via schools and newspapers. Participants numbered 20, 8 males and 12 females with and age range of 12–59 years: mean, 28 years; mode,14 years; and median, 18 years. Unpaid, they were of mixed ages and gender, all who volunteered were accepted. Spirometry was included in their assessment by a respiratory specialist, along with an ISAAC Questionnaire.
Regular medication usage was variable: some used both a preventer and a reliever, some a reliever only, and some neither. No adjustments were made for this variation, but preventer and reliever usage are two of the 12 dependent variables measured.
Participants reported using either salbutamol or salmeterol as their reliever medication (salbutamol was prescribed more frequently); fluticasone propionate or budesonide was prescribed with similar frequency for participants using preventer medication.
Non-smoking participants lived and worked in premises without air-conditioning, within a 20 km radius of Rothwell.
Respiratory diary measures
Self-report respiratory measures were recorded on a form sent monthly. After training, peak expiratory flow (PEF) was measured on new peak-flow meters, supplied. Upon waking, the best of three blows was recorded as the PEF, along with the ratings of the previous day’s symptoms.
The “asthma score” was a 10-point ranked item:
How is your asthma today?
Write a number between 1 and 10 with ‘1’ meaning ‘very good’ and ‘10’ meaning ‘terrible’.
The remaining nine items were 4-point ranks starting from ‘0’ and extending to ‘3’. Participants were asked separately:
Since your last peak flow have you been: coughing/wheezing/sneezing?
Since your last peak flow have you had: difficulty breathing/an itchy nose/had itchy eyes/a runny nose/a blocked (congested) nose?
They were required to write “0,” “1”, “2”, or “3” corresponding to “none”, “a little”, “a lot”, and “most of the time” on the relevant date, marked in a table format.
Reliever and preventer usage were reported separately on three-point items:
Have you increased or decreased your asthma reliever/preventer medication?
Put ‘I’ for ‘increased’; ‘D’ for ‘decreased’ and ‘S’ for ‘stayed the same’.
When not using medication, they recorded “S”, recommencing, they recorded “I” and ceasing they recorded “D”. These were converted to −1, 0, and 1 for statistical analysis.
Dependent variables
Standardized (z) peak expiratory flow (SPEF), and symptom score group means were the dependent variables. Measures were: SPEF, asthma score, wheeze, cough, difficulty breathing (dyspnea), reliever usage, preventer usage, itchy eyes, itchy nose, runny nose (rhinorrhea), sneezing, and blocked nose (congested nose).
Independent variables
Air spora, compounds from air samples, pollutants, and meteorological variables served as independent variables. They were day length, mean atmospheric pressure, mean temperature, precipitation, mean wind speed, relative humidity at 9 am, particulates <10 microns (PM10), heard thunder, ozone (O3), nitrogen monoxide (NO), nitrogen dioxide (NO2), Myrtaceae pollen, Poaceae pollen, Pinus pollen, Asteraceae pollen, Casuarina pollen, Acacia pollen, “other” pollen, Cladosporium, Alternaria, “other” fungi, benzoic acid, benzaldehyde, alpha pinene, beta pinene, 1,8 cineole, camphor, limonene, linalyl acetate, and linalool.
Floral and air and thunderstorm sampling
Independent variables of benzoic acid, benzaldehyde, alpha pinene, beta pinene, 1,8 cineole, camphor, limonene, linalyl acetate, and linalool were determined as ambient gases through floral and air analysis. Details of flower and air sampling and gas chromatography–mass spectrometry (GCMS) method and analysis, including chromatograms of the thunderstorm sample, and a typical air sample, are detailed in the supplementary information.
Statistical procedures
Statistical analyses were performed with SPSS Version 22. Procedures used were one-way ANOVA, principal components analysis, and general linear regression (GLM). Alpha was set at 0.05. Data was tested for homogeneity and normality and transformed where necessary. Univariate GLM analyses of group mean symptom scores and environmental measures on the same day, and up to 5 days of lag, predicted respiratory symptom responses. Univariate models maximize statistical power in a context of limited air sample data points. Relationships between heard thunder and volatile emissions were also investigated.
Transformations of air sample data
Air sample measures were transformed from the original categorically quantitative ratings assigned during analysis. The range from “nil” through to “very, very high” represents 10 categories which were converted to a 10-point scale, that was log10 transformed to approximate the quantitative increases of compounds in ambient air.
Results
Floral emissions before and after a storm
The supplementary information shows emissions from Grevillea “Robyn Gordon” captured before and after a storm. Included GCMS chromatograms demonstrate substantially increased linalool, hexenal, and hexanoic acid emissions before the storm, compared to after the storm, and relative quantities are listed.
Asthma and allergic rhinitis symptom summaries
Completion rate was 74% for completion of SPEF readings and symptom scores. Participants were asked to omit forgotten entries, rather than guess. Returns for spring were 20 October, 17 November, 11 December; average, 16. For autumn, 14 April, 14 May; average, 14.
For clarity, “at a glance” results charts, using symbols, have been created. Meaningful statistically significant (p≤0.05), relationships between individual symptoms and predictor variables from univariate linear regression models have been displayed in two charts, asthma symptoms, autumn and spring (Figure 4); and allergic rhinitis symptoms, autumn and spring (Figure 5). The external file 'Regression models.xlsx' contains univariate model information, including variance, for statistically significant relationships (p≤0.05) between individual predictors and 12 symptom measures, in spring and autumn, separately (Table S1).
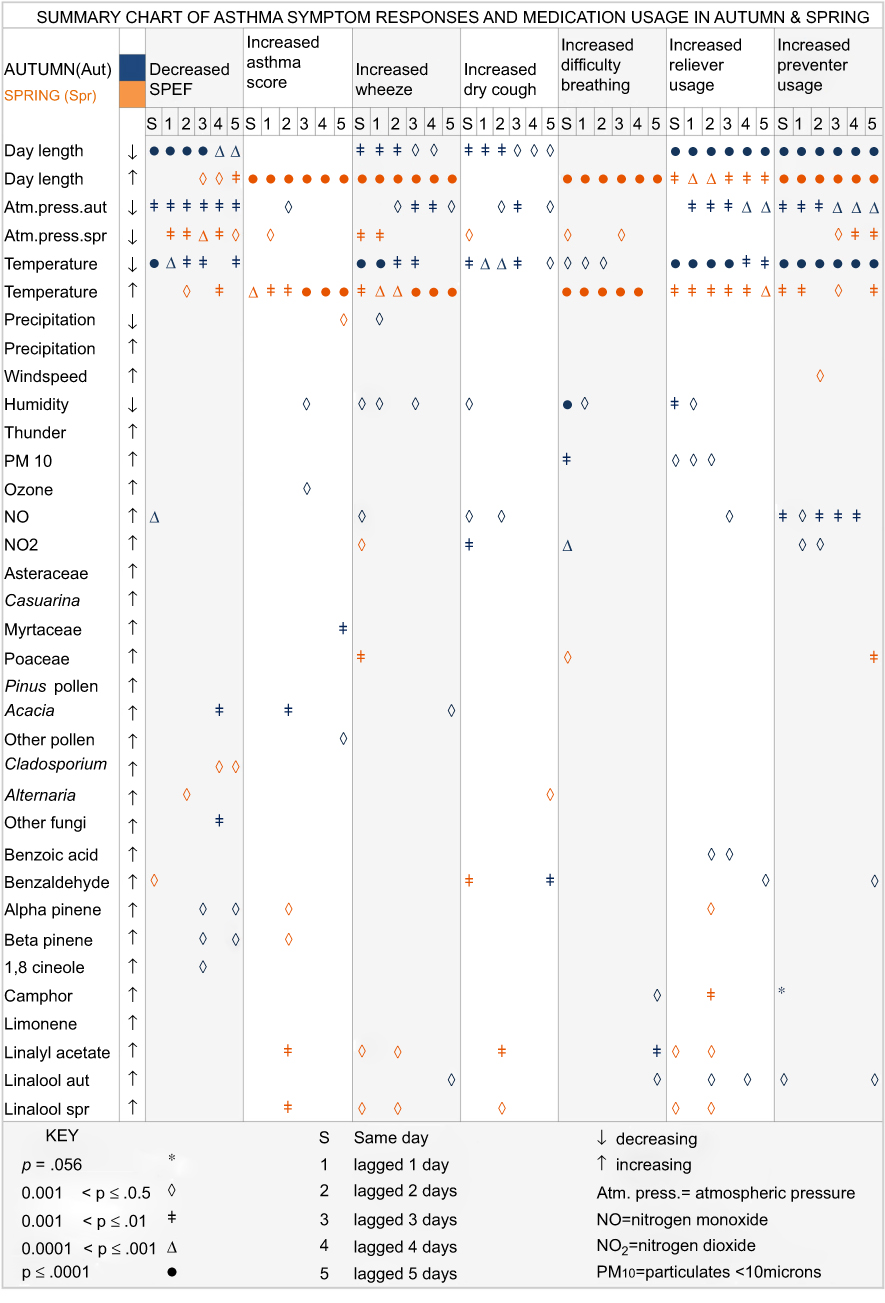 |
Figure 4 Asthma symptoms, autumn and spring. |
 |
Figure 5 Allergic rhinitis symptoms, autumn and spring. |
Asthma symptoms
In autumn (Figure 4), decreased SPEF is predicted, at various lags, by decreasing day length, temperature (0.0001≤ p≤0.001), and atmospheric pressure (0.001≤ p≤0.01); increasing nitrogen monoxide (0.0001≤ p≤0.001), Acacia (wattle) pollen and “other” fungi (0.001≤ p≤0.01), alpha and beta pinene (lags 3,5), and 1,8 cineole (lag 3) (p≤0.05).
In spring (Figure 4), decreased SPEF is predicted by decreasing atmospheric pressure (0.0001≤ p≤0.05); increasing day length and temperature (0.001≤ p≤0.05), Cladosporium, Alternaria, and benzaldehyde (p≤0.05).
These results support BVOC emissions as mediating variables in explaining the relationships of decreasing atmospheric pressure, thunder, and increased symptoms. Heard thunder predicts different same day emissions in autumn (alpha and beta pinene adjusted R2=0.18, p=0.03, df 1/21, F=5.8) compared to spring (linalyl acetate adjusted R2=0.14, p=0.04, df 1/21, F=4.6).
Terpene emissions before thunder, before rain (precipitation), and in fine weather, are shown in Figure 6. Lower air pressure is associated with rain and storms, and higher pressure with clear skies and sunny conditions.42 Relationships between atmospheric pressure and terpene emission are statistically neutralized by occurrence in both fine and stormy weather; so, thunder can predict BVOC emissions, but emissions cannot predict thunder, as they occur in fine weather too.
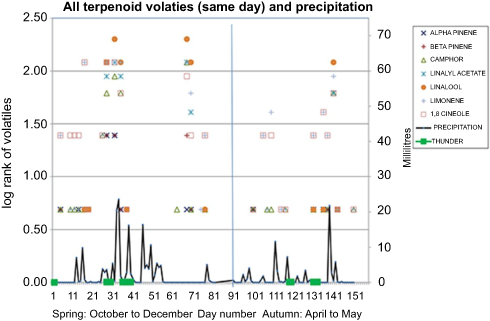 |
Figure 6 Terpene emissions before thunder, before rain, and in fine weather. |
In autumn, increases in other asthma symptoms (Figure 4) are predicted, at various lags, by decreased day length, temperature, and atmospheric pressure (0.0001≤ p≤0.05); increased NOx, PM10, pollens (Myrtaceae, Acacia and “other”) (0.0001≤p≤0.05); “other” fungi and decreased humidity feature in fewer symptoms (0.0001≤p≤0.01). Increased camphor, linalyl acetate, and especially linalool, feature (0.01≤ p≤0.05), as do the aromatic compounds benzaldehyde and benzoic acid (0.001≤ p≤0.05).
For spring, increases in other asthma symptoms (Figure 4) are strongly and consistently predicted, at various lags, by decreasing atmospheric pressure and increasing temperature and day length (0.0001≤ p≤0.05); and, increased Poaceae pollen predicts increased wheeze, difficulty breathing, and increased preventer use (0.001≤ p≤0.05). Increased alpha and beta pinene, camphor, linalyl acetate, and linalool predict increased asthma score, wheeze, dry cough, and reliever usage; increased benzaldehyde predicts dry cough (0.001≤p≤0.05).
Asthma symptom predictors, common to autumn and spring
Decreasing atmospheric pressure is the only predictor (p≤0.05) of decreased SPEF for both autumn and spring. Asthma symptom predictors, common to autumn and spring (Figure 4), excluding SPEF, are decreasing atmospheric pressure, increasing NO2, benzaldehyde, camphor, and linalyl acetate (variously, 0.001≤ p≤0.05). Note that some of the strongest effects for BVOCs, and asthma symptoms occur at lag 2 days and lag 5 days, suggesting an important delayed response (Figure 4).
Allergic rhinitis symptoms
Autumn allergic rhinitis symptom measures (Figure 5) show that increased day length and Myrtaceae pollen predicts sneezing (0.0001≤ p≤0.05). Increasing wind speed and various pollens predict sneezing and “blocked” (congested) nose symptoms (0.0001≤p≤0.05). Increased atmospheric pressure, as occurs on a fine day, is predictive only of sneezing (0.001≤p≤0.05). Decreased humidity predicts sneezing, runny nose, and “blocked” nose (0.001≤p≤0.05); increased humidity predicts itchy eyes only (p≤0.05).
In spring (Figure 5), increased temperature predicts AR symptoms and itchy and runny nose (0.0001≤p≤0.05). Increased Poaceae pollen, increased NO2, and reduced precipitation, predict increases in AR symptoms (0.001≤p≤0.05). Increased day length only predicts itchy eyes (p≤0.05), and increased humidity predicts sneezing and runny nose(0.001≤p≤0.05). Increased “other fungi” predicts sneezing (p≤0.05). Increased benzoic acid is predictive of itchy eyes, itchy nose, runny nose, and sneezing in spring (p≤0.05). Congested (“blocked”) nose in spring was predicted by seven terpenes after a two-day lag: alpha and beta pinene, 1,8 cineole, camphor, limonene, linalyl acetate, and linalool (p≤0.05).
Examining sampling bias
Are sample days different from days not sampled?
To investigate possible sampling bias, sets of alternate sample days were compared for SPEF readings to ensure that air sampling days, that occurred three times per week, were not different from days unsampled; one-way ANOVA was used. All possible days were divided into three sets: Set A (day 1, day 4, day 7, etc.); Set B (day 2, day 5, day 8); Set C (day 3, day 6, day 9, etc.). There was homogeneity of variances, as assessed by a one-way ANOVA (SPSS 22) (p=0.11), so sampling days were similar to days unsampled.
What is the daily sampling variance compared to every-third-day variance?
Table 1 compares Lag-3-day variances (because they predict SPEF reduction), comparing how each independent variable affects SPEF in a daily measure condition, compared to every-third-day measures. Variance for “temperature”, “day length”, “precipitation”, and Cladosporium increases in the “air sample days” condition compared to “all days”; it remains unchanged for “Poaceae”; and, “other pollen”, “Alternaria”, “ozone”, and “wind speed” are reduced.
 |
Table 1 Variance comparison of daily versus three-per-week air samples |
Discussion
Increases of BVOCs from Australian trees predict respiratory symptom increases here. Figure 7 shows BVOCs plotted against same-day SPEF. Increases in the bicyclic monoterpenes, alpha and beta pinene, and the ketone, camphor, predict asthma symptoms, as does the acyclic alcohol, linalool, and its related ester, linalyl acetate. These compounds are similarly found in emissions from OSR crops (canola) ,31 and conifers,43 and many other plants, and are additional to predictors investigated by others previously.14,18–20,44 Nasal congestion reported in response to seven terpenes in spring may be related to rhinosinusitis.45
 |
Figure 7 Terpene BVOCs (same-day) and SPEF.Abbreviation: BVOCs, biogenic volatile organic compounds. |
Increases in the aromatic compounds, benzaldehyde and benzoic acid (Figure 8) also predict a range of symptoms here. Benzaldehyde is a sweet aldehyde that attracts pollinators and is a sensitizer;40 benzoic acid has been associated with various contact sensitivities.46 Safety for these has not been established where inhalation is an exposure route.47,48 These compounds are used widely in food and cosmetics;48 many are commonly found in sensitizing fragrance and personal hygiene products.49
 |
Figure 8 Aromatic volatiles (same-day) and SPEF. |
Floral emissions consist of complex blends, but little is known about synergistic effects; however, Juergens reports that any positive effects of 1,8 cineole for respiratory health50,51 would likely be countered by the presence of pinene, trapped here, to which Juergens attributes adverse reactions to Eucalyptus oil.52
Respiratory response to pinenes has been studied for decades,53–55 often in the context of lumber mill workers. Camphor and pinene may also have a role as apoptosis blockers. Eosinophilic inflammation of the airways is a key characteristic of asthma and eosinophils accumulate in part because of their prolonged survival.56 Apoptosis, or programmed cell death, is important in the removal of eosinophils from the lungs.57 Impaired apoptosis has also been implicated in increased rhinovirus replication,58 thus contributing to prolonged periods of illness for people with asthma. Terpene emissions may influence apoptosis.
This study showed that pinene and camphor predict reduced SPEF (Figure 9) and increased medication usage, respectively. It is known that (+)-alpha-pinene is structurally related to (+)-camphor.32 Pro-apoptotic applications of terpenes abound in the literature, but there are some apoptosis blockers—they involve these same terpenes. Nakano found that camphor inhibited apoptosis in human oral tumor cells when other ketones induced it.59 Na et al60 examined the effect of juniper oil on apoptosis in human brain astrocytes. Heat shock–induced apoptosis of these cells was blocked by pretreatment with juniper oil. Juniper oil typically consists largely of pinene.61
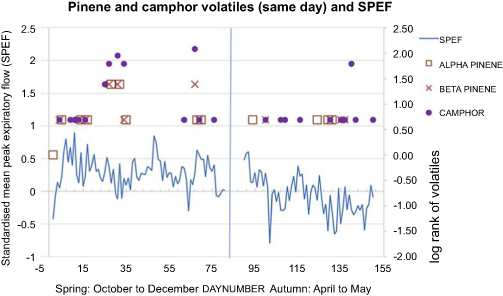 |
Figure 9 Pinene and camphor volatiles (same-day) and SPEF. |
Increased VOC emission may be influential in “thunderstorm asthma”. Sweet floral compounds have long been associated with allergic responses.62,63 Heard thunder predicted the release of some terpenes in autumn and spring. This could be due to the reduction in atmospheric pressure, as occurs with storms, resulting in the effusion of volatiles at that time, as with aquifers’ levels and tidal flows.64,65 Thunder is associated with storms in which air pressure plummets. For plants, stages of growth are influential as in cattle gorging on toxic larkspur flowers before a storm.30 Sweet honey–fragranced linalool is a ubiquitous terpene emitted from flowers and was captured in a markedly increased amount in this study from a Grevillea during a storm event; spring thunder predicts the occurrence of the related sweet ester, linalyl acetate, in air samples. Hexenal, a aldehyde sensitizer, is emitted when grass is cut,66 and also by the Grevillea flower sampled here before the storm. Asthma and lawn mowing has been associated for decades,67 but the association of BVOCs with both is new.
Heard thunder did not predict respiratory symptoms. Why? From days 55 to 75, there is no rain and yet SPEF drops markedly, and emissions are substantial (Figure 6). Fine weather neutralizes any statistical relationship for thunder and respiratory response, so “thunder heard” did not predict any symptoms. This work reveals a strong relationship between increasing severity of respiratory symptoms and atmospheric (barometric) pressure. The great majority of significant relationships (p≤0.05), 43 of them, involve reducing pressure and only two increasing pressure. Thus, increased respiratory symptoms, and increased BVOCs, can occur on both fine days, with no rain, and on rainy and/or stormy days.
Asthma occurs in environments with varied temperatures but the highest prevalence is in the temperate zones of world.68 Others44,69 report asthma increasing both in cooler and in warmer conditions too. This paradox can be explained by optimal flowering of plants that may be related to respiratory response. Floral terpene emission is related to light and temperature,70 interactively,71 though the influence may only be an indirect one: developmental staging (ontogeny)─new growth, flowering, senescence─strongly governs emissions.31,72,73 Maximum floral terpene emissions occur at the optimal temperature for flowering.74 For winter flowers that temperature will be lower than for spring or summer flowers. Emissions will occur at increasing and decreasing temperatures because of species’ flowering needs.
Increasing and decreasing temperature significantly (p≤0.05) predicts respiratory symptoms in this study. M. quinquenervia flowering occurs at decreasing temperature and increasing respiratory symptoms in autumn; Eucalyptus, Melaleuca leucadendra, and Callistemon viminalis flowering occurs at increasing temperature and respiratory symptoms, in spring, along with other Myrtaceae and many other plants.
Limitations
Subsequent studies will benefit from increased participants. Increasing air sampling from three to seven days per week would enhance analysis by providing more data points, thereby increasing statistical power and enabling multivariate analysis. This is related to funding, access, equipment security, and distance issues.
Terpenes occur in vast numbers and combinations; identifying them in ambient air is a complex procedure. Here, volatiles from ambient air were reported using quantitative approximations and only the most frequently occurring were used in analyses. It is possible that the most influential were not identified because they were not frequently occurring, nor in larger quantities. This can be rectified by increased funding and increased analysis of BVOCs. Employing chemical standards daily would enhance precision in quantification of the volatiles measured. This specialized addition would require a considerable input of expertise and funding. Laboratories equipped for this are rare, requiring well-stocked chemical libraries.
Using 10-point scales in all the self-report symptom and medication usage scales would increase the sensitivity of the statistical analysis. To extend to a year-long project, with seasonal analysis, would enhance understanding of volatile patterns and respiratory relationships. The growing body of work regarding SOA’s that result from oxidation of volatiles trapped in this project shows that this issue is complex and may take some time to clarify and evolve.
Conclusions
Here, a range of respiratory symptoms are predicted by BVOCs trapped in ambient air. Univariate regression models demonstrate strong relationships with natural drivers of floral processes and BVOC production: day length and temperature.
When anthropogenic pollutants combine with BVOCs, the potential for the generation of toxic compounds is increased. Nitrogen oxides confound the SPEF analysis results in autumn, when pinene is featured, due to the annual seasonal increase of NOx in cooler months. Determining relative contributions of these components is beyond the scope here due to the limitation in the number of air samples and statistical convention. The formation of secondary organic aerosols from combinations of NOx and pinenes,75 trapped here, highlights the importance of this co-occurrence.
Researchers have noted allergic responses with domestic usage of the fragrance products like lavender oil,34 which contains linalool and linalyl acetate; emission of these was predicted by heard thunder in this study. These emissions were predictive of increased asthma symptoms and medication usage in both autumn and spring here. Tea tree oil (from Melaleuca alternifolia) autoxidizes to form allergens too76 and is widely used domestically. Eucalyptus oil is not safe for those with respiratory sensitivities and pinene, detected here, is the attributed reason,52due to its tendency to form harmful peroxides and increased pro-inflammatory mediators.
Continuous monitoring of plant emissions can be achieved77 to reveal seasonal patterns and enable protection for the vulnerable. BVOCs vary with the vegetation, and its developmental stage: emissions from a desert78 will differ from a Eucalyptus forest,77 or a rose garden.79 Results here are specific to this locality and will differ from another. Future research needs to accommodate these variations of geography, season and weather.
Anecdotally, Australian plants, and others are associated with respiratory symptoms; this work supports that. Informed practice and botanical diversification are needed, especially in and around child care centers, schools, and aged care facilities that are occupied by those most vulnerable to respiratory stressors. Public landscaping could better utilize foliage plants and/or informed floral choices. For health professionals, there is much to do in educating the community about potential negative effects of using essential oil products, for those vulnerable to respiratory symptoms.
This work provides a basis to employ: asthma alerts based upon real-time measures of BVOCs;77 diversity in domestic and urban landscaping, and gardening practices; discerning essential oil product usage; and thoughtful positioning of housing developments, when near some crops and forestry plantations. Most important, the effects of global warming, and temperature increases, as they impact plant emissions,2 need to be included in future health models incorporating BVOCs.
This is a new page in the book of environmental asthma research and provides a basis for others to continue to investigate the effects of BVOCs. Already, pollen and pollution variables have been identified as contributing to asthma and allergic rhinitis; this work adds BVOCs to the list of environmental stressors that can reduce respiratory health. Further, it provides some rationale for the seasonality of effects and enhances understanding of the role of day length, temperature, and atmospheric pressure. The link between temperature and plant emissions invites further research to inform and minimize negative respiratory impact and maximize health, especially for the most vulnerable people in our communities.
Ethics approval and informed consent
Ethics approval was sought and obtained from the Griffith University Human Research Ethics Committee. All methods were performed in accordance with the relevant guidelines and regulations from Griffith University. Informed written consent was obtained from adults, and parents or guardians, and children/minors.
Acknowledgments
I sincerely thank all the volunteer participants, my supporters, the air and flower analysts and the Asthma Foundation of Queensland (now Asthma Australia) for funding the original research that provided data for this analysis. No funding was received for this new analysis of previously collected data. The National Research Centre for Environmental Toxicology, ENTOX provided a scholarship to the author for the preliminary stages of the original project; The Asthma Foundation of Queensland funded the original research and provided scholarships to the author; Griffith University provided equipment and supported the original project throughout. Funding sources had no role in the study design, data collection, data analysis, data interpretation, or writing the article.
Disclosure
The author reports no conflicts of interest in this work.
References
1. de Groot AC, Schmidt E. Essential oils, part III: chemical composition. Dermatitis. 2016;27(4):161–169. doi:10.1097/DER.0000000000000193
2. Farre-Armengol G, Filella I, Llusia J, Niinemets U, Penuelas J. Changes in floral bouquets from compound-specific responses to increasing temperatures. Glob Chang Biol. 2014;20(12):3660–3669. doi:10.1111/gcb.12628
3. Deza G, Garcia-Bravo B, Silvestre JF, et al. Contact sensitization to limonene and linalool hydroperoxides in Spain: a GEIDAC* prospective study. Contact Dermatitis. 2017;76(2):74–80. doi:10.1111/cod.12714
4. Weinberg JL, Flattery J, Harrison R. Fragrances and work-related asthma-California surveillance data, 1993–2012. J Asthma. 2017;54(10):1041–1050. doi:10.1080/02770903.2017.1299755
5. Hagvall L, Bruze M, Engfeldt M, et al. Contact allergy to oxidized geraniol among Swedish dermatitis patients-A multicentre study by the Swedish contact dermatitis research group. Contact Dermatitis. 2018. doi:10.1111/cod.13047
6. Steinemann A. Prevalence and effects of multiple chemical sensitivities in Australia. Prev Med Rep. 2018;10:191–194. doi:10.1016/j.pmedr.2018.03.007
7. Vethanayagam D, Vliagoftis H, Mah D, Beach J, Smith L, Moqbel R. Fragrance materials in asthma: a pilot study using a surrogate aerosol product. J Asthma. 2013;50(9):975–982.
8. Marks G, Pearce N, Strachan D, Innes A. The Global Asthma Report 2014. Auckland, New Zealand: The Global Asthma Network; 2014.
9. Australian Bureau of Statistics A. National health survey: first results. 2014–15 Asthma. 2015.
10. A.I.H.W. Allergic rhinitis (‘hay fever‘); 2016. Available from: https://www.aihw.gov.au/reports/chronic-respiratory-conditions/allergic-rhinitis-hay-fever/contents/allergic-rhinitis-by-the-numbers.
11. Thien F, Beggs PJ, Csutoros D, et al. The Melbourne epidemic thunderstorm asthma event 2016: an investigation of environmental triggers, effect on health services, and patient risk factors. Lancet Planet Health. 2018;2(6):e255–e263. doi:10.1016/S2542-5196(18)30120-7
12. D‘Amato G, Vitale C, D‘Amato M, et al. Thunderstorm-related asthma: what happens and why. Clin Exp Allergy. 2016;46(3):390–396. doi:10.1111/cea.12709
13. Australian Centre for Asthma Monitoring. Australian Institute for Health and Welfare. Asthma in Australia. Canberra; 2011.
14. Glikson M, Rutherford S, Simpson R, Mitchell C, Yago A. Microscopic and submicron components of atmospheric particulate matter during high asthma periods in Brisbane, Queensland, Australia. Atmos Environ. 1995;29(4):549–562. doi:10.1016/1352-2310(94)00278-S
15. Derrick EH. Asthma and the Brisbane climate. Aust NZ J Med. 1972;3:235–346. doi:10.1111/j.1445-5994.1972.tb03068.x
16. Thomas F. Bye-bye
17. Stablein JJ, Bucholtz GA, Lockey RF. Melaleuca tree and respiratory disease. Ann Allergy Asthma Immunol. 2002;89(5):523–530. doi:10.1016/S1081-1206(10)62092-3
18. Rutherford S, Owen J, Simpson R. Survey of airspora in Brisbane, Queensland, Australia. Grana. 1997;36:114–121. doi:10.1080/00173139709362597
19. Suphioglu C. What are the important allergens in grass pollen that are linked to human allergic disease? Clin Exp Allergy. 2000;30(10):1335–1341.
20. Green BJ, Yli-Panula E, Dettmann M, Rutherford S, Simpson R. Airborne Pinus pollen in the atmosphere of Brisbane, Australia and relationships with meteorological parameters. Aerobiologia. 2003;19(1):47–55. doi:10.1023/A:1022662726623
21. Schappi G, Taylor P, Pain M, et al. Concentrations of major grass group 5 allergens in pollen grains and atmospheric particles: implications for hay fever and allergic asthma sufferers sensitized to grass pollen allergens. Clin Exp Allergy. 1999;29(5):633–641.
22. Asthma Foundation of Victoria. The low allergen garden; 2013. Available from: https://www.nationalasthma.org.au/living-with-asthma/resources/patients-carers/factsheets/the-low-allergen-garden.
23. Asthma Foundation of South Australia. Asthma Friendly Gardens. 2016.
24. Gibbs JEM. Eucalyptus pollen allergy and asthma in children: a cross-sectional study in South-East Queensland, Australia. PLoS One. 2015;10:5. doi:10.1371/journal.pone.0126506
25. Dudareva N, Negre F. Practical applications of research into the regulation of plant volatile emission. Curr Opin Plant Biol. 2005;8(1):113–118. doi:10.1016/j.pbi.2004.11.007
26. Konig G, Brunda M, Puxbaum H, Hewitt CN, Duckham SC, Rudolph J. Relative contribution of oxygenated hydrocarbons to the total biogenic VOC emissions of selected mid-European agricultural and natural plant species. Atmos Environ. 1995;29(8):861–874. doi:10.1016/1352-2310(95)00026-U
27. Clement B, Fugit JL, Riba ML, Torres L, Nunes T, Pio C. Isoprene emission from a Eucalyptus globulus forest (Portugal). Fresenius Environ Bull. 1994;3(9):569–574.
28. Kesselmeier J, Staudt M. Biogenic volatile organic compounds (VOC): an overview on emission, physiology and ecology. J Atmos Chem. 1999;33(1):23–88. doi:10.1023/A:1006127516791
29. Lerdau M, Litvak M, Palmer P, Monson R. Controls over monoterpene emissions from boreal forest conifers. Tree Physiol. 1997;17(8/9):563–569.
30. Ralphs MH, Jensen DT, Pfister JA, Nielsen DB, James LF. Storms influence cattle to graze larkspur: an observation. J Range Manage. 1994;47(4):275–278. doi:10.2307/4002547
31. McEwan M, Macfarlane Smith WH. Identification of volatile organic compounds emitted in the field by oilseed rape (Brassica napus ssp. oleifera) over the growing season, headspace. Clin Exp Allergy. 1998;28:332–338.
32. Newman A, ed. Chemistry of Terpenes and Terpenoids. London: Academic Press; 1972.
33. Polya G. Biochemical Targets of Plant Bioactive Compounds. London: Taylor and Francis; 2003.
34. Hagvall L, Christensson JB. Patch testing with main sensitizers does not detect all cases of contact allergy to oxidized lavender oil. Acta Derm Venereol. 2016;96(5):679–683. doi:10.2340/00015555-2319
35. Andersch Bjorkman Y, Hagvall L, Siwmark C, Niklasson B, Karlberg AT, Brared Christensson J. Air-oxidized linalool elicits eczema in allergic patients - a repeated open application test study. Contact Dermatitis. 2014;70(3):129–138. doi:10.1111/cod.12163
36. Hagvall L, Berglund V, Brared Christensson J. Air-oxidized linalyl acetate - an emerging fragrance allergen? Contact Dermatitis. 2015;72(4):216–223. doi:10.1111/cod.12350
37. Hagvall L, Skold M, Brared-Christensson J, Borje A, Karlberg AT. Lavender oil lacks natural protection against autoxidation, forming strong contact allergens on air exposure. Contact Dermatitis. 2008;59(3):143–150. doi:10.1111/j.1600-0536.2008.01402.x
38. Matura M, Goossens A, Bordalo O, et al. Patch testing with oxidized R-(+)-limonene and its hydroperoxide fraction. Contact Dermatitis. 2003;49(1):15–21.
39. National Industrial Chemicals Notification and Assessment Scheme N. Limonene: priority existing chemical assessment report no.22. Commonwealth of Australia. 2002.
40. Patlewicz G, Roberts DW, John DW. QSARs for the skin sensitization potential of aldehydes and related compounds. QSAR Comb Sci. 2003;22(2):196–203. doi:10.1002/qsar.200390012
41. Chen W, Vermaak I, Viljoen A. Camphor-a fumigant during the black death and a coveted fragrant wood in ancient Egypt and Babylon-a review. Molecules. 2013;18(5):5434–5454. doi:10.3390/molecules18055434
42. Burroughs W, Crowder B, Robertson T, Vallier-Talbot E, Whitaker R. Weather Watching. San Francisco: Fog City Press; 2003.
43. Aydin YM, Yaman B, Koca H, et al. Biogenic volatile organic compound (BVOC) emissions from forested areas in Turkey: determination of specific emission rates for thirty-one tree species. Sci Total Environ. 2014;490:239–253. doi:10.1016/j.scitotenv.2014.04.132
44. Anderson W, Prescott GJ, Packham S, Mullins J, Brookes M, Seaton A. Asthma admissions and thunderstorms: a study of pollen, fungal spores, rainfall, and ozone. Qjm. 2001;94(8):429–433.
45. Shah SA, Ishinaga H, Takeuchi K. Pathogenesis of eosinophilic chronic rhinosinusitis. J Inflamm (Lond). 2016;13:11. doi:10.1186/s12950-016-0121-8
46. Wray D, Rees SR, Gibson J, Forsyth A. The role of allergy in oral mucosal diseases. QJM. 2000;93(8):507–511.
47. Nair B. Final report on the safety assessment of Benzyl Alcohol, Benzoic Acid, and Sodium Benzoate. Int J Toxicol. 2001;20(Suppl 3):23–50.
48. Andersen A. Final report on the safety assessment of benzaldehyde. Int J Toxicol. 2006;25(Suppl 1):11–27. doi:10.1080/10915810600716612
49. Rastogi SC, Heydorn S, Johansen JD, Basketter DA. Fragrance chemicals in domestic and occupational products. Contact Dermatitis. 2001;45(4):221–225.
50. Juergens UR, Dethlefsen U, Steinkamp G, Gillissen A, Repges R, Vetter H. Anti-inflammatory activity of 1.8-cineol (eucalyptol) in bronchial asthma: a double-blind placebo-controlled trial. Respir Med. 2003;97(3):250–256.
51. Juergens UR, Stober M, Vetter H. Inhibition of cytokine production and arachidonic acid metabolism by eucalyptol (1.8-cineole) in human blood monocytes in vitro. Eur J Med Res. 1998;3(11):508–510.
52. Juergens UR. Anti-inflammatory properties of the monoterpene 1.8-cineole: current evidence for co-medication in inflammatory airway diseases. Drug Res (Stuttg). 2014;64(12):638–646. doi:10.1055/s-0034-1372609
53. Demers PA, Teschke K, Davies HW, Kennedy SM, Leung V. Exposure to dust, resin acids, and monoterpenes in softwood lumber mills. AIHAJ. 2000;61(4):521–528.
54. Eriksson KA, Stjernberg NL, Levin JO, Hammarstrom U, Ledin MC. Terpene exposure and respiratory effects among sawmill workers. Scand J Work Environ Health. 1996;22(3):182–190.
55. Wolkoff P, Clausen PA, Wilkins CK, Nielsen GD. Formation of strong airway irritants in terpene/ozone mixtures. Indoor Air. 2000;10(2):82–91.
56. Ohta K, Yamashita N. Apoptosis of eosinophils and lymphocytes in allergic inflammation. J Allergy Clin Immunol. 1999;104(1):14–21.
57. Kankaanranta H, Moilanen E, Zhang X. Pharmacological regulation of human eosinophil apoptosis. Curr Drug Targets Inflamm Allergy. 2005;4(4):433–445.
58. Wark PA, Johnston SL, Bucchieri F, et al. Asthmatic bronchial epithelial cells have a deficient innate immune response to infection with rhinovirus. J Exp Med. 2005;201(6):937–947. doi:10.1084/jem.20041901
59. Nakano K, Nakayachi T, Yasumoto E, et al. Induction of apoptosis by b-diketones in human tumor cells. Anticancer Res. 2004;24(2B):711–717.
60. Na HJ, Koo HN, Lee GG, et al. Juniper oil inhibits the heat shock-induced apoptosis via preventing the caspase-3 activation in human astrocytes CCF-STTG1 cells. Clin Chim Acta. 2001;314(1–2):215–220.
61. Pepeljnjak S, Kosalec I, Kalodera Z, Blazevic N. Antimicrobial activity of juniper berry essential oil (Juniperus communis L., Cupressaceae). Acta Pharm. 2005;55(4):417–422.
62. de Groot AC, Frosch PJ. Adverse reactions to fragrances. A clinical review. Contact Dermatitis. 1997;36(2):57–86.
63. Schnuch A, Uter W, Geier J, Lessmann H, Frosch PJ. Sensitization to 26 fragrances to be labelled according to current European regulation: result of the IVDK and review of the literature. Contact Dermatitis. 2007;57(1):1–10. doi:10.1111/j.1600-0536.2007.01088.x
64. Landmeyer JE. U.S. Geological Survey CSC. Aquifer response to record low barometric pressures in the southeastern United States. Ground Water. 1996;34(5):917–924. doi:10.1111/gwat.1996.34.issue-5
65. Couriel E, Modra B, Jacobs R. NSW sea level trends-the ups and downs.
66. de Gouw JA, Howard CJ, Custer TG, Fall R. Emissions of volatile organic compounds from cut grass and clover are enhanced during the drying process. Geophys Res Lett. 1999;26(7):811–814. doi:10.1029/1999GL900076
67. Murray AB, Milner RA. The accuracy of features in the clinical history for predicting atopic sensitization to airborne allergens in children. J Allergy Clin Immunol. 1995;96(5 Pt 1):588–596.
68. Masoli M, Fabian D, Holt S, Beasley R. The Global Burden of Asthma. Global Initiative for Asthma, Fontana, Wisconsin, (GINA); 2004.
69. Hales S, Lewis S, Slater T, Crane J, Pearce N. Prevalence of adult asthma symptoms in relation to climate in New Zealand. Environ Health Perspect. 1998;106(9):607–610. doi:10.1289/ehp.98106607
70. Yokouchi Y, Ambe Y. Factors affecting the emission of monoterpenes from red pine (Pinus densiflora). Plant Physiol. 1984;75(4):1009–1012.
71. Staudt M, Lhoutellier L. Monoterpene and sesquiterpene emissions from Quercus coccifera exhibit interacting responses to light and temperature. Biogeosciences. 2011;8(9):2757–2771. doi:10.5194/bg-8-2757-2011
72. Boelens MH, Jimenez R. The chemical composition of Spanish myrtle oils. II. J Essent Oil Res. 1992;4(4):349–353. doi:10.1080/10412905.1992.9698084
73. Jakobsen HB, Friis P, Nielsen JK, Olsen CE. Emission of volatiles from flowers and leaves of Brassica napus in situ. Phytochemistry. 1994;37(3):695–699. doi:10.1016/S0031-9422(00)90341-8
74. Farre-Armengol G, Filella I, Llusiã J, Niinemets U, Penuelas J. Optimum temperature for floral terpene emissions tracks the mean temperature of the flowering season. Funct Plant Biol. 2015;42(9):851–857. doi:10.1071/FP14279
75. Nah T, Sanchez J, Boyd CM, Ng NL. Photochemical aging of alpha-pinene and beta-pinene secondary organic aerosol formed from nitrate radical oxidation. Environ Sci Technol. 2016;50(1):222–231. doi:10.1021/acs.est.5b04594
76. de Groot AC, Schmidt E. Tea tree oil: contact allergy and chemical composition. Contact Dermatitis. 2016;75(3):129–143. doi:10.1111/cod.12591
77. Liu X, Pawliszyn R, Wang L, Pawliszyn J. On-site monitoring of biogenic emissions from Eucalyptus dunnii leaves using membrane extraction with sorbent interface combined with a portable gas chromatograph system. Analyst (Cambridge, U K). 2004;129(1):55–62. doi:10.1039/b311998j
78. Rinnan R, Steinke M, McGenity T, Loreto F. Plant volatiles in extreme terrestrial and marine environments. Plant Cell Environ. 2014;37(8):1776–1789. doi:10.1111/pce.12320
79. Helsper JPFG, Davies JA, Bouwmester HJ, et al. Circadian rhythmicity in emission of volatile compounds by flowers of Rosa hybrida L. cv. Honesty. Planta. 1998;207(1):88–95. doi:10.1007/s004250050459
 © 2019 The Author(s). This work is published and licensed by Dove Medical Press Limited. The
full terms of this license are available at https://www.dovepress.com/terms
and incorporate the Creative Commons Attribution
- Non Commercial (unported, 3.0) License.
By accessing the work you hereby accept the Terms. Non-commercial uses of the work are permitted
without any further permission from Dove Medical Press Limited, provided the work is properly
attributed. For permission for commercial use of this work, please see paragraphs 4.2 and 5 of our Terms.
© 2019 The Author(s). This work is published and licensed by Dove Medical Press Limited. The
full terms of this license are available at https://www.dovepress.com/terms
and incorporate the Creative Commons Attribution
- Non Commercial (unported, 3.0) License.
By accessing the work you hereby accept the Terms. Non-commercial uses of the work are permitted
without any further permission from Dove Medical Press Limited, provided the work is properly
attributed. For permission for commercial use of this work, please see paragraphs 4.2 and 5 of our Terms.