Back to Journals » International Journal of Nanomedicine » Volume 12
Essential oil-mediated glycerosomes increase transdermal paeoniflorin delivery: optimization, characterization, and evaluation in vitro and in vivo
Authors Zhang K ![]() , Zhang Y
, Zhang Y ![]() , Li Z, Li N, Feng N
, Li Z, Li N, Feng N ![]()
Received 28 February 2017
Accepted for publication 18 April 2017
Published 5 May 2017 Volume 2017:12 Pages 3521—3532
DOI https://doi.org/10.2147/IJN.S135749
Checked for plagiarism Yes
Review by Single anonymous peer review
Peer reviewer comments 2
Editor who approved publication: Dr Linlin Sun
Kai Zhang, Yongtai Zhang, Zhe Li, Nana Li, Nianping Feng
Department of Pharmaceutical Sciences, School of Pharmacy, Shanghai University of Traditional Chinese Medicine, Shanghai, People’s Republic of China
Abstract: In this study, a novel glycerosome carrier containing essential oils was prepared for topical administration of paeoniflorin (PF) to enhance its transdermal drug delivery and improve drug absorption in the synovium. The formulation of glycerosomes was optimized by a uniform design, and the final vehicle was composed of 5% (w/v) phospholipid, 0.6% (w/v) cholesterol, and 10% (v/v) glycerol, with 2% (v/v) Speranskia tuberculata essential oil (STO) as the transdermal enhancer. The in vitro transdermal flux of PF loaded in the STO-glycerosomes was 1.4-fold, 1.6-fold, and 1.7-fold higher than those of glycerosomes, liposomes, and tinctures, respectively. In vivo studies showed that the use of STO-glycerosomes was associated with a 3.1-fold greater accumulation of PF in the synovium than that of common glycerosomes. This finding was confirmed by in vivo imaging studies, which found that the fluorescence intensity of Cy5.5-loaded STO-glycerosomes in mice knee joints was 1.8-fold higher than that of the common glycerosomes 5 h after administration. The glycerosomes mediated by STO exhibited considerable skin permeability as well as improved drug absorption in the synovium, indicating that STO-glycerosomes may be a potential PF transdermal delivery vehicle for the treatment of rheumatoid arthritis caused by synovium lesions.
Keywords: paeoniflorin, transdermal, glycerosomes, liposomes, permeation enhancers, essential oil
Introduction
Rheumatoid arthritis (RA) is a long-lasting autoimmune disease characterized by synovium inflammation in multiple joints, leading ultimately to severe cartilage erosion and articular destruction.1 In recent decades, significant progress has been achieved in the development of drug therapies for RA. However, due to the limited therapeutic index and short effective period, the clinical applications of the current RA therapeutics are hindered, and RA patients often experience systemic adverse reactions due to repeated administration and long-term treatments. Paeoniflorin (PF), a monoterpene glucoside, is isolated from the root of Paeonia lactiflora Pall. As an anti-inflammatory and immune-regulatory drug, PF has been reported to have a clinically significant therapeutic effect on several inflammatory diseases, such as RA and Sjogren’s syndrome.2–6 However, the clinical use of PF is limited by its poor bioavailability (approximately 3%–4%) with oral administration.7 This limitation is probably attributable to its lack of lipophilicity, efflux via p-glycoprotein, and hydrolysis in the intestine.8
On the other hand, a number of transdermal drug delivery systems (TDDSs) have shown unique advantages in the treatment of RA, such as enhancing the efficacy and decreasing the gastrointestinal irritation of the therapeutic drugs.9–12 Meanwhile, vesicular formulations have demonstrated an impressive ability to enhance the permeability of RA drugs.13 Studies have previously reported that liposomal encapsulation of RA drugs may improve drug accumulation in inflamed synovial tissue, but conventional liposomes often suffer from the shortcomings of instability, low encapsulation efficiency (EE), and limited drug delivery efficiency.14 Ethosomes are a novel type of liposomes containing a high concentration of short-chain alcohols, including ethanol, propylene glycol, or even a mixture of ethanol and propylene glycol.15–17 The addition of ethanol improves the deformability of vesicles, thus overcoming some of the disadvantages of the conventional liposomes, but also carries the risk of skin irritation.
Recently, Manca et al described a new approach to enhance the permeability of liposomes by adding a high concentration of glycerol (10%–30%, v/v) and named the novel vesicular preparations as “glycerosomes”.18,19 Glycerol is a harmless and fully acceptable short-chain alcohol that can improve the fluidity and deformability of the liposomal bilayer, thus improving the ability of preparations to penetrate through the skin. Furthermore, transdermal drug delivery efficiency can be improved by using penetration enhancers that can reversibly decrease barrier resistance. Azones, sulfoxides, and pyrrolidones are the most commonly used penetration enhancers in preparations, but these chemical enhancers exhibit some degree of toxicity and skin irritancy.20,21 Instead, essential oils extracted from natural plants have received attention from researchers due to their high penetration and hypotoxicity.
The objective of this study was to develop a PF-loaded TDDS based on glycerosomes in order to improve the transdermal drug delivery of PF. Meanwhile, essential oils extracted from Speranskia tuberculata (STO) were added to the glycerosome system in an attempt to promote the penetration of glycerosomes through the skin. The microstructure, storage stability, in vitro skin permeability, in vivo synovium deposition, and skin irritation of STO-glycerosomes were investigated.
Materials and methods
Materials
PF (purity >98%) was purchased from Chengdu Biopurify Phytochemicals Ltd. (Chengdu, People’s Republic of China). Lipoid S 80 (phosphatidylcholine containing 76% of soybean lecithin) was obtained from Lipoid GmbH (Ludwigshafen, Germany). Cy5.5-NHS ester was purchased from Lumiprobe Corporation (Hallandale Beach, FL, USA). S. tuberculata was obtained from Bozhou Changfu Pharmaceutical Ltd. (Anhui, People’s Republic of China). PF and salidroside standards (purity >99.8%) were obtained from the National Institute for the Control of Pharmaceutical and Biological Products (Beijing, People’s Republic of China). Liquid chromatography-grade methanol and acetonitrile were purchased from Merck (Darmstadt, Germany). Liquid chromatography-grade ammonium acetate was purchased from Sigma-Aldrich (St Louis, MO, USA). Other chemicals were obtained from Sinopharm Chemical Reagent (Shanghai, People’s Republic of China) and were of analytical grade.
Animals
Male Sprague Dawley rats weighing 180±20 g, nude mice weighing 20±2 g, and guinea pigs weighing 250±20 g were supplied by the Lab Animal Center of Shanghai University of Traditional Chinese Medicine (Shanghai, People’s Republic of China). The animal care and experiments were performed with the approval of the animal ethical committee of Shanghai University of Traditional Chinese Medicine, according to the requirements of the National Act on the Use of Experimental Animals (People’s Republic of China). All the animals were kept in an agreeable environment with free access to a rodent diet and water and were acclimatized for 1 week before the beginning of the study. All procedures followed the guidelines of the institutional animal ethical committee of Shanghai University of Traditional Chinese Medicine.
Drug determination methods
PF in samples from in vitro studies was analyzed using an LC-2010A HT Liquid Chromatograph system (Shimadzu Corporation, Kyoto, Japan) with a Diamonsil™ C18 reverse-phase column (250×4.6 mm, 5 μm; Dikma Technologies, Beijing, People’s Republic of China). The mobile phase was a mixture of acetonitrile–water–phosphate (16:84:0.1, v/v/v) with a flow rate of 1 mL/min. The column temperature was maintained at 30°C, and the detection wavelength was 230 nm.
The in vivo synovium homogenate samples were analyzed using a TSQ-Quantum UHPLC system (Thermo Finnigan, San Jose, CA, USA). Chromatographic separations were accomplished on a Syncronis C18 reverse-phase column (50×2.1 mm, 1.7 μm; Thermo Finnigan) maintained at 30°C. The mobile phase was methanol and 5 mmol/L ammonium acetate at a ratio of 30:70 (v/v) with a flow rate of 0.2 mL/min. The mass spectrometer was operated as follows: spray voltage, 3,500 V; capillary temperature, 351°C; sheath gas (N2) pressure, 30 psi; and auxiliary gas (N2) pressure, 10 psi. The analytes were monitored using positive selected reaction monitoring mode at m/z 498.2→179.1 for PF and m/z 318.2→121.1 for internal standard (IS). Xcalibur 1.2 data analysis system was used for data handling.
Extraction and compositional analysis of STO
Fresh samples of S. tuberculata (250 g) were soaked in water (3,000 mL) for 12 h, and then distilled at the temperature of 200°C for 10 h using a Clevenger-type apparatus.22 The yellow-colored STO was collected and stored in sealed vials at 4°C. The compositional analysis of STO was performed using an Agilent 7890B/5977A GC-MS system (Agilent Technologies, Santa Clara, CA, USA) equipped with an HP-5MS capillary column (30×0.25 mm, 0.25 μm film thickness; Agilent Technologies). STO was diluted in ether at a ratio of 1:250 (v/v). A split of 1:15 (v/v) was used for the injection of 1 μL of the sample. The injector temperature was 300°C, and the gas chromatography (GC) oven was programmed from 100°C to 280°C at 10°C/min. High-purity helium was used as carrier gas at a flow rate of 1.2 mL/min. The ionization voltage was 70 eV, and the ion source was kept at 230°C. The chemical constituents were identified by comparing the spectra with the mass spectrometry (MS) library database (NIST 11). Component relative amounts were calculated based on GC peak areas without any correction factor.
Preparation of glycerosomes and the compared preparations
Glycerosomes were prepared using the reverse-phase evaporation method.23 Compositions of glycerosome formulations are shown in Table 1. Briefly, lipoid S 80 and cholesterol were dissolved in a mixture of methanol and chloroform (3:1, v/v), while PF was dissolved in a glycerol–water solution. The aqueous phase was added to the organic phase at a ratio of 1:3 (v/v) and sonicated for 30 min in a bath sonicator to form a uniform emulsion. The organic solvents were then removed by rotary evaporation to obtain a dry film. The resulting film was hydrated with glycerol–water solution and sonicated in an ice water bath using an ultrasonic cell disintegrator (JY92-IIDN; Ningbo Scientz Technology Co. Ltd, Ningbo, People’s Republic of China) for 2 min (power: 380 W, quiescent interval: 3 s). The final concentration of PF in each formulation was 0.2% (w/v), and a uniform design was used in this study to optimize the glycerosome formulations.17
 | Table 1 Compositions of glycerosomes and the results of the U*7(74) uniform design experiments (n=3) |
STO-glycerosomes were prepared based on optimized formulations. First, the PF-loaded hydration solution was prepared, and then 2% (v/v) STO was added to the milky solution, and whirled for 20 min, followed by a probe sonication. Conventional liposomes were prepared using a similar reverse-phase evaporation method described earlier for glycerosomes but hydrated instead using purified water. PF tinctures were prepared by adding PF at a concentration of 0.2% (w/v) to 10% ethanol (in purified water, v/v).
Characterization of glycerosomes
The particle size and polydispersity index (PDI) of glycerosomes were analyzed using dynamic light scattering (DLS) technique with a Malvern Autosizer Nano ZS90 inspection system (Malvern Instruments Ltd, Malvern, UK) at 25°C and an angle of 90°. Zeta potential was measured with the same system. Glycerosome samples were diluted with a glycerol–water solution before measurements to achieve a suitable scattering intensity.
The appearance of the STO-glycerosomes was examined using a transmission electron microscope (JEM-1230; JEOL, Tokyo, Japan). Samples were prepared for negative staining as follows: glycerosomes were diluted with a 10% (v/v) glycerol–water solution and gently dropped on a film-coated copper grid (Zhong Jing Ke Yi Technology Inc., Beijing, People’s Republic of China). After 20 min of drying, a drop of phosphotungstic acid (2%, v/v) was added to the film. After air-drying for 3 h at room temperature, the film was observed under a transmission electron microscope.
EE
EE was determined using an ultrafiltration method.24 PF glycerosomes (0.5 mL) were placed into the centrifugal filter tubes (30 kDa; Pall Corporation, Port Washington, NY, USA) and centrifuged (Eppendorf AG, Hamburg, Germany) at 5,827× g for 10 min. The free drug was collected at the bottom of the tube through the membrane. The total drug content was measured after extraction with 10-fold methanol in an ultrasonic bath. The concentration of PF was then determined by high-performance liquid chromatography (HPLC), and EE was calculated using Equation (1).
|
|
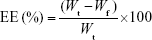
where Wt is the total amount of PF in glycerosomes and Wf is the amount of free drug untrapped in glycerosomes. The results are reported as the mean values of three independent experiments performed in triplicate.
Stability of STO-glycerosomes
For stability evaluation, STO-glycerosomes were stored either at refrigeration temperature (4°C±2°C) or at room temperature (25°C±2°C) for 1 month. After 0 day, 7 days, and 30 days, their vesicle size distribution and EE were determined in order to estimate the effect of storage temperature on the physical and chemical stability of STO-glycerosomes.
In vitro skin permeation studies
The in vitro permeation experiments were conducted using a Franz diffusion cell (Fulansi Electronic Science and Trade Co, Ltd., Tianjin, People’s Republic of China) fitted with excised rat abdominal skin.25 The prepared STO-glycerosomes were compared with glycerosomes, liposomes, and tinctures. Each donor compartment had a diffusion area of 2 cm2, and 1 mL of the PF-loaded preparations was added (n=6 per formulation). Each receptor compartment was filled with 12.5 mL of freshly prepared normal saline containing 20% (v/v) polyethylene glycol 400 to provide sink conditions, maintained at 37°C±0.5°C by using a thermostat, and stirred with a magnetic bar at 300 rpm.26 At predetermined time points, 1 mL of samples was removed from each receptor compartment, which was replenished with an equal volume of receptor fluid equilibrated to 37°C±0.5°C. The obtained samples were analyzed using HPLC.
In vivo synovium deposition studies
Rats were anesthetized with 20% (w/v) urethane, and the fur of the knees was molted using depilatory creams. A 3×3×0.3 cm cotton pad was spread on the left knee of rats, and 1 mL of the prepared PF glycerosomes was evenly dropped onto the pad with a pipette. Each cotton pad was guaranteed to be completely soaked, and finally, it was bound by a waterproof surgical tape. Using the same procedure, the right knee was treated without loading to act as a non-loaded control.27 Rats were euthanized 5 h after the administration. Subsequently, the synovium was surgically removed from the knee joints of the rats according to the following steps: 1) rats were fixed in the supine position, and the skin was longitudinally incised from 1 cm above the median of knee to the toes; 2) the patella was grasped gently with fine-toothed forceps, and then incisions were made on the superior margin and along the bilateral sides of the patella; and 3) the synovium was carefully separated and cut.28–30 Residual synovium was harvested using a curet. Further, normal saline (1 mL) was added to the synovial tissues prior to homogenization with a tissue grinder (Shanghai Specimen Model Factory, Shanghai, People’s Republic of China), ensuring that the drugs in the synovium could be completely dissolved. The synovium homogenate was centrifuged at 5,827× g for 10 min. Six hundred microliters of the supernatants, 30 μL of salidroside (IS, 10 μg/mL), and 1,800 μL of methanol were mixed and then centrifuged at 11,654× g for 10 min. The resulting supernatants were dried under nitrogen and redissolved in 100 μL methanol prior to ultrahigh-pressure liquid chromatography–MS/MS analysis.
In vivo fluorescence imaging
Cy5.5-NHS ester, a near-infrared fluorescence, was used to replace PF in each preparation. Male nude mice were anesthetized and fixed in a dark place. Then, 0.3 mL of Cy5.5-loaded preparations (10 μmol/L Cy5.5 in STO-glycerosomes and common glycerosomes) was dropped onto 1.5×1.5×0.3 cm cotton pads that were applied on the left knee of mice, and other steps were the same as mentioned earlier. After 5 h of administration, the cotton pads were discarded, and excess preparations were wiped from the surface of the skin. Mice were subsequently scanned in the IVIS Lumina XR optical imaging system (PerkinElmer, Waltham, MA, USA). The following parameters were used: excitation wavelength at 678 nm, emission wavelength at 695 nm, and exposure time at 60 ms. Lumina II Living Image 4.3 software was used to quantify the fluorescence remaining in each knee joint by calculating the flux radiating omnidirectionally from the region of interest (ROI) and graphed as radiant efficiency ([p/s/cm2/sr]/[μW/cm2]). To yield a standardized ROI for measurement of the knee fluorescence, the automatic square mode was used for integration.
Skin irritation
Guinea pigs were shaved on the abdominal side and randomly divided into two groups: an intact-skin group and a skin-injury group. The skin of animals in the latter group was slashed with a blade until capillary hemorrhage was observed. Then, 1 mL of STO-glycerosomes was applied on shaven abdominal skin of the respective animal groups following the same steps mentioned earlier. After 5 h of administration, the applied formulations were gently washed by warm water. Skin irritation was subsequently examined for any erythema and/or edema after 1 h. This test procedure was carried out in intact-skin group once a day for 3 days, and the skin was also observed at 24 h, 48 h, and 72 h after treatment.
Finally, the skin samples were excised from the administration region, fixed in 10% (w/v) neutral buffered formalin, embedded in paraffin, and stained with hematoxylin–eosin.
Statistical analysis
Results are presented as mean ± standard deviation. The uniform design study results were analyzed by multivariate linear regression using the SPSS software version 18.0 (SPSS Inc., Chicago, IL, USA). The one-way analysis of variance was utilized to test for differences among the experimental groups. P<0.05 was considered to be statistically significant.
Results
Chemical components of STO
The results obtained from GC–MS analysis of STO are shown in Table 2 and Figure 1. A total of 14 compounds were identified, representing 99.04% of the essential oils. These components were belonging to different chemical classes, with sesquiterpenes identified as the most abundant constituent. The major components of STO were caryophyllene (43.74%), 3,3,6,6,9,9-hexamethyl tetracyclo[6.1.0.0(2,4).0(5,7)]nonane (35.82%), and aromadendrene (5.36%). Moreover, the remaining compounds were present in low amounts, with most of them existing at less than 3% abundance.
 | Table 2 Chemical compositions of Speranskia tuberculata essential oil as identified by gas chromatography–mass spectroscopy (GC–MS) |
 | Figure 1 Gas chromatography–mass spectroscopy chromatogram of Speranskia tuberculata essential oil. |
Optimized formulation of glycerosomes
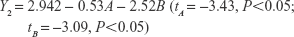
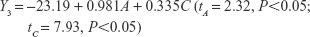
The uniform design with a U*7(74) table used in this study included the following three factors: the concentration of phospholipid (factor A), the concentration of cholesterol (factor B), and the amount of glycerol in water (factor C). The experimental responses were defined as Y1 for particle size, Y2 for PDI, Y3 for zeta potential, and Y4 for encapsulation efficiency (EE) (Table 1).
The multivariate linear regression equations were generated using a stepwise multiple linear regression analysis and are given as Equations (2)–(5):
|
|

|
|
|
|
|
|

The t-values and P-values in significance tests of coefficients are given. The best-fit model was chosen based on a P-value <0.05, which indicated that the significant effects were generated from the factors on the responses. Higher values of the coefficients with one factor represented a greater influence on the responses. A positive sign for a coefficient indicated a synergistic effect, while a negative sign indicated an antagonistic effect of the factors.
As shown in Table 1, the particle size distributions of glycerosomes ranged from 179.33±11.06 nm to 368.75±16.70 nm. Equation (2) indicates that the amount of glycerol in water significantly affected the particle size of glycerosomes. Particle size tended to correlate positively with the amount of glycerol. Equation (3) shows that the PDI level was markedly influenced by the concentration of cholesterol and the concentration of phospholipid. Equation (4) shows that the absolute value of the zeta potential decreased as the concentration of phospholipid and the volume fraction of glycerol increased. Equation (5) represents the linear regression models for EE. The concentration of phospholipid that significantly affected EE was identified. The positive coefficient of factor A revealed that an increase in EE was observed with an increase in the concentration of phospholipid.
In order to identify the optimal formulation of glycerosomes from the uniform design, the smallest particle size and PDI and the highest EE were taken into consideration.31,32 The final optimal formulation was composed of lipoid S 80 at the concentration of 5% (w/v), cholesterol at the concentration of 0.6% (w/v), and glycerol at a volume fraction of 10% (v/v). A new batch of glycerosomes was then prepared for validation. The results showed that optimal PF-loaded glycerosomes had a satisfactory level of particle size at 198.57±15.93 nm, a PDI at 0.24±0.02, and a zeta potential at −16.40±1.20 mV. The EE of the optimal glycerosome formulation reached 51.24%±1.79%, which is rather ideal for PF as a highly water-soluble drug.
Characteristics of STO-glycerosomes
Using the optimal formulation, the morphologies of STO-glycerosomes were observed using transmission electron microscopy (TEM). When a thin film of lipid was hydrated by aqueous media, it had a tendency to constitute an enclosed vesicular structure. As shown in Figure 2, STO-glycerosomes were found to be spherical in shape, with a few being prolate or oval. The well-identified spherical-shaped vesicles appeared separately from each other and uniform in size. No disruptions of structure confirmed vesicle integrity after short-duration probe sonication. STO-glycerosomes exhibited a satisfactory level of particle size at 201.03±10.19 nm, PDI at 0.25±0.02, zeta potential at −17.93±0.68 mV, and EE at 51.26%±2.02%. However, DLS led to larger values for the size of STO-glycerosomes compared to TEM. This may be attributed to the influence of the hydrodynamic shell.33
 | Figure 2 Transmission electron microscopic photo of Speranskia tuberculata essential oil-glycerosomes at magnification ×50,000. |
Stability of STO-glycerosomes
Particle size and EE of STO-glycerosome formulations at baseline and after storage at room and refrigeration temperature for 30 days are shown in Figure 3. Particle size of STO-glycerosomes increased and the EE decreased after storage at room temperature (P<0.05), while there was no significant change when stored under refrigeration (4°C), indicating that the refrigeration condition (4°C) was more suitable than room temperature for storing STO-glycerosomes.
 | Figure 3 Changes in the (A) particle size and (B) encapsulation efficiency of Speranskia tuberculata essential oil-glycerosomes after 30-day storage at different temperatures (n=3) (*P<0.05, compared to the baseline). |
Transdermal flux of PF
Permeation profiles of PF were obtained by plotting the mean cumulative permeation amount per cm2 of preparations against time. The transdermal flux was calculated as the slope of the linear portion of the plot. As shown in Figure 4, the cumulative amount of PF released by STO-glycerosomes was higher than that for both controls at 5 h after administration and up to 24 h (P<0.05). As shown in Figure 5, transdermal flux of PF from STO-glycerosomes was 1.55±0.10 μg/cm2/h, which was 1.4-fold, 1.6-fold, and 1.7-fold higher than that from the glycerosomes, liposomes, and tinctures, respectively (P<0.05). All the vesicular carriers exhibited higher transdermal flux of PF compared to tinctures (P<0.05). Furthermore, both glycerosomal preparations presented better transdermal performance when compared to liposomes (P<0.05).
 | Figure 4 In vitro skin permeation profiles of paeoniflorin from different formulations (n=6; STO, Speranskia tuberculata essential oil). |
 | Figure 5 In vitro transdermal fluxes of paeoniflorin from different preparations (n=6; STO, Speranskia tuberculata essential oil) (*P<0.05, compared with tinctures; #P<0.05, compared with liposomes). |
In vivo synovium deposition
As shown in Figure 6, synovium deposition of PF was higher for all glycerosomes with STO than common glycerosomes (P<0.05), especially for 2% (v/v) STO-glycerosomes, which exhibited approximately 3.1-fold higher deposition of PF than common glycerosomes.
 | Figure 6 In vivo rat synovium deposition of paeoniflorin (PF) from glycerosomes with different percentages of Speranskia tuberculata essential oil (STO) (n=8) (*P<0.05, compared with glycerosomes; #P<0.05, compared with 2% STO-glycerosomes). |
The results also revealed that the concentration of PF in the synovium significantly increased, with the STO percentage rising from 1% to 2% (v/v) (P<0.05). However, when STO reached 3% (v/v), synovium deposition of PF showed a downward trend (P<0.05).
In vivo fluorescence imaging
After administration for 5 h, significant fluorescence was observed only in the loaded left knees of mice (Figure 7A). The amount of fluorescence localized in the joint reached 9.29±0.70×10⁷ ([p/s/cm2/sr]/[μW/cm2]) for Cy5.5-loaded STO-glycerosomes, which was 1.8-fold higher than that of common glycerosomes (P<0.05). Figure 7B shows that the amount of fluorescence was weak 1 h after administration, but with prolonged application (8 h) of the medication, the fluorescence signal reached 2.51×10⁸ ([p/s/cm2/sr]/[μW/cm2]) for Cy5.5-loaded STO-glycerosomes. Similar trends were displayed in the in vitro studies. To examine the biodistribution of Cy5.5-loaded STO-glycerosomes, the whole body of mice was scanned. Figure 7C shows that the Cy5.5-loaded STO-glycerosomes were mainly distributed in the knee joint after administration for 8 h, indicating that STO-glycerosomes demonstrate sustained release of drugs.
 | Figure 7 In vivo imaging of the knee-joint region of nude mice after topical application of Cy5.5-labeled preparations: (A) after administration for 5 h, each group has three parallels; (B) after administration of Speranskia tuberculata essential oil (STO)-glycerosomes for 1 h, 5 h, and 8 h; (C) biodistribution of STO-glycerosomes with whole-body imaging 8 h after application. |
Skin irritation
No signs of skin irritation like erythema or edema were observed after exposure to STO-glycerosomes on both intact (Figure 8A) and injured skin (Figure 8B). Compared with normal skin, no histopathological changes were identified in the skin samples of treatment groups (Figure 8C). This indicates good biocompatibility of STO-glycerosomes to skin.
 | Figure 8 Irritation response of guinea pig abdominal skin: (A) photographs of intact skin after treatment with Speranskia tuberculata essential oil (STO)-glycerosomes for 3 consecutive days, as compared to untreated skin; (B) injured skin observed at 1 h, 24 h, 48 h, and 72 h after treatment with STO-glycerosomes; (C) histopathology images of untreated skin (left), and STO-glycerosomes-treated intact (middle) and injured (right) skin samples isolated from representative guinea pigs at magnification ×200. |
Discussion
In this study, we designed a PF-loaded glycerosomes formulation in order to improve the transdermal delivery and synovium absorption of PF. Hydrophilic drugs like PF often suffer from a low encapsulation rate and easily leak out during the preparation of liposomes due to their poor affinity with the phospholipid membrane.34 We found that the EE of PF could be significantly improved when using the reverse-phase evaporation method, which was superior to the injection method and the film dispersion method. This effect might be due to the improvement in the concentration of hydrophilic drugs in the inner water phase by the reverse-phase evaporation method, leading to the formation of large unilamellar vesicles.35,36
In the uniform design, the EE was improved by increasing the phospholipid concentration in experimental formulations. Similar findings were previously reported by Shen et al and Fang et al.17,37 Glycerosomes are a kind of closed vesicles with a lipid bilayer structure similar to the biomembrane. The increase in phospholipid concentration will provide more vesicles, thus supplying more opportunities for PF to encapsulate into the inner water phase enclosed by the phospholipid bilayer membrane and enhancing the EE.38 Cholesterol in the phospholipid bilayer acted as a membrane-rigidifying agent, and it had a significant effect on the PDI of glycerosomes in this study. This effect may be connected with the ability of cholesterol to stabilize the lipid bilayer and to ensure that the vesicles are uniformly distributed in the water medium.39 The particle size of glycerosomes increased as the amount of glycerol in the water phase increased; this might be associated with the sticky texture of glycerol.18
The addition of STO (2%, v/v) had no significant effect on the particle size and EE of the preparations. Moreover, the stability of STO-glycerosomes was affected by the storage temperature. While under a high temperature the mobility of phospholipid molecules increases, the lipid membrane becomes more fluid, accelerating leakage of the drug.40 The phenomenon of increase in particle size with decrease in PDI of STO-glycerosomes at a higher temperature was likely due to reduction of repulsive force between vesicles, which might lead to aggregation and fusion of small vesicles into bigger ones.41
In vitro studies indicated that the transdermal flux of PF from STO-glycerosomes was significantly higher than that of the glycerosomes, liposomes, and tinctures. It has been reported that liposomes could not deeply penetrate the skin but were confined to the upper layers of the stratum corneum.42 In contrast, ethosomes could increase the mobility of skin lipids, enhancing drug permeation into the stratum corneum due to their excellent deformability.43 The short-chain alcohols added in ethosomes crucially affect the performance of percutaneous absorption. The short-chain alcohols added in ethosomes could downregulate the phase transmission temperature of lipid bilayer in stratum corneum, leading to phase separation and crystal-phase transformation of solid and liquid lipids in the lipid bilayer and changing the dense arrangement of lipid molecules.44 Glycerol, with its higher viscosity and hygroscopicity, may increase the flexibility and fluidity of the liposomal bilayer and increase the affinity of substances with the water-based dermis layers, thus improving the ability of glycerosomes to squeeze through the skin barrier.18 Meanwhile, with the additional help of STO, glycerosomes could effectively deliver PF across the skin and then increase the drug concentration in the synovium.
In vivo studies showed that all the STO-glycerosomes presented higher synovium deposition of PF than common glycerosomes, especially 2% (v/v) STO-glycerosomes. Similar results were found in the in vivo imaging experiments. These confirmed that STO exhibited good penetration, thereby enhancing the transdermal delivery of PF in glycerosomes. We also found that the synovium deposition of PF was increased with rising proportions of STO but peaked at a certain amount and then the drug absorption decreased. A similar phenomenon was observed by Zhang et al, and it may be because large amounts of essential oils may increase viscosity and the formation of a gel on the surface of vesicles.26 Moreover, we observed an increase in particle size and a decrease in zeta potential of 3% (v/v) STO-glycerosomes in previous studies, which could lead to decreased stability of gel system; this may have a negative impact on the penetration and accumulation of PF.
Percutaneous drug absorption was hindered mainly by the extraordinary barrier properties of stratum corneum, which is the outermost layer of the epidermis. One mechanism by which essential oils operate is the modification of the solvent property of the stratum corneum.20 On the other hand, essential oils may also change the solubility behavior and diffusion properties of drugs into the stratum corneum.45 The present results have shown that STO contains mainly sesquiterpenes, which may improve the permeation of drugs by disrupting the lipid packaging of stratum corneum and/or disturbing the stacking of bilayers, and then enhance the penetration of glycerosomes into the skin, just as the function of terpenes in the invasomes.46–49 Moreover, the permeation-enhancing effect of caryophyllene and aromadendrene identified in STO has been reported by recent research.50–52
Conclusion
A novel glycerosome carrier containing essential oils was developed for the transdermal delivery of PF. Compared with conventional preparations, STO-glycerosomes showed better percutaneous penetration properties and significantly enhanced the accumulation of PF in the synovium. In vivo studies also suggested that the drug concentration in the knee joint could remain elevated at a high level even after a long time. These effects were closely related to the combination of glycerol and essential oils added in the liposomal system. Furthermore, skin irritation study demonstrated that STO-glycerosomes had good biocompatibility with skin tissue. These findings indicate that STO-glycerosomes are a potentially safe and applicable vehicle of PF for the treatment of RA.
Acknowledgments
This work was financially supported by the Shanghai University of Traditional Chinese Medicine (No A2-P3550807) and the National Natural Science Foundation of China (No 81573619).
Disclosure
The authors report no conflicts of interest in this work.
References
Catrina AI, Joshua V, Klareskog L, Malmström V. Mechanisms involved in triggering rheumatoid arthritis. Immunol Rev. 2016;269(1): 162–174. | ||
Lin J, Xiao L, Ouyang G, et al. Total glucosides of paeony inhibits Th1/Th17 cells via decreasing dendritic cells activation in rheumatoid arthritis. Cell Immunol. 2012;280(2):156–163. | ||
Li CL, He J, Li ZG, Zheng LW, Hua H. Effects of total glucosides of paeony for delaying onset of Sjogren’s syndrome: an animal study. J Craniomaxillofac Surg. 2013;41(7):610–615. | ||
Chang Y, Wei W, Zhang L, Xu HM. Effects and mechanisms of total glucosides of paeony on synoviocytes activities in rat collagen-induced arthritis. J Ethnopharmacol. 2009;121(1):43–48. | ||
Zhao M, Liang GP, Tang MN, et al. Total glucosides of paeony induces regulatory CD4(+)CD25(+) T cells by increasing Foxp3 demethylation in lupus CD4(+) T cells. Clin Immunol. 2012;143(2):180–187. | ||
Sun Y, Zhang J, Huo R, et al. Paeoniflorin inhibits skin lesions in imiquimod-induced psoriasis-like mice by downregulating inflammation. Int Immunopharmacol. 2015;24(2):392–399. | ||
Takeda S, Isono T, Wakui Y, et al. Absorption and excretion of paeoniflorin in rats. J Pharm Pharmacol. 1995;47(12A):1036–1040. | ||
Liu ZQ, Jiang ZH, Liu L, Hu M. Mechanisms responsible for poor oral bioavailability of paeoniflorin: role of intestinal disposition and interactions with sinomenine. Pharm Res. 2006;23(12):2768–2780. | ||
Lee CK, Ching CT, Sun TP, et al. Non-invasive and transdermal measurement of blood uric acid level in human by electroporation and reverse iontophoresis. Int J Nanomedicine. 2010;5:991–997. | ||
Dangol M, Yang H, Li CG, et al. Innovative polymeric system (IPS) for solvent-free lipophilic drug transdermal delivery via dissolving microneedles. J Control Release. 2016;223:118–125. | ||
Wokovich AM, Prodduturi S, Doub WH, Hussain AS, Buhse LF. Transdermal drug delivery system (TDDS) adhesion as a critical safety, efficacy and quality attribute. Eur J Pharm Biopharm. 2006; 64(1):1–8. | ||
Marzio LD, Ventura CA, Cosco D, et al. Nanotherapeutics for anti-inflammatory delivery. J Drug Deliv Sci Technol. 2016;32(Pt B):174–191. | ||
Lodzki M, Godin B, Rakou L, Mechoulam R, Gallily R, Touitou E. Cannabidiol-transdermal delivery and anti-inflammatory effect in a murine model. J Control Release. 2003;93(3):377–387. | ||
Hofkens W, Storm G, van den Berg WB, van Lent PL. Liposomal targeting of glucocorticoids to the inflamed synovium inhibits cartilage matrix destruction during murine antigen-induced arthritis. Int J Pharm. 2011;416(2):486–492. | ||
Zhang YT, Shen LN, Zhao JH, Feng NP. Evaluation of psoralen ethosomes for topical delivery in rats by using in vivo microdialysis. Int J Nanomedicine. 2014;9:669–678. | ||
Elmoslemany RM, Abdallah OY, El-Khordagui LK, Khalafallah NM. Propylene glycol liposomes as a topical delivery system for miconazole nitrate: comparison with conventional liposomes. AAPS PharmSciTech. 2012;13(2):723–731. | ||
Shen LN, Zhang YT, Wang Q, Xu L, Feng NP. Enhanced in vitro and in vivo skin deposition of apigenin delivered using ethosomes. Int J Pharm. 2014;460(1–2):280–288. | ||
Manca ML, Zaru M, Manconi M, et al. Glycerosomes: a new tool for effective dermal and transdermal drug delivery. Int J Pharm. 2013;455(1–2):66–74. | ||
Manca ML, Cencetti C, Matricardi P, et al. Glycerosomes: use of hydrogenated soy phosphatidylcholine mixture and its effect on vesicle features and diclofenac skin penetration. Int J Pharm. 2016;511(1):198–204. | ||
Williams AC, Barry BW. Penetration enhancers. Adv Drug Deliv Rev. 2012;64:128–137. | ||
Lopes LB, Garcia MT, Bentley MV. Chemical penetration enhancers. Ther Deliv. 2015;6(9):1053–1061. | ||
Yahya A, Yunus RM. Influence of sample preparation and extraction time on chemical composition of steam distillation derived patchouli oil. Procedia Eng. 2013;53:1–6. | ||
Trotta M, Peira E, Carlotti ME, Gallarate M. Deformable liposomes for dermal administration of methotrexate. Int J Pharm. 2004;270(1–2):119–125. | ||
Zhuang CY, Li N, Wang M, et al. Preparation and characterization of vinpocetine loaded nanostructured lipid carriers (NLC) for improved oral bioavailability. Int J Pharm. 2010;394(1–2):179–185. | ||
Shen LN, Zhang YT, Wang Q, Xu L, Feng NP. Preparation and evaluation of microemulsion-based transdermal delivery of total flavone of rhizoma arisaematis. Int J Nanomedicine. 2014;9:3453–3464. | ||
Zhang YT, Zhao JH, Zhang SJ, et al. Enhanced transdermal delivery of evodiamine and rutaecarpine using microemulsion. Int J Nanomedicine. 2011;6:2469–2482. | ||
Cho H, Pinkhassik E, David V, Stuart JM, Hasty KA. Detection of early cartilage damage using targeted nanosomes in a post-traumatic osteoarthritis mouse model. Nanomedicine. 2015;11(4):939–946. | ||
Jeengar MK, Shrivastava S, Mouli Veeravalli SC, Naidu VG, Sistla R. Amelioration of FCA induced arthritis on topical application of curcumin in combination with emu oil. Nutrition. 2016;32(9):955–964. | ||
Wang JX, Fan YB, Gao Y, Hu QH, Wang TC. TiO2 nanoparticles translocation and potential toxicological effect in rats after intraarticular injection. Biomaterials. 2009;30(27):4590–4600. | ||
Garrett NE, Kidd BL, Cruwys SC, Tomlinson DR. Changes in preprotachykinin mRNA expression and substance P levels in dorsal root ganglia of monoarthritic rats: comparison with changes in synovial substance P levels. Brain Res. 1995;675(1–2):203–207. | ||
Verma DD, Verma S, Blume G, Fahr A. Particle size of liposomes influences dermal delivery of substances into skin. Int J Pharm. 2003;258(1–2):141–151. | ||
Zeb A, Qureshi OS, Kim HS, Cha JH, Kim HS, Kim JK. Improved skin permeation of methotrexate via nanosized ultradeformable liposomes. Int J Nanomedicine. 2016;11:3813–3824. | ||
Pabisch S, Feichtenschlager B, Kickelbick G, Peterlik H. Effect of interparticle interactions on size determination of zirconia and silica based systems – a comparison of SAXS, DLS, BET, XRD and TEM. Chem Phys Lett. 2012;521(C):91–97. | ||
Tokudome Y, Nakamura K, Itaya Y, Hashimoto F. Enhancement of skin penetration of hydrophilic and lipophilic compounds by pH-sensitive liposomes. J Pharm Pharm Sci. 2015;18(3):249–257. | ||
Aggarwal D, Pal D, Mitra AK, Kaur IP. Study of the extent of ocular absorption of acetazolamide from a developed niosomal formulation, by microdialysis sampling of aqueous humor. Int J Pharm. 2007;338(1–2):21–26. | ||
Lira RB, Dimova R, Riske KA. Giant unilamellar vesicles formed by hybrid films of agarose and lipids display altered mechanical properties. Biophys J. 2014;107(7):1609–1619. | ||
Fang YP, Tsai YH, Wu PC, Huang YB. Comparison of 5-aminolevulinic acid-encapsulated liposome versus ethosome for skin delivery for photodynamic therapy. Int J Pharm. 2008;356(1–2):144–152. | ||
Mbah C, Builders P, Nzekwe I, Kunle O, Adikwu M, Attama A. Formulation and in vitro evaluation of pH-responsive ethosomes for vaginal delivery of metronidazole. J Drug Deliv Sci Technol. 2014;24(6):565–571. | ||
Gharib R, Greige-Gerges H, Fourmentin S, Charcosset C, Auezova L. Liposomes incorporating cyclodextrin-drug inclusion complexes: current state of knowledge. Carbohydr Polym. 2015;129:175–186. | ||
Pathak K, Sharma V, Sharma M. Optimization, in vitro cytotoxicity and penetration capability of deformable nanovesicles of paclitaxel for dermal chemotherapy in Kaposi sarcoma. Artif Cells Nanomed Biotechnol. 2016;44(7):1671–1683. | ||
Ghanbarzadeh S, Arami S. Enhanced transdermal delivery of diclofenac sodium via conventional liposomes, ethosomes, and transfersomes. Biomed Res Int. 2013;2013:616810. | ||
Dubey V, Mishra D, Nahar M, Jain V, Jain NK. Enhanced transdermal delivery of an anti-HIV agent via ethanolic liposomes. Nanomedicine. 2010;6(4):590–596. | ||
Zhang YT, Shen LN, Wu ZH, Zhao JH, Feng NP. Evaluation of skin viability effect on ethosome and liposome-mediated psoralen delivery via cell uptake. J Pharm Sci. 2014;103(10):3120–3126. | ||
Jain S, Tiwary AK, Sapra B, Jain NK. Formulation and evaluation of ethosomes for transdermal delivery of lamivudine. AAPS PharmSciTech. 2007;8(4):E111. | ||
Lane ME. Skin penetration enhancers. Int J Pharm. 2013;447(1–2):12–21. | ||
Gao HX, Lu RH, Wei XN, Wang HQ, Kong J. [Study on the constituents of Speranskia tuberculata essential oil]. Chin Tradit Herbal Drugs. 2000;31(8):574–575. Chinese [with English abstract]. | ||
Sapra B, Jain S, Tiwary AK. Percutaneous permeation enhancement by terpenes: mechanistic view. AAPS J. 2008;10(1):120–132. | ||
Shah SM, Ashtikar M, Jain AS, et al. LeciPlex, invasomes, and liposomes: a skin penetration study. Int J Pharm. 2015;490(1–2):391–403. | ||
Dragicevic-Curic N, Scheglmann D, Albrecht V, Fahr A. Development of different temoporfin-loaded invasomes-novel nanocarriers of temoporfin: characterization, stability and in vitro skin penetration studies. Colloids Surf B Biointerfaces. 2009;70(2):198–206. | ||
Lucca LG, de Matos SP, Borille BT, et al. Determination of β-caryophyllene skin permeation/retention from crude copaiba oil (Copaifera multijuga Hayne) and respective oil-based nanoemulsion using a novel HS-GC/MS method. J Pharm Biomed Anal. 2015;104:144–148. | ||
Drakulić BJ, Juranić IO, Erić S, Zloh M. Role of complexes formation between drugs and penetration enhancers in transdermal delivery. Int J Pharm. 2008;363(1–2):40–49. | ||
Kang L, Yap CW, Lim PF, et al. Formulation development of transdermal dosage forms: quantitative structure-activity relationship model for predicting activities of terpenes that enhance drug penetration through human skin. J Control Release. 2007;120(3):211–219. |
 © 2017 The Author(s). This work is published and licensed by Dove Medical Press Limited. The
full terms of this license are available at https://www.dovepress.com/terms
and incorporate the Creative Commons Attribution
- Non Commercial (unported, 3.0) License.
By accessing the work you hereby accept the Terms. Non-commercial uses of the work are permitted
without any further permission from Dove Medical Press Limited, provided the work is properly
attributed. For permission for commercial use of this work, please see paragraphs 4.2 and 5 of our Terms.
© 2017 The Author(s). This work is published and licensed by Dove Medical Press Limited. The
full terms of this license are available at https://www.dovepress.com/terms
and incorporate the Creative Commons Attribution
- Non Commercial (unported, 3.0) License.
By accessing the work you hereby accept the Terms. Non-commercial uses of the work are permitted
without any further permission from Dove Medical Press Limited, provided the work is properly
attributed. For permission for commercial use of this work, please see paragraphs 4.2 and 5 of our Terms.