Back to Journals » ClinicoEconomics and Outcomes Research » Volume 17
Enhancing Patient Safety and Charge Capture Through Smart Infusion Pump Interoperability: A Health Economic Analysis for US Health Systems
Authors Borrelli EP ![]() , Taneja A
, Taneja A ![]() , Abdallah S, Weiss M, Wilson NS, Beer I
, Abdallah S, Weiss M, Wilson NS, Beer I ![]() , Lucaci JD
, Lucaci JD ![]()
Received 24 May 2025
Accepted for publication 4 July 2025
Published 22 July 2025 Volume 2025:17 Pages 507—518
DOI https://doi.org/10.2147/CEOR.S534748
Checked for plagiarism Yes
Review by Single anonymous peer review
Peer reviewer comments 2
Editor who approved publication: Dr Xing Lin Feng
Eric P Borrelli,1 Ashley Taneja,2 Shafiq Abdallah,2 Mia Weiss,2 Nicole S Wilson,3 Idal Beer,3 Julia D Lucaci2
1Health Economics and Outcomes Research, MMS, Becton, Dickinson and Company, San Diego, CA, USA; 2HEOR Strategic Planning, Becton, Dickinson and Company, Franklin Lakes, NJ, USA; 3Medical Affairs, MMS, Becton, Dickinson and Company, San Diego, CA, USA
Correspondence: Julia D Lucaci, HEOR Strategic Planning, Becton, Dickinson and Company, 1 Becton Drive, Franklin Lakes, NJ, 07417, USA, Email [email protected]
Purpose: To estimate the economic impact of implementing smart infusion pump interoperability for a hypothetical health system in the United States (US).
Patients and Methods: An economic model was developed to assess the financial impact of implementing smart infusion pump interoperability with electronic health records (EHRs) for a health system. The model perspective was that of a moderately-large hypothetical US heath-system consisting of 6 hospitals, with 1,500 staffed beds and 50,000 discharges annually. The main outcomes of interest in this model were patient safety and outpatient intravenous (IV) administration charge capture. The impact of interoperability on patient safety was assessed by measuring the estimated reduction in preventable adverse drug events (pADEs). The impact on outpatient charge capture was assessed by estimating the reduction in lost charges due to the implementation of interoperability. All model parameters and inputs were derived and supported by peer-reviewed literature.
Results: In the base-case analysis, the implementation of smart infusion pump interoperability resulted in an annual reduction of 56 pADEs, saving the health system $531,891 in associated pADE treatment costs. This equates to a total reduction of 281 pADEs over the 5-year time-horizon, with a cumulative cost savings of $2,659,457. Additionally, the implementation of interoperability recouped $2,419,673 in outpatient infusion administration charges annually, which is equivalent to $12,098,363 in recouped charges over five years.
Conclusion: The implementation of smart infusion pump interoperability has the potential to enhance patient safety by reducing pADEs and improving outpatient administration charge capture. However, it is important to note that while the model is based on peer-reviewed model inputs, the model itself is theoretical in nature without real-world data validation and does not account for investment costs. Health systems should carefully evaluate the safety and economic implications of smart infusion pump interoperability when deciding whether to invest in this technology.
Keywords: interoperability, EHR-connectivity, charge capture, preventable adverse drug events, smart infusion pump, intravenous infusions
Introduction
Providing the highest standard of care and ensuring patient safety are top priorities for hospitals and health systems.1–3 Despite ongoing efforts to optimize care, mistakes and errors still occur, impacting patient care.3–9 Medication errors are among the most prominent and impactful types of errors occurring in hospitals and can lead to adverse drug events (ADEs), preventable ADEs (pADEs), and patient harm.5–8 An analysis of the Healthcare Cost and Utilization Project (HCUP) database by the Agency for Healthcare Research and Quality (AHRQ) found that in 2014, 2.15% of inpatient hospitalizations had an ADE originate during the stay.10 Of these events, the mean cost of stay was $28,089 (2014 US$), had a mean length of stay of 10.2 days, and an in-hospital mortality rate of 3.9%.10 These numbers are drastically higher compared to those averaged across all inpatient hospitalizations in the United States in 2014, which had a mean cost of $10,919 (2014 US$), a mean length of stay of 4.6 days, and an in-hospital mortality rate of 1.9%.11 It is important to note that not all ADEs are preventable or result from medication errors. Although patients can experience ADEs even when medications are prescribed and administered appropriately, approximately half of ADEs are preventable (also known as pADEs) and are the result of medication errors.12 The best available literature estimates that about 1 in 100 medication errors results in a pADE.6,7
Medication errors, ADEs, and pADEs are prevalent in hospitals and most commonly occur with intravenous (IV) medications.8,13,14 The rate of medication errors for intravenous (IV) infused medications reported in the literature ranges from 5% to 70% of inpatient infusions depending on setting and definition of medication error.15–21 Several factors contribute to IV infusion errors, including human factors, workflow inefficiencies, and system-level vulnerabilities.19–22 Over the past two decades, the introduction of smart infusion pumps with drug libraries and interoperability with electronic health records (EHRs) have demonstrated the ability to enhance safety initiatives and reduce medication errors.23,24 Smart infusion pumps are medical devices that deliver IV infusions using drug libraries with standardized dosing built into the device. Interoperability is the ability of the smart infusion pumps to connect with EHRs to wirelessly receive and program medication orders, instead of having to manually program them.
Interoperability has been shown to reduce the occurrence of medication administration errors.16,25–27 Specifically, interoperability mitigates the following types of medication administration errors: bypassing drug library, errors in the primary/secondary setting, guardrail limits, improper dose, omitted medications, unauthorized or undocumented medication orders, wrong concentration, wrong dose, wrong drug library, wrong duration, wrong medication, wrong patient, wrong route, wrong time, and wrong weight programmed.16,25,28,29 As a result, the 2020 Guidelines for Optimizing Safe Implementation and Use of Smart Infusion Pumps written by the Institute for Safe Medication Practices (ISMP) emphasizes the importance that interoperability has on error prevention.24 Additionally, The Joint Commission recommends that organizations with the capability should implement smart infusion pump interoperability with EHRs.30 Smart pump interoperability has also demonstrated benefits in outpatient infusion administration charge capture, and operational efficiency.31 Despite these documented advantages,16,25–27,31 adoption remains low, with only 10% to 15% of hospitals in the United States estimated to have implemented smart infusion pump interoperability in clinical practice.32–34 Some of the hesitation for the slow adoption may stem from hospitals struggling to justify the upfront costs relative to the perceived value of interoperability.
Given this slow adoption, it is important to assess the potential financial impact of interoperability, as there is often a disconnect between recognizing its clinical and operational benefits, and justifying the cost of investment. A clear gap exists in the literature as no published economic models have been developed to demonstrate the financial impact of interoperability. Therefore, the objective of this analysis was to estimate the economic impact of implementing smart infusion pump interoperability for a hypothetical health system in the United States.
Materials and Methods
Model Structure
A health economic analysis was developed to assess the financial impact of implementing smart infusion pump interoperability to EHRs for a health system. The model perspective was that of a moderately-large hypothetical United States heath-system consisting of 6 hospitals, with 1,500 staffed beds and 50,000 discharges annually (Table 1). A review of the literature was undertaken to identify the best available references to support each model input parameter. The main outcomes of interest in this model were the economic impact on patient safety and outpatient administration charge capture. This analysis consists of two different decision trees, one for each domain of the outcomes of interest: patient safety and outpatient administration charge capture.35–37 The model used a 1-year time horizon, as well as extrapolated results out to a 5-year time-horizon. The development and reporting of this economic model followed guidelines and best practices.35–40
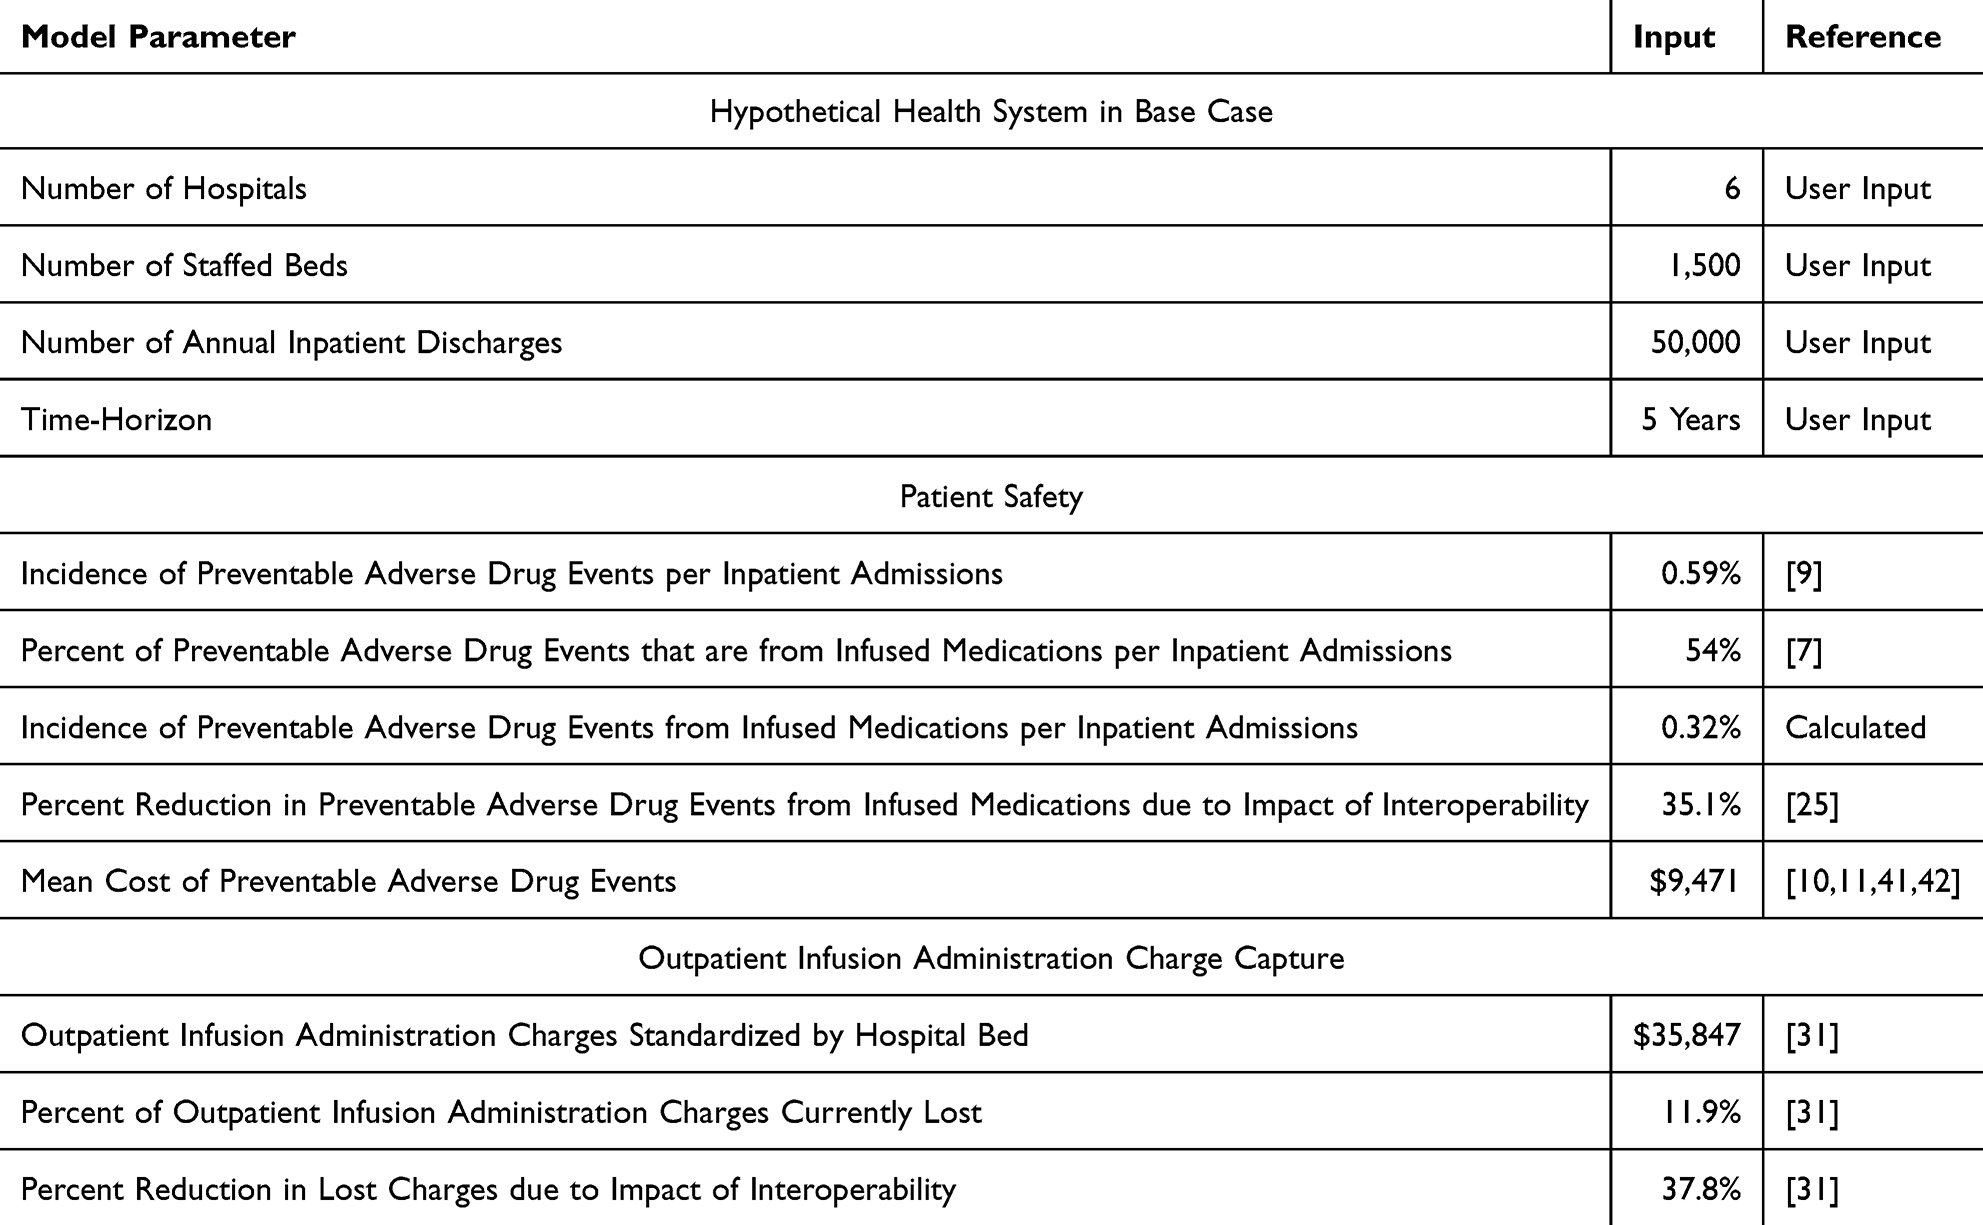 |
Table 1 Economic Model Parameters and Inputs |
Patient Safety
The impact of interoperability on patient safety was assessed by measuring the estimated reduction in pADEs (Figure 1). The baseline rate of pADEs in the model was estimated to be 0.32% of inpatient discharges based upon a pooled incidence of 0.59 pADEs per 100 inpatient admissions from a systematic literature review (SLR) of SLRs,9 and 54% of ADEs occurring from infusion medications.7 The impact of interoperability on reducing pADEs was estimated to be a 35.1% reduction, which was the midpoint of the estimated range (15.4–54.8%) of two studies from a recently published SLR assessing the impact of interoperability on reducing medication administration errors.25 Since no data is available demonstrating the impact of interoperability on pADEs specifically, we are using the reduction of medication administration errors from interoperability as a proxy for reduction in pADEs and are assuming all administration errors are equally likely to lead to a pADE. The incremental cost of pADEs was estimated at $9,471. This cost was a weighted average derived from 88% of pADEs being associated with an additional cost of care of $7,465,41 while 12% were categorized as severe,42 with an incremental cost of $24,179.10,11 The additive cost was derived from calculating the incremental difference between hospitalizations in 2014 where ADEs originated during the inpatient stay10 and the cost of all other hospitalizations in 2014.11 Costs are represented in 2024 US dollars after adjusting using the medical consumer price index (CPI).43
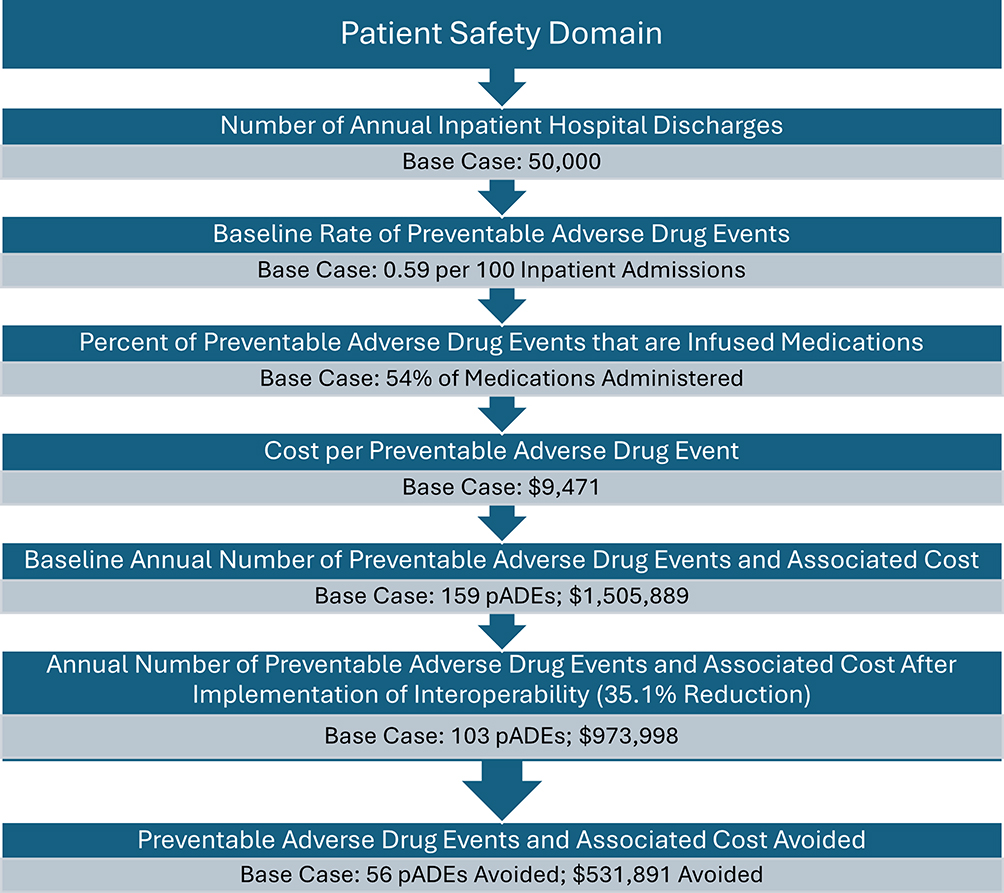 |
Figure 1 Base Case Patient Safety Domain of the Economic Model. |
Outpatient Administration Charge Capture
Interoperability was estimated to reduce the amount of lost outpatient administration current procedural terminology (CPT) charges (also known as charge capture) by 37.8% (4.5 percentage points), based upon data from an observational study by Biltoft and Finneman at a hospital in Montana (Figure 2).31 They found that at baseline before the implementation of interoperability that approximately 11.9% of outpatient infusion administration CPT charges were not being captured.31 After implementation of interoperability, the amount of outpatient infusion administration CPT charges being lost decreased to only 7.4% (a 37.8% improvement).31 For the model, the annual outpatient administration charges were derived from the same study by Biltoft and Finneman,31 and standardized to the number of beds at the hospital (n=287) in the study, using a per-bed cost of $35,847. Multiplying this value by the 1,500 beds in the hypothetical health system resulted in an annual total outpatient administration charges of $53,770,500. These charges are also represented in 2024 US dollars using the medical CPI.43
 |
Figure 2 Charge Capture Domain of the Economic Model. |
Sensitivity and Scenario Analyses
Scenario analyses were conducted for two additional scenarios attempting to model the annual and 5-year impact: a single hospital with 300 staffed beds and 4,000 annual discharges, and a health system with 10 hospitals consisting of 2,000 staffed beds and 80,000 annual discharges. One-way sensitivity analyses were performed in the base case for every model input parameter assessing the annual impact. The upper and lower bounds were informed by peer-reviewed literature where possible,9,10,25,31,41 and varied by ± 20% if there was no best-available literature-based source.35 All costs in the sensitivity analyses were adjusted to 2024 US$ using the US medical CPI where applicable.43
Results
Base-Case Analysis
In the base-case analysis, the implementation of smart infusion pump interoperability resulted in an annual reduction of 56 pADEs, saving the health system $531,891 in treating the pADEs (Table 2 and Figure 3). This equates to a total reduction of 281 pADEs over the 5-year time-horizon, with a cumulative cost savings of $2,659,457. The implementation of interoperability reduced lost outpatient infusion administration charges by $2,419,673 per year, leading to $12,098,363 in additional charges over 5 years.
 |
Table 2 Base Case Results |
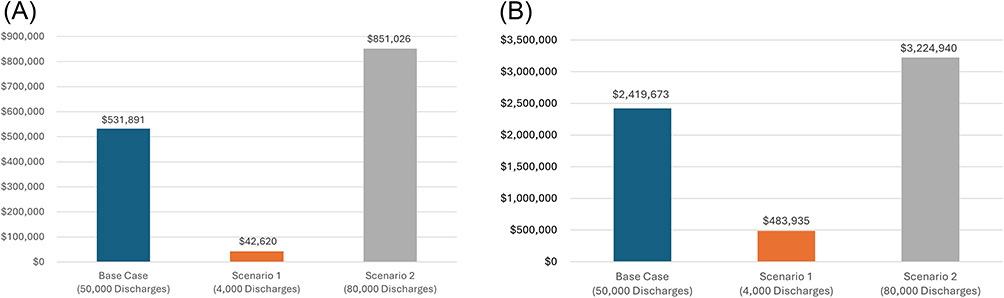 |
Figure 3 (A) Annual Cost Savings from Reducing Preventable Adverse Drug Events. (B) Annual Recouped Outpatient Infusion Administration Charges. |
Scenario Analyses
The scenario analysis of a single hospital with 300 staffed beds and 4000 annual discharges showed that interoperability implementation led to an estimated annual reduction of 4.5 pADEs, saving the hospital $42,620 (Table 3). The impact of interoperability on outpatient infusion administration charge capture resulted in a $483,935 reduction in lost charges. For the scenario analysis of the health system with 10 hospitals, consisting of 2000 staffed beds and 80,000 annual discharges, the implementation of interoperability was associated with a potential annual reduction of 90 pADEs, saving $851,026 per year. Additionally, interoperability helped recoup $3,224,940 annually in outpatient infusion administration CPT charges.
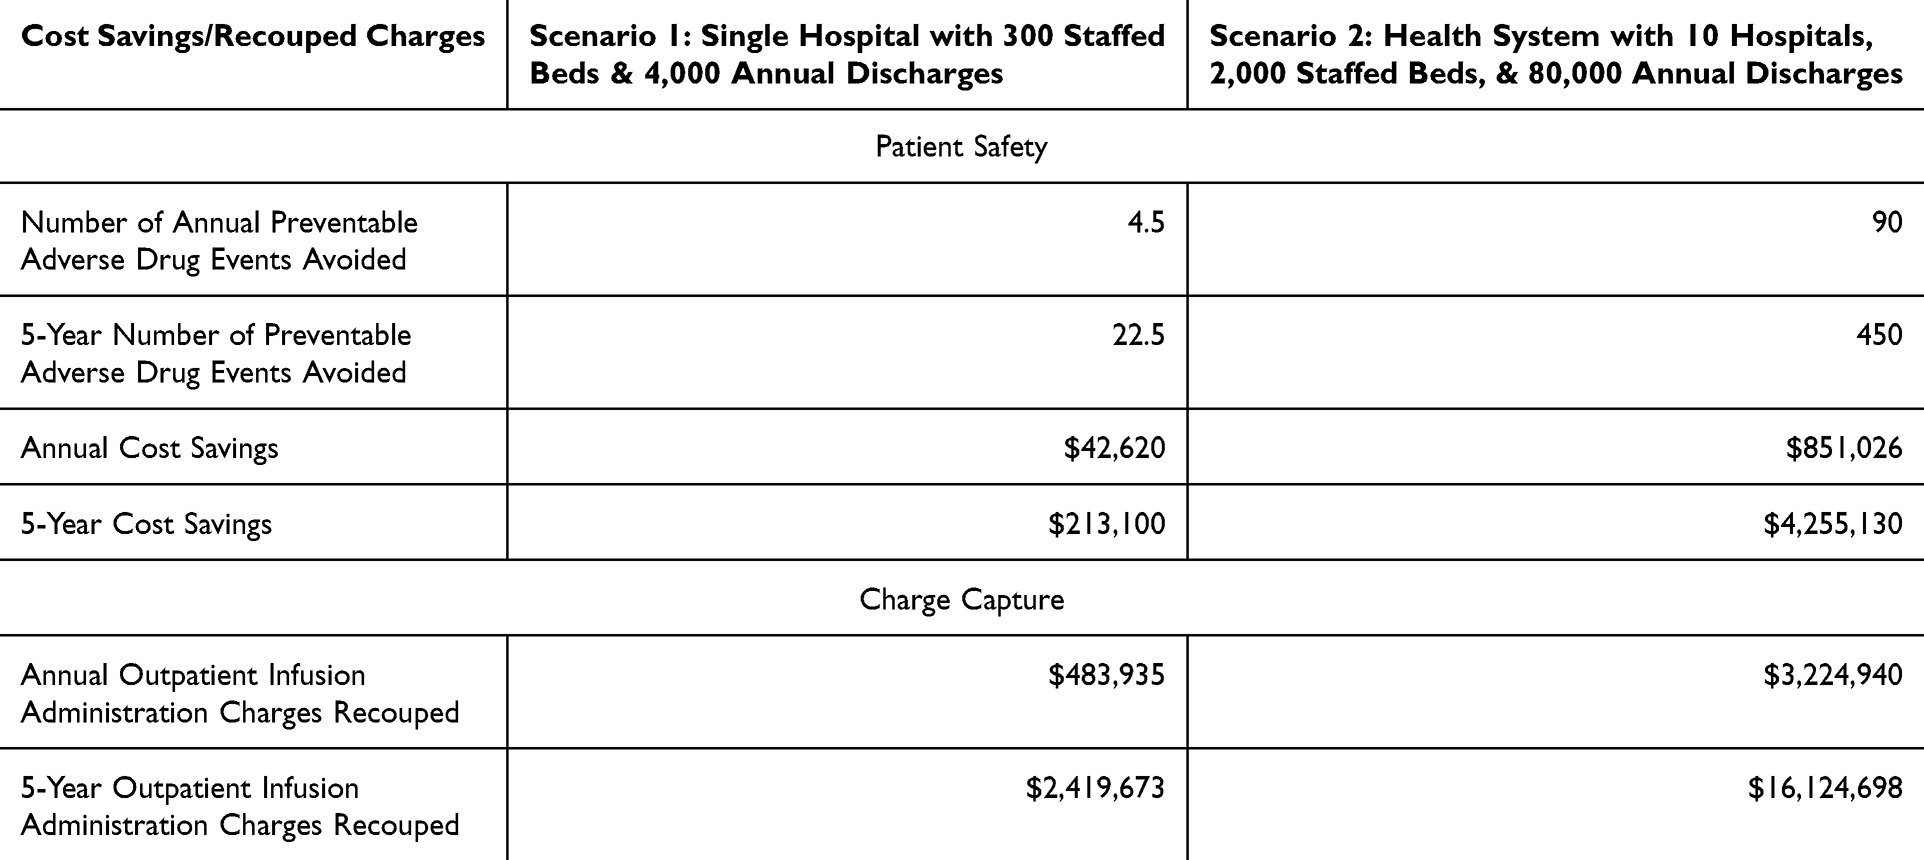 |
Table 3 Scenario Analysis Results |
Sensitivity Analyses
Sensitivity analyses showed that the most influential model input for the patient safety section was pADE incidence, which resulted in annual cost savings ranging from $421,856 to $1,929,768 (Table 4). The cost of pADEs also contributed significantly to variability, with annual cost savings ranging from $417,400 to $1,351,952. For the input of percent reduction of pADEs, the annual savings varied between $232,344 and $826,784, while for the percent of pADEs from IV medications, the estimated annual savings ranged from $423,651 to $635,477. All inputs for the outpatient charge capture showed similar sensitivity, with annual variability ranging from $1,930,899 to $1,934,964 for the lower bound inputs, and $2,902,446 to $2,906,511 for the upper bound inputs.
 |
Table 4 Sensitivity Analysis Inputs and Results |
Discussion
This economic analysis demonstrates the financial benefits of implementing smart infusion pump interoperability to EHRs in a hypothetical United States health system. The base-case analysis estimated annual cost savings of $531,891 from preventing pADEs, along with $2,419,673 recouped annually from outpatient infusion administration charges. This model provides relevant economic insights for key stakeholders in the decision-making process regarding the implementation of interoperability, while also offering important contextual considerations.
The patient safety section of this analysis suggests that interoperability has the potential to reduce the number of pADEs, thereby lowering costs associated with treating these events. However, a key caveat is that the model uses the reduction in medication administration errors as a proxy for the reduction in pADEs, assuming a proportional effect. As a result, the model also assumes that all medication administration errors are equally likely to lead to a pADE. Since no studies have specifically quantified the impact of interoperability on pADEs, this remains a limitation of our model. Nevertheless, the benefit estimates used in the model may be conservative. One of the studies included in the SLR that was used to inform this model input, showed that interoperability reduced medication administration errors that can be impacted by interoperability by 15.4% across all medications.16 However, this same study found that implementation of interoperability reduced the number of errors associated with high-risk medications by 46.9% from 12.8 errors per 100 infusions to only 6.8 errors per 100 infusions.16 Another study from the SLR used for this input found that interoperability not only reduced medication administration errors impactable by interoperability by 54.8%, but also lowered the occurrence of high-risk overrides by 85.8%- from 24.6% pre-implementation to just 3.5% post-implementation.27 Additionally, previous research has shown that medication errors lead to pADEs.5–8 Although no studies have directly measured the impact of interoperability on pADEs, based on the available data, it is reasonable to infer that interoperability would reduce pADE risk at a similar or even greater extent than the reduction in medication administration errors used in the model.
Interoperability has been shown in multiple studies to increase drug library compliance rates,16,27,44,45 which is thought to help reduce the risk of medication administration errors. A study at a 316-bed community hospital in Texas by Wei et al reported a significant increase in compliance from 73.8% pre-interoperability to 82.9% post-interoperability (p<0.001).45 Similarly, a study assessing the impact of interoperability at three hospitals in San Diego, California, found that compliance rates improved from 92% pre-implementation to 94% post-implementation, although no statistical tests were performed to evaluate the difference.16 A study at two pediatric hospitals in Louisville, Kentucky showed that interoperability increased compliance from 94% to 96.7%, although no statistical tests were performed to assess significance.27 It is important to note that the rates of compliance in real-world settings are seen to be between 74% to 80%,46 and facilities that have lower baseline rates of compliance would expect to have a larger incremental benefit of interoperability. The incremental benefit of interoperability may vary based on pre-existing compliance levels, as workflow, processes, and standard operating procedures before implementation can influence outcomes. Health systems with already high compliance and well-established best practices may experience smaller improvements post-implementation with limited additional reductions in medication errors.
One aspect not included in the economic model due to data limitation is the potential workflow and operational efficiency of interoperability.31,45,47 Studies have shown that interoperability reduces the number of manual keystrokes for nurses to prepopulate and program infusions, as well as for documentation.31,47 In an observational study at a Montana hospital, Biltoft and Finemman reported an 86% reduction in manual keystrokes, estimating that across an 8-hospital health system, this would eliminate almost 3.5 million keystrokes per month (approximately 42 million keystrokes annually).31 A separate study found consistent results that interoperability reduced 86% of keystrokes.48
Beyond keystroke reduction, the study by Biltoft and Finneman found that interoperability had additional benefits on workflow and operational efficiency.31 They showed the number of monthly infusions needing to be reprogrammed in response to a dose error reduction software (DERS) alert decreased by 19%, with reprogramming infusions dropping from 119 to 96 infusions per month post-implementation.31 For a 1,500-bed hospital system, this equates to approximately 120 fewer reprogrammed infusions monthly, or 1448 annually. The study by Wei et al also found that the number of infusions needing to be reprogrammed in response to a DERS alert decreased, although this reduction was slightly lower at 11.5%.45 The study by Biltoft and Finneman also reported a 22% reduction in pump alerts, a 20.5% decline in alert overrides, and a 33% drop in cancelled infusions due to DERS alerts.31 Additionally, the previously mentioned study by Wei et al conducted informal interviews of nurses, which suggested interoperability could save nurses approximately 10 minutes per infusion programmed due to the automation of programming and documentation,45 however this was not explicitly measured in the study and would need further validation. Based on these self-reported estimates, the authors projected savings of approximately $3 million dollars annually across the hospital,45 though this represents productivity gains rather than direct cost savings.
One important contextual consideration in the outpatient infusion administration charge capture assessment is that the outcome measures charges, not actual costs or revenue. In the United States healthcare system, charges do not accurately reflect true costs or revenue incurred. Due to variability in cost-to-charge ratios across health systems and hospitals, it is difficult to estimate the true recouped revenue for a specific institution. For this reason, the model measures charges rather than attempting to estimate net revenue. In 2021, the average cost-to-charge ratio for all inpatient hospitalizations in the US was 23.6%.11 In contrast, a 2015 analysis of California hospitals found that the cost-to-charge ratio varied by facility type, ranging from as low as 7% for services like CT scans and anesthesia to as high as 45% for blood bank services.49 Health systems utilizing this economic model can apply their specific cost-to-charge ratio for outpatient administration charges to the charges recouped in this analysis to identify what their true revenue would be.
Another consideration is that this model does not include investment costs. Since the cost of interoperability is confidential and varies by vendor, we could not incorporate investment costs into this model. Therefore, this model should not be interpreted as a true budget impact model or return-on-investment model. However, it provides valuable insights for health systems evaluating smart infusion pump interoperability. Stakeholders can input institution-specific data into the model to estimate potential cost savings from the reduction of pADEs and the increase in outpatient infusion charge capture. This enables decision-makers to compare projected cost-savings and increased revenue against the required investment to determine feasibility.
Additionally, as cost of implementation may be a factor in delaying implementation, customers can weigh what the cost of delay in implementing interoperability would be. In the base-case of the model, for every quarter (3 months) that implementation is delayed, the perspective health system is estimated to lose $132,973 in 14 pADEs prevented and $604,918 in outpatient infusion administration charges. Thus, while implementation costs must be considered, the economic benefits of interoperability should not be overlooked. The longer an organization delays adoption, the greater the potential opportunity costs, which could help support the overall financial justification for implementation.
It is important to highlight that more research is needed to truly demonstrate the impact of implementing smart infusion pump interoperability for hospitals and health systems. While all the model input parameters are supported by the best peer-reviewed literature, this paper highlights the results from an economic model and does not demonstrate financial impact from interoperability adoption in a health system. Additionally, the more research that is published in this area may help to demonstrate if there are any differences in expected results based upon the heterogeneity of health systems who adopt this technology. The more research published demonstrating the impact of smart infusion pump interoperability on clinical and financial outcomes may help relevant stakeholders decide whether it is worthwhile to pursue the adoption of this technology and potentially realize improved financial and clinical outcomes.
Limitations
This analysis has several limitations beyond those previously stated. One key limitation is the potential generalizability of the base case analysis. While the inputs used were from the best available peer-reviewed literature, no two hospitals or health systems are identical, and variations in incremental impact may arise to differences in patient populations, geographic areas, hospital/health system size, current standard operating procedures, workflows, and staff experience. While this heterogeneity poses a limitation, the sensitivity and scenario analyses help account for potential variability and sensitivity of the model results. Additionally, health systems can use the model framework but input their own institutional data into the model to estimate its applicability to their specific population and setting. Another limitation is that while this model captures two key domains (patient safety and outpatient infusion administration charge capture), additional economic benefits likely exist for the implementation of smart infusion pump interoperability but were not included in the model due to lack of data available needed to inform those domains. An additional limitation is that the health system adopting interoperability would need to have an EHR system, and one that integrates and is validated with the smart infusion pump interoperability system in order to move forward with this implementation. As of 2015, the Office of the National Coordinator for Health Information Technology (US) reported that nearly all non-federal acute care hospitals (96%) adopted a certified EHR.50 Finally, this model is specific for hospitals and health systems only in the United States, and the results of this model are not generalizable to hospitals in other countries.
Conclusion
The implementation of bidirectional smart infusion pump interoperability has the potential to enhance patient safety by reducing pADEs and improving outpatient administration charge capture. Although this study did not directly model workflow and operational efficiency, existing literature suggests that interoperability may also help reduce manual programming burden and improve clinical documentation. Further research is needed to quantify these potential benefits. Health systems should carefully evaluate the safety and economic implications of smart infusion pump interoperability when deciding whether to invest in this technology.
Abbreviations
ADE, adverse drug event; AHRQ, Agency for Healthcare Research & Quality; CPI, consumer price index; CPT, current procedural terminology; CT, computed tomography; DERS, dose error reduction software; EHR, electronic health record; HCUP, Healthcare Cost and Utilization Project; ISMP, Institute for Safe Medication Practices; IV, intravenous; pADE, preventable adverse drug event; SLR, systematic literature review.
Acknowledgments
Contents of this study were presented as a poster presentation at the International Society for Pharmacoeconomics and Outcomes Research (ISPOR) Annual Meeting; May 13-16, 2025, in Montreal, Canada.
Funding
This research did not receive any specific grant from funding agencies in the public, commercial, or not-for-profit sectors.
Disclosure
Taneja, Abdallah, Weiss, Wilson, Beer, and Lucaci are employees and/or shareholders of Becton, Dickinson and Company. Borrelli was an employee of Becton, Dickinson and Company during the study. The authors report no other conflicts of interest in this work.
References
1. Centers for Medicare & Medicaid Services. Patient safety standards. centers for medicare & medicaid services. 2024. Available from: https://www.cms.gov/medicare/quality-initiatives-patient-assessment-instruments/qualityinitiativesgeninfo/aca-mqi/patient-safety/mqi-patient-safety.
2. The Joint Commission. National patient safety goals effective january 2025 for the hospital program. The Joint Commission. 2024. Available from: https://www.jointcommission.org/-/media/tjc/documents/standards/national-patient-safety-goals/2025/hap-npsg-chapter-2025.pdf.
3. World Health Organization. Patient Safety. World Health Organization. 2023. Available from: https://www.who.int/news-room/fact-sheets/detail/patient-safety.
4. Institute of Medicine (US). Committee on Quality of Health Care in America. To Err Is Human: Building a Safer Health System. Kohn LT, Corrigan JM, Donaldson MS, editors.. Washington (DC): National Academies Press (US); 2000. PMID: 25077248
5. Bates DW, Singh H. Two decades since to err is human: an assessment of progress and emerging priorities in patient safety. Health Aff. 2018;37(11):1736–1743. doi:10.1377/hlthaff.2018.0738
6. Bates DW, Boyle DL, Vander Vliet MB, Schneider J, Leape L. Relationship between medication errors and adverse drug events. J Gen Intern Med. 1995;10(4):199–205. doi:10.1007/BF02600255
7. Kaushal R, Bates DW, Landrigan C, et al. Medication errors and adverse drug events in pediatric inpatients. JAMA. 2001;285(16):2114–2120. doi:10.1001/jama.285.16.2114
8. Fortescue EB, Kaushal R, Landrigan CP, et al. Prioritizing strategies for preventing medication errors and adverse drug events in pediatric inpatients. Pediatrics. 2003;111(4 Pt 1):722–729. doi:10.1542/peds.111.4.722
9. Wolfe D, Yazdi F, Kanji S, et al. Incidence, causes, and consequences of preventable adverse drug reactions occurring in inpatients: a systematic review of systematic reviews. PLoS One. 2018;13(10):e0205426. doi:10.1371/journal.pone.0205426
10. Weiss AJ, Freeman WJ, Heslin KC, Barrett ML. Statistical brief #234: adverse drug events in U.S. hospitals, 2010 versus 2014. Healthcare Cost and Utilization Project (HCUP), agency for healthcare research and quality (QHRQ). Available from: https://hcup-us.ahrq.gov/reports/statbriefs/sb234-Adverse-Drug-Events.pdf.
11. HCUPnet. Healthcare cost and utilization project. Agency for Healthcare Research and Quality, Rockville, MD. Available from: https://datatools.ahrq.gov/hcupnet.
12. UC Davis PSNet Editorial Team. Medication errors and adverse drug events. Agency for Healthcare Research and Quality. 2024 Available from: https://psnet.ahrq.gov/primer/medication-errors-and-adverse-drug-events.
13. Fekadu T, Teweldemedhin M, Esrael E, Asgedom SW. Prevalence of intravenous medication administration errors: a cross-sectional study. Integr Pharm Res Pract. 2017;6:47–51. doi:10.2147/IPRP.S125085
14. McLeod MC, Barber N, Franklin BD. Methodological variations and their effects on reported medication administration error rates. BMJ Qual Saf. 2013;22(4):278–289. doi:10.1136/bmjqs-2012-001330
15. Schnock KO, Dykes PC, Albert J, et al. The frequency of intravenous medication administration errors related to smart infusion pumps: a multihospital observational study. BMJ Qual Saf. 2017;26(2):131–140. doi:10.1136/bmjqs-2015-004465
16. Skog J, Rafie S, Schnock KO, Yoon C, Lipsitz S, Lew P. The impact of smart pump interoperability on errors in intravenous infusion administrations: a multihospital before and after study. J Patient Saf. 2022;18(3):e666–e671. doi:10.1097/PTS.0000000000000905
17. McDowell SE, Mt-Isa S, Ashby D, Ferner RE. Where errors occur in the preparation and administration of intravenous medicines: a systematic review and Bayesian analysis. Qual Saf Health Care. 2010;19(4):341–345. doi:10.1136/qshc.2008.029785
18. Sutherland A, Canobbio M, Clarke J, Randall M, Skelland T, Weston E. Incidence and prevalence of intravenous medication errors in the UK: a systematic review. Eur J Hosp Pharm. 2020;27(1):3–8. doi:10.1136/ejhpharm-2018-001624
19. Westbrook JI, Rob MI, Woods A, Parry D. Errors in the administration of intravenous medications in hospital and the role of correct procedures and nurse experience. BMJ Qual Saf. 2011;20(12):1027–1034. doi:10.1136/bmjqs-2011-000089
20. Westbrook JI, Woods A, Rob MI, Dunsmuir WT, Day RO. Association of interruptions with an increased risk and severity of medication administration errors. Arch Intern Med. 2010;170(8):683–690. doi:10.1001/archinternmed.2010.65
21. Park J, You SB, Ryu GW, Kim Y. Attributes of errors, facilitators, and barriers related to rate control of IV medications: a scoping review. Syst Rev. 2023;12(1):230. doi:10.1186/s13643-023-02386-z
22. Arslan S, Fidan Ö, Şanlialp Zeyrek A, Ok D. Intravenous medication errors in the emergency department, knowledge, tendency to make errors and affecting factors: an observational study. Int Emerg Nurs. 2022;63:101190. doi:10.1016/j.ienj.2022.101190
23. Antrim A. Improving patient safety with smart pump-EHR interoperability. Pharmacy Times. 2019. Available from: https://www.pharmacytimes.com/view/improving-patient-safety-with-smart-pumpehr-interoperability.
24. Institute for Safe Medication Practices (ISMP). ISMP guidelines for optimizing safe implementation and use of smart infusion pumps. Institute for Safe Medication Practices. 2020. Available from: https://home.ecri.org/blogs/ismp-resources/guidelines-for-optimizing-safe-implementation-and-use-of-smart-infusion-pumps.
25. Borrelli EP, Lucaci JD, Wilson NS, Taneja A, Weiss M, Beer I. Evaluating the impact of smart infusion pump interoperability on reducing medication administration errors: a systematic literature review. Med Devices. 2025;18:247–260. doi:10.2147/MDER.S522534
26. Chin K, Donovan J, Bingham G, Poole S, Tong E. Evaluation of smart pump interoperability with an electronic medical record system to improve infusion safety. Stud Health Technol Inform. 2024;310:1341–1342. doi:10.3233/SHTI231185
27. VanHorn T, Harris J, Mayes S, Infanti LM, Kennedy A. Evaluation of the effect of smart pump interoperability on infusion errors in the pediatric hospital setting. J Pediatr Pharmacol Ther. 2024;29(3):323–330. doi:10.5863/1551-6776-29.3.323
28. ECRI Institute. Infusion pump integration. Health Devices. 2013;42(7):210–221.
29. Kirkendall ES, Timmons K, Huth H, Walsh K, Melton K. Human-based errors involving smart infusion pumps: a catalog of error types and prevention strategies. Drug Saf. 2020;43(11):1073–1087. doi:10.1007/s40264-020-00986-5
30. The Joint Commission. Optimizing smart infusion pump safety with DERS. Sentinel Event Alert. 2021;63:1–5.
31. Biltoft J, Finneman L. Clinical and financial effects of smart pump-electronic medical record interoperability at a hospital in a regional health system. Am J Health Syst Pharm. 2018;75(14):1064–1068. doi:10.2146/ajhp161058
32. Pedersen CA, Schneider PJ, Ganio MC, Scheckelhoff DJ. ASHP national survey of pharmacy practice in hospital settings: dispensing and administration-2020. Am J Health Syst Pharm. 2021;78(12):1074–1093. doi:10.1093/ajhp/zxab120
33. Tate J, Warburton P. Smart pump/EMR interoperability 2020: first look at customer satisfaction. KLAS Research. 2020. Available from: https://klasresearch.com/report/smart-pump-emr-interoperability-2020-first-look-at-customer-satisfaction/1500.
34. Institute for Safe Medication Practices (ISMP). Smart pumps in practice: survey results reveal widespread use, but optimization is challenging. Institute Safe Med Practices. 2018;23(7):1–5.
35. Briggs AH, Weinstein MC, Fenwick EA, Karnon J, Sculpher MJ, Paltiel AD. ISPOR-SMDM modeling good research practices task force. model parameter estimation and uncertainty: a report of the ISPOR-SMDM modeling good research practices task force--6. Value Health. 2012;15(6):835–842. PMID: 22999133. doi:10.1016/j.jval.2012.04.014
36. Caro JJ, Briggs AH, Siebert U, Kuntz KM. ISPOR-SMDM modeling good research practices task force. modeling good research practices - overview: a report of the ISPOR-SMDM modeling good research practices task force-1. Value Health. 2012;15(5):796–803. doi:10.1016/j
37. Drummond MF, Sculpher MJ, Claxton K, Stoddart GL, Torrance GW. Methods for the Economic Evaluation of Health Care Programmes. Oxford university press. 2015.
38. Husereau D, Drummond M, Augustovski F, et al. Consolidated health economic evaluation reporting standards (CHEERS) 2022 explanation and elaboration: a report of the ISPOR CHEERS II good practices task force. Value Health. 2022;25(1):10–31. doi:10.1016/j.jval.2021.10.00837
39. Sullivan SD, Mauskopf JA, Augustovski F, et al. Budget impact analysis-principles of good practice: report of the ISPOR 2012 budget impact analysis good practice ii task force. Value Health. 2014;17(1):5–14. doi:10.1016/j.jval.2013.08.229133
40. McIntosh E, Clarke PM, Frew EJ, Louviere JJ. Applied Methods of Cost-Benefit Analysis in Health Care. Oxford University Press; 2010.
41. Bysshe T, Gao Y, Heaney-Huls K, et al. Estimating the additional hospital inpatient cost and mortality associated with selected hospital-acquired conditions. Agency for Healthcare Research and Quality. 2017. Available from: https://www.ahrq.gov/sites/default/files/publications2/files/hac-cost-report2017.pdf.
42. Panagioti M, Khan K, Keers RN, et al. Prevalence, severity, and nature of preventable patient harm across medical care settings: systematic review and meta-analysis. BMJ. 2019;366:l4185. doi:10.1136/bmj.l4185
43. US Inflation Calculator. Health care inflation in the United States (1948-2024). US Inflation Calculator. Available from: https://www.usinflationcalculator.com/inflation/health-care-inflation-in-the-united-states/.
44. Ubanyionwu S, Khandekar D, Mara KC, Teaford H. Enterprise standardization and convergence of large-volume infusion pump drug libraries. Am J Health Syst Pharm. 2023;80(23):1743–1751. doi:10.1093/ajhp/zxad172
45. Wei W, Coffey W, Adeola M, Abbasi G. Impact of smart pump-electronic health record interoperability on patient safety and finances at a community hospital. Am J Health Syst Pharm. 2021;zxab287. doi:10.1093/ajhp/zxab287
46. Naguib A, Beer I, Ringwala S, Wilson N, Swenson D. Evaluation of utilization patterns from over one billion infusions: retrospective study on smart pump safety and practice improvement indicators.
47. Sowan A, Ha B. Maximizing the impact of smart pump-EHR interoperability in critical care. Intensive Crit Care Nurs. 2024;85:103809. doi:10.1016/j.iccn.2024.103809
48. Joseph R, Lee SW, Anderson SV, Morrisette MJ. Impact of interoperability of smart infusion pumps and an electronic medical record in critical care. Am J Health Syst Pharm. 2020;77(15):1231–1236. doi:10.1093/ajhp/zxaa164
49. Childers CP, Dworsky JQ, Russell MM, Maggard-Gibbons M. Comparison of cost center-specific vs hospital-wide cost-to-charge ratios for operating room services at various hospital types. JAMA Surg. 2019;154(6):557–558. doi:10.1001/jamasurg.2019.0146
50. Henry JW, Pylypchuk Y, Searcy T, Patel V. Adoption of electronic health record systems among U.S. non-federal acute care hospitals: 2008-2015. ASTP Health IT Data Brief. 2016. Available from: https://www.ncbi.nlm.nih.gov/books/NBK612930/.
 © 2025 The Author(s). This work is published and licensed by Dove Medical Press Limited. The
full terms of this license are available at https://www.dovepress.com/terms
and incorporate the Creative Commons Attribution
- Non Commercial (unported, 4.0) License.
By accessing the work you hereby accept the Terms. Non-commercial uses of the work are permitted
without any further permission from Dove Medical Press Limited, provided the work is properly
attributed. For permission for commercial use of this work, please see paragraphs 4.2 and 5 of our Terms.
© 2025 The Author(s). This work is published and licensed by Dove Medical Press Limited. The
full terms of this license are available at https://www.dovepress.com/terms
and incorporate the Creative Commons Attribution
- Non Commercial (unported, 4.0) License.
By accessing the work you hereby accept the Terms. Non-commercial uses of the work are permitted
without any further permission from Dove Medical Press Limited, provided the work is properly
attributed. For permission for commercial use of this work, please see paragraphs 4.2 and 5 of our Terms.