Back to Journals » International Journal of Nanomedicine » Volume 12
Enhanced anticancer activity and oral bioavailability of ellagic acid through encapsulation in biodegradable polymeric nanoparticles
Received 30 July 2017
Accepted for publication 9 September 2017
Published 10 October 2017 Volume 2017:12 Pages 7405—7417
DOI https://doi.org/10.2147/IJN.S147740
Checked for plagiarism Yes
Review by Single anonymous peer review
Peer reviewer comments 3
Editor who approved publication: Dr Thomas Webster
Fatma M Mady,1,2 Mohamed A Shaker1,3
1Pharmaceutics and Pharmaceutical Technology Department, College of Pharmacy, Taibah University, Al Madina Al Munawara, Saudi Arabia; 2Pharmaceutics Department, Faculty of Pharmacy, Minia University, Minia, 3Pharmaceutics Department, Faculty of Pharmacy, Helwan University, Cairo, Egypt
Abstract: Despite the fact that various studies have investigated the clinical relevance of ellagic acid (EA) as a naturally existing bioactive substance in cancer therapy, little has been reported regarding the efficient strategy for improving its oral bioavailability. In this study, we report the formulation of EA-loaded nanoparticles (EA-NPs) to find a way to enhance its bioactivity as well as bioavailability after oral administration. Poly(ε-caprolactone) (PCL) was selected as the biodegradable polymer for the formulation of EA-NPs through the emulsion–diffusion–evaporation technique. The obtained NPs have been characterized by measuring particle size, zeta potential, Fourier transform infrared, differential scanning calorimetry, and X-ray diffraction. The entrapment efficiency and the release profile of EA was also determined. In vitro cellular uptake and cytotoxicity of the obtained NPs were evaluated using Caco-2 and HCT-116 cell lines, respectively. Moreover, in vivo study has been performed to measure the oral bioavailability of EA-NPs compared to free EA, using New Zealand white rabbits. NPs with distinct shape were obtained with high entrapment and loading efficiencies. Diffusion-driven release profile of EA from the prepared NPs was determined. EA-NP-treated HCT-116 cells showed relatively lower cell viability compared to free EA-treated cells. Fluorometric imaging revealed the cellular uptake and efficient localization of EA-NPs in the nuclear region of Caco-2 cells. In vivo testing revealed that the oral administration of EA-NPs produced a 3.6 times increase in the area under the curve compared to that of EA. From these results, it can be concluded that incorporation of EA into PCL as NPs enhances its oral bioavailability and activity.
Keywords: nanoparticles, ellagic acid, poly(ε-caprolactone), bioavailability, cytotoxicity, oral administration
Introduction
During the past decades, malignancy has been considered as the primary reason for death with almost the same annual rate of mortality of the diagnosed patients all over the world.1 The current possible treatments fall between one of the following categories: surgical therapy, radiotherapy, chemotherapy, hormone therapy, immunotherapy, and gene therapy.2 Even though perceptible progression with all of these categories is marked, recent investigations focus on the discovery of more anticancer drugs and biotechnology products.3 These include, but not restricted to the exploration of novel alkylating agents, antimetabolites, anti-microtubules, topoisomerase inhibitors, and cytotoxic antibiotics that are adhering with the stated goal of cancer chemotherapy.3 Although all of these lately discovered chemotherapies are recognized for the conventional treatment of cancer, they still possess many uncomfortable/intolerable life-threatening adverse effects that are associated with continuous and long-term administration.4 Hence, searching for a substitutional therapy that is clinically effective and safe enough to fulfill the chronic use in the perspective of cancer therapy is deemed necessary.
In consequence with the aforementioned challenge and with better understanding of how the malignancy occurs/grows, integration of different natural nutritional products has been explored to treat cancer through various mechanisms.5 High intake of these kinds of nutritional phytochemicals such as polyphenols is associated with achieving an antioxidant, anti-inflammatory, and anti-atherosclerotic action in addition to the important anticancer activity.6 Despite the fact that polyphenols are structurally similar, ellagic acid (EA) established a remarkable addition to the scope of cancer therapy. EA structure looks like the dimeric derivative of benzoic acid having four OH groups along with a couple of lactone rings that represent the hydrophilic portion.7,8 It is naturally available in its bound form as glycoside derivatives or as ellagitannins in the nuts (such as walnuts) and fruits (such as raspberries, strawberries, blueberries, pomegranates, and grapes).9 Many in vitro and in vivo investigations established the promising effects of EA, such as antiproliferative drug to arrest the carcinogenesis, direct killer of cancer cells (antitumorigenic), and inhibitor of angiogenesis and metastasis.10–17 Nonetheless, its therapeutic effect is associated with selective cytotoxicity to carcinoma cells with no harm to normal healthy cells.10–12
Therapeutically, EA has been proclaimed to be effective in the regression of various kinds of tumors, involving but not limited to lung cancer, colorectal carcinoma, esophageal cancer, metastatic melanoma, hepatocellular carcinoma, tongue cancer, breast cancer, bladder cancer, endometrial carcinoma, and prostate cancer.4,16,18–25 Whereas the pharmacological effect of EA has been broadly considered and permitted for the management of a vast spectrum of cancer, it still has poor aqueous solubility and poor bioavailability that offer minimal therapeutic benefit and restrict its full clinical use.26 Oral administration showed a poor absorption, metabolism in gastrointestinal tract, first-pass effect, and rapid elimination,19,27,28 which are reported as the main causes of its low bioavailability.29,30 Obviously, this poor absorption is revealed to affect its in vivo antiproliferative activity to arrest the carcinogenesis. Considering that the oral route is the most acceptable/favored route of administration, adequate levels of EA in plasma and targeted tissues will be required after its oral intake.8,28
With the purpose of finding solutions to this poor bioavailability that accompanied the oral administration of EA, we investigated the incorporation of EA into biodegradable polymeric nanoparticles (NPs) as alternate modes and strategies for oral delivery.31 We chose poly(ε-caprolactone) (PCL) as a candidate vehicle, which is one of the approved biodegradable polymers having good biocompatibility and broadly utilized for encapsulation of numerous drugs.32,33 Nano-particles are able to cross the intestinal mucosa in its intact form through intracellular endocytosis by the mucosa associated M-cells, which are distinct kind of cells present in Peyer’s patches (lymphoid cells).34 This endocytic mechanism is prompted mainly by the attraction between the NPs and cells through nonspecific hydrogen bond and Van der Waal forces of attraction.34,35 Usually, these endocytosed particles transfer through the lymphatic system to the systemic circulation.34,35 Compliance of nano-sized particles with this particular pathway enables them to improve the bioavailability, reduce the required dose, and eventually increase the efficacy of the loaded drug due to the ability of escaping the enterocytes’ degradation enzymes and the hepatic metabolism (first-pass effect).34–37
Hence, in this study, we formulated EA as polymeric NPs using PCL, with the goal of achieving better bioavailability and optimal antitumor efficacy. The prepared EA-loaded PCL NPs (EA-NPs) were characterized by measuring/determining particle size, entrapment efficiency (EE), Fourier transform infrared (FTIR), X-ray and scanning electron microscopy (SEM), and release pattern. In vitro cellular uptake and antitumor efficacy were also evaluated on human intestinal epithelial (Caco-2) and human colon adenocarcinoma (HTC-116) cell lines, respectively. In vivo pharmacokinetics was also evaluated after oral administration using New Zealand white rabbits.
Materials and methods
Materials
PCL (Mn =45,000), EA, didodecyl dimethyl ammonium bromide (DMAB), polyvinyl alcohol (PVA), polyethylene glycol 200 (PEG 200), acetonitrile, and methanol (high-performance liquid chromatography [HPLC] grade) were supplied by Sigma-Aldrich Co. (St Louis, MO, USA). Other chemicals were of reagent grade, and Millipore® deionized water (EMD-Millipore, Milli-Di purification system, Thermo Fisher Scientific, Waltham, MA, USA) (18.2 MΩ·cm) was utilized as the water vehicle throughout the experiments.
Preparation of EA-NPs
Emulsion–diffusion–evaporation method was used to prepare polymeric NPs as reported previously in the literature.26 Using 25 mL beaker, 15 mg EA was first dissolved in 200 μL of PEG 200. In another 10 mL beaker, 2.5 mL of ethyl acetate was used to dissolve 50 mg PCL with stirring. Through probe homogenizer (Ultra-Turrax, IKA®-Werke GmbH & Co. KG) at a speed of 20,000 rpm for 15 min, the polymer solution was blended with EA solution and then emulsified with 5 mL aqueous solution containing stabilizer. The resulting oil/water (O/W) emulsion was then subjected to further droplet size reduction by sonication for 1 min. Obtained emulsion was then diluted with equal volume of water and kept under stirring continuously at 1,000 rpm for 6 h for evaporating the ethyl acetate. The resulted NP suspensions were then centrifuged and washed three times repeatedly with distilled water to remove untrapped EA and freeze dried.
Size and morphology of the prepared NPs
NP diameter and the size distribution of the collected NPs were determined by the laser diffraction particle analyzer (nanotrac wave II Q; Microtrac, Krefeld, Germany). The suitable concentrations of the samples were prepared by dilution with distilled water and properly sonicated to avoid any aggregation.
The shape and surface morphology of both freshly prepared and freeze dried samples were imaged by SEM. The freshly prepared sample was first vacuum dried for 24 h after being precipitated by centrifugation. All samples were presented on the adhesive electroconductive carbon mounted on metal docks and shell glazed using Au/Pd (alloy of gold and palladium). Au/Pd was vaporized and sputtered on the surface of the sample to form a gold coat of about 10 nm in thickness. Specimens were inspected using Hitachi™ scanning electron microscope (model SU 3500; Krefeld, Germany) linked with two separate systems: the electron backscatter diffraction and energy dispersive X-ray analytical system from Tracor Northern (Tokyo, Japan). Using tungsten hairpin filament type of electron gum and the photographs of each sample were picked up digitally.
Determination of EE, drug content (DC) and NPs yield
EE and DC were directly determined by measuring EA content in the NPs obtained after it has been deconstructed and solubilized in methanol. The concentrations of EA were checked by measuring the absorbance at a wavelength of 254 nm, through Evolution 201 ultraviolet (UV)–visible spectrophotometer spectroscopy (Thermo Fisher Scientific). The EE and DC were determined through the following equations:
|
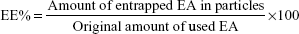
|

Characterization of the prepared EA-NPs
FTIR diagrammatic spectra for EA, PCL, and EA-NPs were obtained at room temperature using a Shimadzu IR Prestige spectrometer provided with attenuated total reflection as a separate adjunct part, through the wave number spectrum of 4,000–750 cm−1. Collected spectra were set up with scanning for 32 times by a mercury cadmium telluride detector and 4 cm−1 resolution.
The thermal profiles of the polymer, EA, and the prepared EA-NPs were investigated by differential scanning calorimetry (DSC) Q2000 provided with a liquid nitrogen cooler. The thermal scanning was performed at a 10°C/min heating rate. The measured DSC was registered in the 0°C–550°C heating range.
The X-ray crystallography of EA, PCL empty NPs, and EA-NPs was performed by Bruker D8-Advance X-ray diffractometer (Bruker Optik GmbH, Ettlingen, Germany). X-ray diffraction (XRD) patterns were conducted by Cu Kα radiation, at a voltage of 40 kV and 30 mA. The angle of scanning was adjusted from 5° to 60°, and the scanned rate was 4°/min.
In vitro drug release
Release study of EA was carried out in vitro by membrane dialysis method. A 10 mg/mL suspension of NPs was first prepared in phosphate-buffered saline (PBS) of pH =7.4. About 5 mL of the obtained suspension was placed in pre-swelled Fisher dialysis bags, 2.5 cm in width and 8 cm in length (molecular weight cutoff [MWCO] =12,000–14,000 Da). Using screw-capped glass bottles, the bags were then immersed in 30 mL of PBS and kept under 100 rpm shaking at 37°C. At predetermined time periods, the release media were totally replaced with fresh media to keep the sink condition. The absorbance of collected media was measured at 254 nm by Evolution 201 spectrophotometer (Thermo Fisher Scientific) to estimate the extent of EA released.
In vitro cellular uptake study
Cell lines
Caco-2 and HTC-116 cells were originally provided by American Type Culture Collection (ATCC, Manassas, VA, USA) and were cultured in the tissue culture laboratory of the Egyptian company for the production of vaccines, sera, and drugs (Vacsera, Giza, Egypt). In T-75 sterile tissue culture flask, Caco-2 cells were grown using Dulbecco’s Modified Eagle’s Medium (DMEM), while HTC-116 cells were incubated in Roswell Park Memorial Institute (RPMI)-1640 medium. Each of the growth media was supplemented with 10% fetal bovine serum (Thermo Fisher Scientific) and 1% antibiotic solution (mixture of 100 mg/mL penicillin and 100 U/mL streptomycin). Cells were maintained at 37°C using CO2 incubator under a mixture of air (95%) and carbon dioxide (5%). Cells were subcultured in a new growth media before reaching 70% of their confluence to maintain them in the subconfluence/exponential growth state.38
Cellular uptake
Fluorescein-labeled NPs were formulated by the association of fluorescein isocyanate (FITC) with EA in PCL. The pigment was appended to the NPs by adding 100 mg FITC to 50 mg PCL dissolved in ethyl acetate, and FITC-EA-NPs were produced using the previous step as reported earlier in the preparation of EA-NPs.35 After 24 h, the cumulative release of FITC from FITC-EA-NPs in PBS (pH =7.4) was assessed by spectrofluorometry (excitation/emission 494/512 nm) to ensure the existence of fluorescence during the experiment. Caco-2 cells were first propagated on 22 mm2 sterile cover slips in six sterile microtiter well plates at 2×10⁵ cells/well in 1,000 μL of growth medium. Plates were incubated for 24 h before running the experiment. After seeding for 24 h, cells were exposed to fluorescent NPs or free EA for further 2 h. After the period of exposure, the attached cells to cover slips were thoroughly rinsed with PBS (pH =7.4) the attached cells were thoroughly rinsed thrice with PBS (pH =7.4) then placed for 5 min with 4′,6′-diamidino-2-phenylindole dihydrochloride (DAPI), which was used as counter stain to stain the nuclei, and inspected using an epifluorescence microscope (DM 5500 B; Leica Microsystems, Wetzlar, Germany) at different magnifications.
Cytotoxicity study
The cytotoxicity of EA-NPs and EA was measured by the 3-(4,5-dimethylthiazol-2-yl)-2,5-diphenyltetrazolium bromide (MTT) assay colorimetric examination using HTC-116 cancer cells. The concentration that produced 50% growth inhibition from both EA-NPs and EA was calculated and compared. HTC-116 growing cells were seeded into 96-well microtiter plates at required densities (5,000 cells/well) in 100 μL of growth medium for 24 h for attachment. Thereafter, cells were incubated with various concentrations of EA or equivalent EA from EA-NPs suspended in PBS (5, 50, 500, 5,000 mg/L) for 3 days. Cells incubated with PBS were used as a control. Viable cells were determined by MTT assay as follows. After the 72-h incubation, the media were totally replaced with 200 μL of 5% MTT solution/well and incubated for 2 h for testing the cell viability. After the incubation, the remaining MTT supernatant was removed from the wells, and the formed formazan crystals were dissolved in every well using an acidified isopropanol (200 μL/well). Plates were then covered with aluminum foil and agitated continuously for 30 min at room temperature by a MaxQ 2000 plate shaker (Thermo Fisher Scientific). Absorbance was measured through Stat FaxR 4200 enzyme-linked immunosorbent assay (ELISA) microplate reader (Awareness Technology, Inc., Palm City, FL, USA) at 570 nm.39 Viability of cells was measured as the absorbance of exposed HTC-116 cells relative to the absorbance of control cells and showed as the percentage of control, and the half-maximal inhibitory concentration (IC50) of cell proliferation was calculated.40
In vivo pharmacokinetics after oral administration
Animals and dosing
Male New Zealand white rabbits of 2 kg weight and 8–9 weeks old were reproduced and grown at the consistent breeding conditions in the animal unit regulated by the Faculty of Medicine at Assiut University, Assiut, Egypt. During the whole study time, rabbits were kept in plastic cages provided with the regular food (Purina pellet chow) with open access to normal tape water. The whole study was conducted under the ethical standard guidelines given for animal care during research. Animal utility was ratified by the local Institutional Review Board for Preclinical and Clinical Research who warranted the protection and use of animals conformed to the EU Directive 2010/63/EU on the care of animals used for scientific objectives and Guiding Principle in Care and Use of Animals (National Institutes of Health publication #85-23, revised in 1985). All rabbits were maintained at 25°C±2°C and relative humidity of 50%±5%. The rabbits were habituated to the conditions of the housing room for 48 h before the experiment. At the experiment day, the rabbits were randomly separated into two groups with six rabbits in each group. Free EA suspension was given by mouth as a single dose of 50 mg/kg of rabbit weight to the first group while second group received an equivalent dose of EA-NPs prepared using 1% DMAB as stabilizer. The blood specimens were withdrawn from the ear vessels into the heparinized tubes. Plasma was collected through centrifuging of the blood specimens at 6,000 rpm for 4 min. The supernatants were collected and assayed for EA content.
HPLC quantification of EA
The used chromatographic system was Knauer HPLC system (Berlin, Germany), composed of K-2500 Ultraviolet spectrophotometric detector, K-500 pump, and injection inlet valve with a 20 μL loop. The data/system processing was carried out by the installed EuroChrom 2000® Knauer operating program. The used HPLC column was C18 column (Gemini RP-C18, 150×4.6 mm, 5 μm; Phenomenex, Torrance, CA, USA) and a pre-column (Waters Corp., Milford, Massachusetts, USA). The chromatography was carried out at room temperature.
EA was dissolved in methanol (100 μg/mL) and used as a stock solution. The standard EA solutions were obtained by diluting the prepared solutions using deionized water followed by spiking with blank rabbit plasma. The six calibration standards of EA in plasma (final concentrations ranged from 15 ng/mL to 1 mg/mL) were prepared independently. All of these solutions were stored in refrigerator at 4°C until used.
Procedure for plasma extraction
About 500 μL of rabbit plasma or the calibration standards was adjusted to pH =2.5 by adding 15 μL phosphoric acid solution (50% w/w) and 150 μL of KH2PO4 solution (1 M). All the specimens were vortexed for almost 1 min with 2.5 mL CH3C≡N followed by centrifugation at 6,000 rpm for 5 min. The supernatant liquor was dried by evaporation under N2. The collected powder was then dissolved in 50 μL of the mobile phase and only 20 μL of the reconstituted residue was injected into the HPLC system for the determination of EA in plasma.29 The used mobile phase made up of 3:2 v/v ratio blend of acetonitrile and 0.03 M phosphate buffer (pH =3.5), membrane filtered (0.45 mm; Phenomenex) under vacuum and degassed using an ultrasonic bath. The mobile phase was adjusted at 1 mL/min flow rate, and the used detector wave length was set at λ =270 nm. Standard solutions of EA in plasma were extracted and analyzed according to the described procedures. All of the prepared standard solutions were injected thrice, and the obtained peak areas of the corresponding EA concentrations were used to construct the standard calibration curve.
Pharmacokinetic data analysis
Following the determination of the concentration of EA in plasma, pharmacokinetics of EA in plasma was assessed by fitting the plasma concentration–time curve to the best model using the standard version 1.5 of WinNonlin™ program (Scientific Consulting, Apex, NC, USA). Linear least squares sum was used as the estimation method for data fitting measurement. Integrity of data fitting was estimated through checking the best-fitted curve and correlation coefficient (>0.95). Time needed to get the maximum concentration (Tmax) and maximum concentration (Cmax) was recorded as noticed. Absorption rate constant (Ka), absorption half-life (t1/2ka), elimination rate constant (Ke), elimination half-life (t1/2), apparent volume of distribution divided by the bioavailability fraction (Vd/F), area under the plasma EA concentration versus time curve (AUC0–t), and clearance divided by the bioavailability fraction (Cl/F) were computed in consonance with ordinary encryption algorithms.
Statistical analysis
The data statistics were performed using Graphpad Prism version 5.02 software (GraphPad Software, Inc., La Jolla, CA, USA) by two-way ANOVA test proceeded by the Bonferroni posttests. The results are presented as mean ± SD. Statistical differences were considered significant, between the groups, if the p-value was <0.05.
Results and discussion
In this study, the biodegradable polymeric NPs were formulated by emulsion preparation followed by organic solvent diffusion and slow vaporization. The principle of emulsion formation is to generate small size droplet structures. Subsequently, the diffusion and evaporation steps are for particle hardening that are obtained through both solvent/emulsion–diffusion and polymer nanoprecipitation principles. In this study, PCL was selected as the biodegradable vehicle, because it is biocompatible and undergoes degradation inside the body to produce bioresorbable monomers. In addition, PCL has longer in vivo life and slower degradation rate compared to other biodegradable polyesters making it a better candidate for long-term nano-sized delivery.
Size and morphology of the prepared NPs
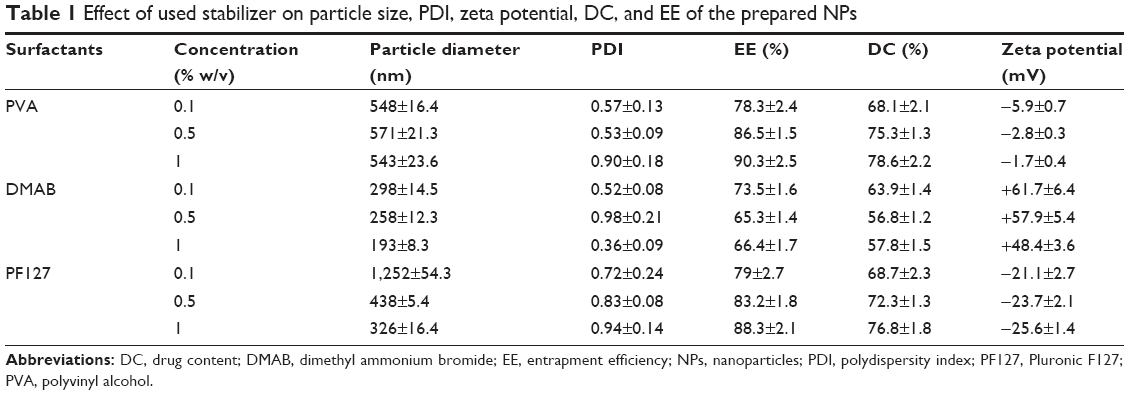
Table 1 summarizes the size of prepared NPs, polydispersity index, and measured zeta potential for the produced NPs. EA-NPs were formulated by applying various stabilizing agents (PVA, DMAB, and Pluronic F127) in different strengths (0.1%–1% w/v), keeping the other parameters constant. It is obvious from Table 1 that the type and concentration of used stabilizer affected the size of prepared particles. Among all the stabilizers, DMAB resulted in the smallest sized particles when compared to PVA and PF127, but at the same time the highest concentration (1% w/v) produced the smallest size (193 nm; Figure 1). Using 0.5% and 1% concentration of DMAB produces NPs with the average size of 258 and 298 nm, respectively. The preparation using 1% w/v PF127 produced (326 nm) larger particle size than DMAB and smaller than that using PVA (543 nm), at the same concentration. As with DMAB, decreasing the concentration of PF127 significantly increased the obtained particle size, 0.1% w/v gave particles with 1,252 nm size. Using PVA produced larger particles than DMAB without any significant effect of the concentration. Concentration of 0.1 and 0.5% w/v produced nearly the same size as that of using 1% w/v (~550 nm).
 | Table 1 Effect of used stabilizer on particle size, PDI, zeta potential, DC, and EE of the prepared NPs |
 | Figure 1 Particle size distribution as measured by laser diffraction particle analyzer of EA-NPs prepared using 1% w/v DMAB as stabilizer. |
This variation in the prepared particle size is due to the difference in the produced droplet size during emulsification step. The size of internal droplet is mainly attributed to thermodynamic stability of the formed droplet which mainly depends upon the orientation of the used surfactant. DMAB is a di-chained cationic surfactant of hydrophobic alkyl (aliphatic dodecane). During preparation, the aliphatic dodecane is more oriented towards the organic phase and the positive NH2 is located on the outer face of droplets and gives the positive electrical charge. These long hydrophobic chains provide the sufficient energy barrier to counter the configurational entropy accompanying the production of small droplets and keep the produced emulsion kinetically stable. Meanwhile, the cationic charge of the amino group dominates on the droplet surface to create an electrical double layer that provides electrostatic repulsion. On the other hand, PF127 and PVA are nonionic polymeric surfactant. During emulsification, the hydrophobic chain of PF127 and PVA (polyoxypropylene and alkyl, respectively) are oriented inside the organic phase and their hydrophilic parts (polyoxyethylene and hydroxyl segments, respectively) are present on the surface of droplets. These hydrophilic chains produce a steric repulsion which stabilizes the formed droplet. However, this relative weak repulsion is not giving the sufficient entropy which accompanied with the increase in the surface free energy of the small droplets. Meantime, the steric stability owned by PF127 and PVA is not similar to the dual (steric and electrostatic) stability produced by DMAB, and it is extremely depending on the concentration and the amount of surfactant oriented on the interface (moles per unit area). Consequently, the decrease in PF127 concentration is associated with that much increase in the particle size.
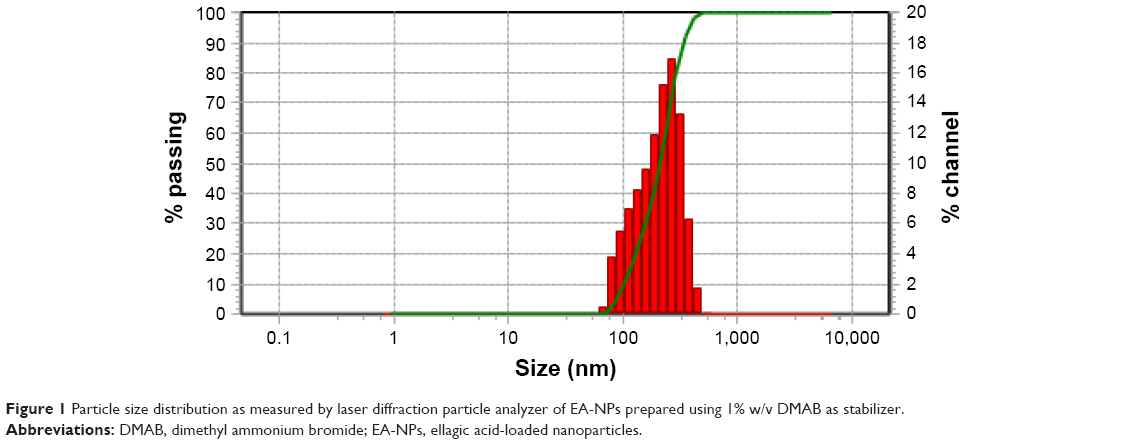
At the same time, all of the prepared NPs showed definite spherical shape particles with smooth surface. Figure 2 shows the SEM images of the freshly formulated and lyophilized EA-NPs prepared by using 1% DMAB as stabilizer. The outline image shows that the shape of EA-NPs is well-manifested spheres, and a reasonable coincidence was noticed for the average particle size as detected by Microtrac NP sizer.
 | Figure 2 SEM images of (A) freshly prepared EA-NPs and (B) lyophilized EA-NPs. |
EE and DC
Table 1 lists the calculated EE and DC for the obtained EA-NPs. It is clearly observed that the used stabilizers affected the EE and drug loading of EA. Among all the stabilizers, DMAB gives the least EE (66.4%–73.5%) and drug loading (56.8%–63.9%), whereas the highest EE (78.3%–90.3%) and drug loading (68.1%–78.6%) were observed with the EA-NPs prepared with PVA. PF127 produced lower entrapment when matched with PVA and higher as compared to DMAB. These differences in the EA entrapment were mainly associated with the increase in the aqueous solubility of EA, which is increased in the case of DMAB > PF127 > PVA. Meantime, the orientation of the DMAB’s long dodecane chains inside the internal phase of the formulated emulsion during preparation as compared with PVA’s short hydrocarbon chains, decreases the relative retaining of EA in the formed NPs.
Characterization of the prepared NPs
The EA, PCL NPs, and EA-NPs were all characterized using FTIR, to identify the encapsulation of EA in the EA-NPs. As shown in Figure 3, the EA spectrum showed its characteristic peaks as described previously.41,42 A small sharp peak at 3,580 cm−1, a large sharp peak at 3,480 cm−1, and broad absorption peak at 3,360–2,840 cm−1 were assigned to the stretching vibrations of the OH group. Broadening of this band is referred to the construction of intermolecular hydrogen bond. Absorption peaks at 2,931 and 2,850 cm−1 are due to asymmetric as well as symmetric C–H stretching vibrations for –CH3, with decrease in their intensity due to overlapping of peaks. Stretching of the carbonyl group appeared at 1,720 cm−1. The peaks observed at 1,620, 1,583, and 1,507 cm−1 are attributed to C=C–C vibrations and peaks at 1,450 and 1,375 cm−1 for C–H bending vibration, whereas 1,330, 1,270, and 1,200 cm−1 peaks are due to C–O ester linkage stretching and 1,115 and 1,050 cm−1 peaks are for aromatic C–H in-plane bending ester linkage. Peaks at 927, 874, 817, 760, and 690 cm−1 are assigned for aromatic C–H out-plane bending. Similarly, the PCL NP spectrum showed OH stretching (3,600–3,200 cm−1), C–H stretching (2,960 and 2,870 cm−1), C=0 stretching (1,725 cm−1), C–H symmetric and asymmetric deformation (1,475, 1,424, 1,400, and 1,372 cm−1), C–O stretching (1,300, 1,250, and 1,200 cm−1), C–H bending (964 and 936 cm−1), and C–C stretching (840 and 732 cm−1). EA-NP spectrum showed nearly the same peaks/bands of EA and PCL NPs without any new peaks/bands, revealing the successful encapsulation of EA inside the prepared EA-NPs without any sort of bonding or alteration of EA chemical structure.
 | Figure 3 FTIR spectrum of (A) EA, (B) poly(ε-caprolactone), and (C) prepared EA-NPs. |
DSC analysis was done to examine the physical state of EA in PCL NPs, whether it kept the crystalline state or turned to amorphous state, and also to explore the possible interaction between EA and PCL within the matrix of formulated NPs.43 Figure 4 illustrates the thermal behavior of EA-NPs compared to free EA and PCL. The obtained thermograms illustrate the crystalline nature for both PCL and EA as displayed by melting peaks at 77°C and 459°C, respectively. EA-NP thermogram also demonstrated the crystalline endothermic peaks for both PCL and EA at lower temperatures (74°C and 451°C, respectively). Meanwhile, the EA-NP thermogram also showed a tiny endothermic melting peak at 122.5°C that might be for the traces of the used stabilizer (DMAB) during the preparation. These results obviously elucidated that the entrapment of EA in NPs did not result in any sort of physical interaction between EA and PCL; nonetheless, an almost 50% and 70% decrease in the crystalline nature was recorded for PCL and EA, respectively. The decrease in crystallinity was estimated through the measured latent heat for fusion supposing relativity/symmetry of the measured enthalpy.44 Enthalpies for pure PCL (ΔH =−89.66 J/g) and EA (ΔH =−56.67 J/g) were used as references for 100% crystallinity. ΔH for the melting peaks of PCL and EA in the EA-NPs decreased to −44.19 and −17.3 J/g, respectively, which corresponded to 49% and 31% crystallinity, respectively, meaning that the preparation condition/process partially diminished the crystallinity of EA as the hydrophobic framework’s rigidity of PCL interrupted the uniformity of the EA and reduced the capability of the crystal lattice to form organized molecular order.43 Likewise, the presence of the EA inhibited the mobility of the PCL polymer chain and inhibited chain repositioning because of a decrease in crystal construction that had occurred during the formulation condition.43,44
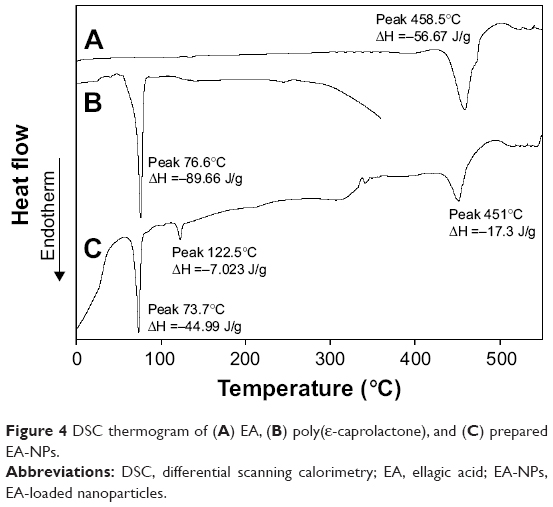 | Figure 4 DSC thermogram of (A) EA, (B) poly(ε-caprolactone), and (C) prepared EA-NPs. |
XRD spectra of PCL, EA, and EA-NPs are shown in Figure 5. The XRD pattern of PCL (Figure 5A) showed its typical crystalline pattern with sharp and intense peaks at diffraction angles (2θ) of 21.5°, 22.0°, and 23.5°. As well, EA (Figure 5B) showed its crystalline pattern with one sharp and intense peak at diffraction angle (2θ) of 27.9° and small and dull peaks at various diffraction angles (2θ). Nonetheless, most of the EA as well as PCL characteristic crystalline peaks appeared in the diffractograms of the EA-NPs but at low intensity (Figure 5C). This also proved that the crystallinity of EA and PCL decreased but still existed as most of the drug converted to an amorphous form during formulation.
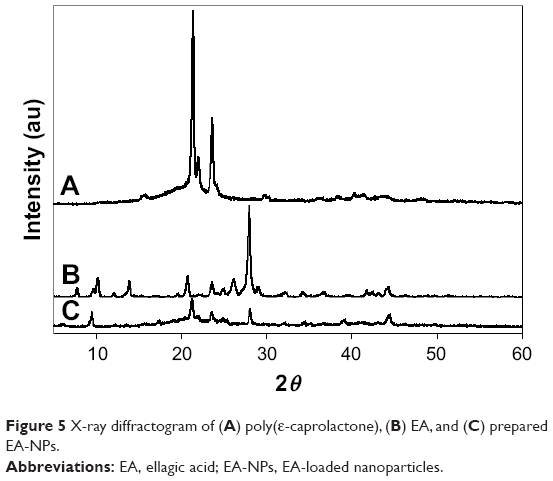 | Figure 5 X-ray diffractogram of (A) poly(ε-caprolactone), (B) EA, and (C) prepared EA-NPs. |
In vitro drug release
EA-NPs prepared by using 1% DMAB (size 193 nm), 0.5% PVA (size 571 nm), and 0.1% PF127 (size 1,252 nm) as stabilizer were subject to the in vitro release study to determine the role of hydrodynamic size of EA-NPs on the rate of EA release. Cumulative release profile of EA from the different size NPs is illustrated in Figure 6. Up to the first 12 h, all the NPs demonstrated the diffusion-driven release with a fast release followed by a linear release period with a slower rate. This initial rapid release is mainly due to the combination of diffusion mechanism of EA release from the outside layers from the NPs as well as the release of EA presented on the external surface of NPs. This rapid release was followed by slow release as the outer most layers of NPs act as a boundary layer to retard the diffusion of EA from the successional layers.
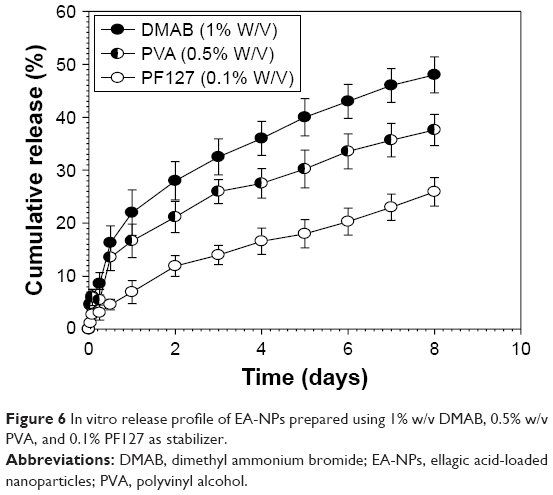 | Figure 6 In vitro release profile of EA-NPs prepared using 1% w/v DMAB, 0.5% w/v PVA, and 0.1% PF127 as stabilizer. |
Meantime, EA release data illustrated a significant dependence on EA-NPs size (Table 1). The fastest release rate was obtained from the NPs with the smallest size as a result of their largest surface area. The release of EA from the 193 nm particles reached up to 48% of the loaded amount in the first 8 days, while it reached up to 37% and 25% for the 571 and 1,252 nm particles, respectively. These expected release results manifested the adequacy to restrain EA release through controlling the particle size of the prepared NPs.
In vitro cellular uptake
This experiment was implemented mainly to examine the feasibility of EA-NPs for cellular uptake within 2 h of incubation with Caco-2 cells. The obtained fluorescence NPs showed nearly same particle size and size distribution as the corresponding EA-NPs. As illustrated in Figure 7, the florescence EA-NPs showed good nuclear co-localization. Almost 90% of fluorescein (green fluorescence) co-centralized with DAPI (blue fluorescence) suggesting fast transport and nuclear internalization of EA-NPs. The nano-sized particles showed a highly stable fluorescence intensity which may be attributed to the sustained dissolution and better chemical stability of EA in the PCL NPs containing DMAB as stabilizer.
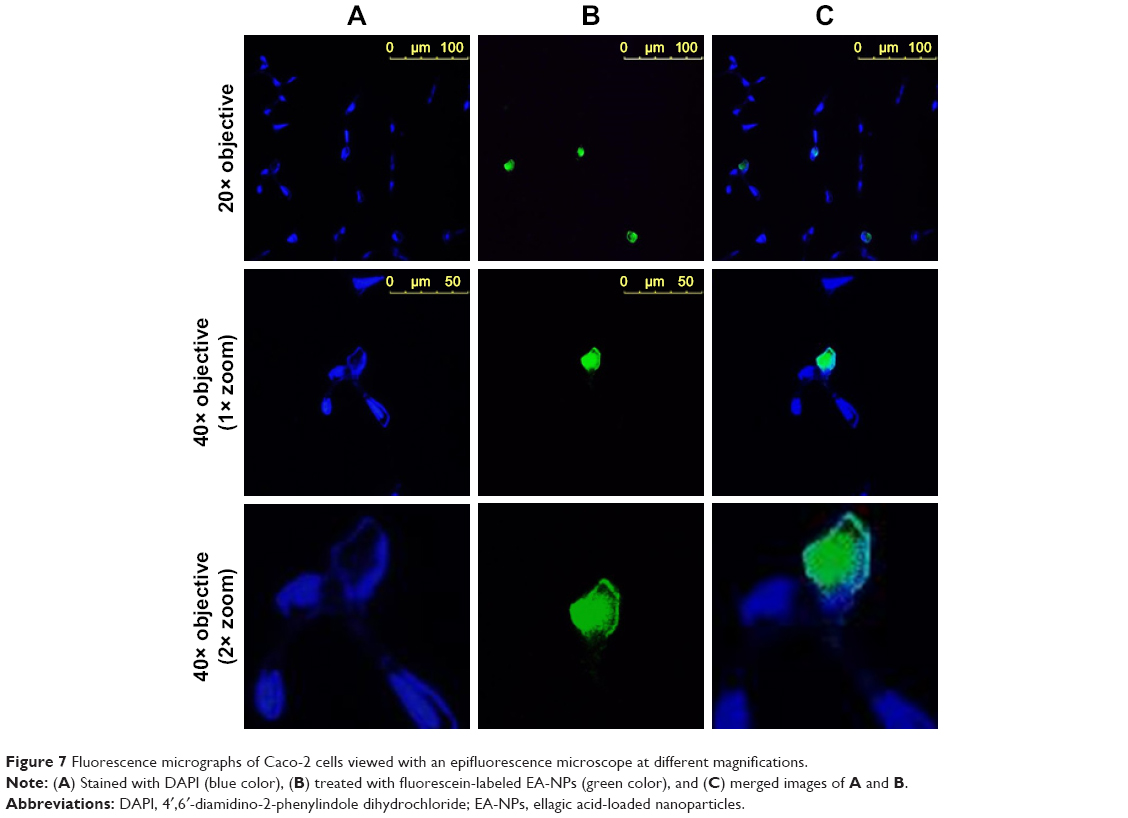 | Figure 7 Fluorescence micrographs of Caco-2 cells viewed with an epifluorescence microscope at different magnifications. |
It can be revealed that PCL NPs are capable of interacting with colorectal cancer cells, just as the typical nature of synchronization occurs between colorectal cells and nano-sized carriers. Encapsulation in PCL NPs safeguarded the entrapped EA against proteolytic degradation and permitted a selective intracellular targeting by “nanocitose” uptake mechanism which may have bypassed the discharging carrier (protein transporters) such as P-gp. EA is a substrate for the efflux transmembrane protein P-gp which properly results in decreasing its intracellular uptake in cancer cells and limiting its permeability and efficacy. The observed increase in cellular uptake of EA entrapped in EA-NPs indicated that this nanoformulation is protecting the drug, therefore camouflaging the NPs from the efflux transporters.45
Cytotoxicity study
To examine the anticancer efficacy of EA-NPs, the viability of HCT-116 cells was determined by MTT cell proliferation assay compared to free EA. Figure 8 shows the cytotoxicity profile of the cells after exposure to various amounts of EA-NPs and EA for 72 h. Cell viability showed a dependence on the incubated concentration of either EA or EA-NPs; nonetheless, cytotoxic effect of EA-NPs was higher than free EA compared to the used strengths. Meantime, plain PCL NPs did not present any cytotoxic effect at the various particle sizes and concentrations. Results revealed that 50% of the highest IC for cells to grow (IC50) values for the EA-NPs and pure EA were 0.11 and 13.2 μg/mL, respectively, meaning that EA in the PCL NP formulation was superiorly more significant in reducing the HCT-116 cell survival, meaning that EA in PCL NPs formulation was superiorly significant in reducing the HCT-116 cell survival than the free form of EA, in a concentration-related pattern. This significant increase in arresting HCT-116 cell growth is mainly attributed to interaction of nano-sized carriers with cancer cells that is generally accompanied with internalization through rapid nonspecific phagocytosis.38 In addition to the sustained influence of EA-NPs on cancer cell line after the 72-hour incubation, it is expected that only 32.5% of the encapsulated EA is released (Figure 6) and was feasible for the cells compared to 100% of free EA available within the first hour.38
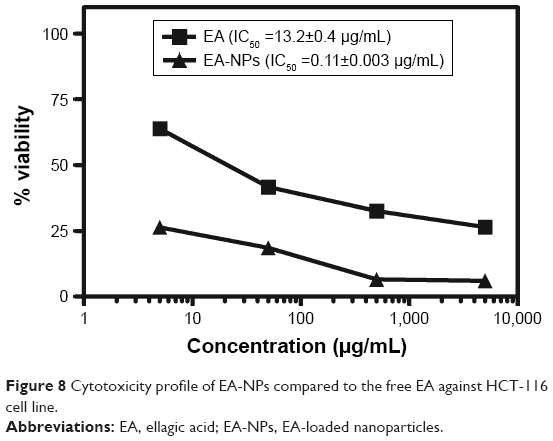 | Figure 8 Cytotoxicity profile of EA-NPs compared to the free EA against HCT-116 cell line. |
In vivo pharmacokinetics after oral administration
Plasma level–time curves of EA following a single oral dose of the reconstituted freeze-dried EA-NPs powder and free EA suspension at 50 mg/kg of rabbits are shown in Figure 9. The measurable pharmacokinetic values determined by the analysis of the collected results are summarized in Table 2. The plasma level following the oral administration of raw EA was measured only up to 12 h with a peak concentration (Cmax) of about 0.159 μg/mL at 0.65 h from the administration. As well, the determined AUC0–t and elimination t1/2 were 0.6439 μg·h/mL and 2.29 h, respectively. Nonetheless, when the same dose of EA was incorporated in PCL NPs, extended plasma level for at least 48 h was detected. The plasma concentration profile achieved by the orally administered EA-NPs appeared as two portions: the first portion depicted the phase of absorption till the attainment of Cmax (6 h) followed by second phase with a sustained plasma level for further 42 h. The EA-NPs showed the Cmax to be about 0.116 μg/mL with AUC0–t and t1/2 2.3183 μg·h/mL and 8.5 h, respectively. Comparison of the AUCs revealed that nano-sized formulation improved the relative bioavailability of EA by 3.6 times. This relative increase in bioavailability of EA-NPs was evaluated by dividing the AUC value of the freeze-dried EA-NPs by that of EA powder.
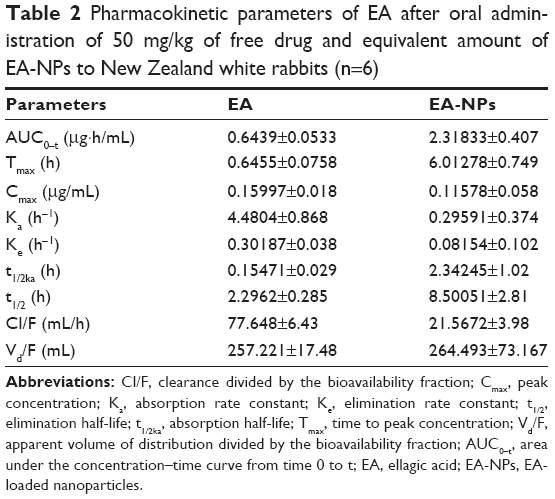 | Table 2 Pharmacokinetic parameters of EA after oral administration of 50 mg/kg of free drug and equivalent amount of EA-NPs to New Zealand white rabbits (n=6) |
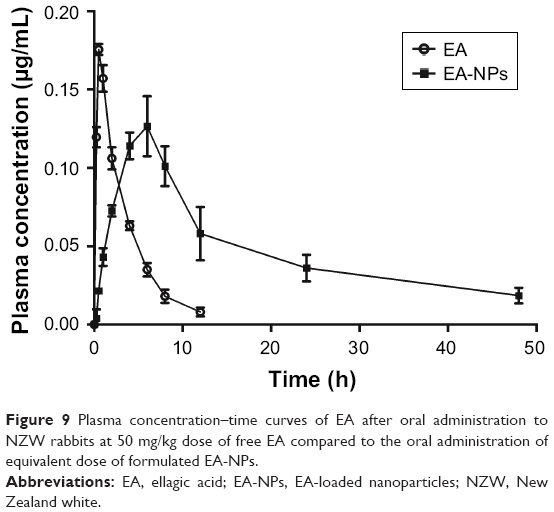 | Figure 9 Plasma concentration–time curves of EA after oral administration to NZW rabbits at 50 mg/kg dose of free EA compared to the oral administration of equivalent dose of formulated EA-NPs. |
Oral administration of EA-NPs resulted in a remarkable improvement in the bioavailability of EA when compared to the raw EA. Although, the improved bioavailability of EA was monitored with micro-crystallization by Li et al when they used anti-solvent precipitation technique by dissolving EA in N-methyl pyrrolidone followed by precipitation in deionized water.46 In this study, we have concluded that the nano-encapsulation of EA in PCL matrix led to the enhancement of its oral bioavailability. The orally administered NPs were absorbed via special mucosa-associated M-cells of the lymphoid cells located in small intestine (Peyer’s patches).34,37 The M-cells will instantly escape the drug into the lymphatics, therefore inhibiting the hepatic first-pass effect of the drug and at the same time, reducing the probabilities of hepatotoxicity induction by the drug.35,37
Conclusion
This study illustrates the relevance of EA-NPs as a formulation approach for EA that can be injected or taken orally. NPs of size 193 nm were obtained by using 1% DMAB as a stabilizer and of 90% EE by using 1% PVA as a stabilizer. At the in vitro observation level, the prepared NPs were able to sustain the diffusion release of EA and enhance the cytotoxicity of EA (6.9-fold) against the colon adenocarcinoma. At the in vivo investigation level, oral administration of EA-NPs led to a remarkable enhancement of the absorption extent of orally taken EA as compared to the free form of EA. Conclusively, nano-encapsulation of EA into the PCL would be an encouraging route to promote EA bioavailability and to improve/sustain its anticancer efficacy. As a promising point for further investigation, the clinical application of EA-NPs is extending by incorporating tumor-targeting ligands on the surface structure of the NPs. Employing this highlighted approach would increase the localized EA concentration at the tumor site after the systemic parenteral administration, which has a potential impact on implementing the full clinical relevance of EA.
Acknowledgments
This work has been financially assisted by Taibah University, Al Madinah Al Munawarah, Kingdom of Saudi Arabia (Deanship of Scientific Research, grant# 435/6214). The valuable assistance of Dr Ikramy A Khalil (Pharmaceutics Department, Assiut University) to this work is gratefully acknowledged.
Disclosure
The authors report no conflicts of interest in this work.
References
Anand P, Kunnumakkara AB, Sundaram C, et al. Cancer is a preventable disease that requires major lifestyle changes. Pharm Res. 2008;25(9):2097–2116. | ||
Avendaño C, Menéndez JC. Chapter 12 – biological therapy of cancer. In: Garcia-Echeverria C (editor). Medicinal Chemistry of Anticancer Drugs. 2nd ed. Boston, MA: Elsevier; 2015:561–593. | ||
Chu CS, Rubin SC, DiSaia PJ. 17 – Basic principles of chemotherapy A2. In: Creasman WT, Mannel RS, McMeekin DS, Mutch DG, editors. Clinical Gynecologic Oncology. 9th ed. Philadelphia, PA: Elsevier; 2018:449–469.e2. | ||
Park EK, Kim SY, Lee SB, Lee YM. Folate-conjugated methoxy poly(ethylene glycol)/poly(epsilon-caprolactone) amphiphilic block copolymeric micelles for tumor-targeted drug delivery. J Control Release. 2005;109(1–3):158–168. | ||
Amin AR, Kucuk O, Khuri FR, Shin DM. Perspectives for cancer prevention with natural compounds. J Clin Oncol. 2009;27(16):2712–2725. | ||
Jurenka JS. Therapeutic applications of pomegranate (Punica granatum L.): a review. Altern Med Rev. 2008;13(2):128–144. | ||
Amakura Y, Okada M, Tsuji S, Tonogai Y. High-performance liquid chromatographic determination with photodiode array detection of ellagic acid in fresh and processed fruits. J Chromatogr A. 2000;896(1–2):87–93. | ||
Clifford MN, Scalbert A. Ellagitannins – nature, occurrence and dietary burden. J Sci Food Agric. 2000;80:1118–1125. | ||
Kim S, Gaber MW, Zawaski JA, et al. The inhibition of glioma growth in vitro and in vivo by a chitosan/ellagic acid composite biomaterial. Biomaterials. 2009;30(27):4743–4751. | ||
Rogerio AP, Fontanari C, Borducchi E, et al. Anti-inflammatory effects of Lafoensia pacari and ellagic acid in a murine model of asthma. Eur J Pharmacol. 2008;580(1–2):262–270. | ||
Vattem DA, Shetty K. Biological functionality of ellagic acid: a review. J Food Biochem. 2005;29:234–266. | ||
Larrosa M, Tomas-Barberan FA, Espin JC. The dietary hydrolysable tannin punicalagin releases ellagic acid that induces apoptosis in human colon adenocarcinoma Caco-2 cells by using the mitochondrial pathway. J Nutr Biochem. 2006;17(9):611–625. | ||
Srivastava R, Akthar S, Sharma R, Mishra S. Identification of ellagic acid analogues as potent inhibitor of protein kinase CK2: a chemopreventive role in oral cancer. Bioinformation. 2015;11(1):21–26. | ||
Seeram NP, Adams LS, Henning SM, et al. In vitro antiproliferative, apoptotic and antioxidant activities of punicalagin, ellagic acid and a total pomegranate tannin extract are enhanced in combination with other polyphenols as found in pomegranate juice. J Nutr Biochem. 2005;16(6):360–367. | ||
Zhou E, Fu Y, Wei Z, Yang Z. Inhibition of allergic airway inflammation through the blockage of NF-kappaB activation by ellagic acid in an ovalbumin-induced mouse asthma model. Food Funct. 2014;5:2106–2112. | ||
Zhang HM, Zhao L, Li H, Xu H, Chen WW, Tao L. Research progress on the anticarcinogenic actions and mechanisms of ellagic acid. Cancer Biol Med. 2014;11(2):92–100. | ||
Falsaperla M, Morgia G, Tartarone A, Ardito R, Romano G. Support ellagic acid therapy in patients with hormone refractory prostate cancer (HRPC) on standard chemotherapy using vinorelbine and estramustine phosphate. Eur Urol. 2005;47(4):449–454. discussion 454–455. | ||
Arulmozhi V, Krishnaveni M, Karthishwaran K, Dhamodharan G, Mirunalini S. Antioxidant and antihyperlipidemic effect of Solanum nigrum fruit extract on the experimental model against chronic ethanol toxicity. Pharmacogn Mag. 2010;6(21):42–50. | ||
Boukharta M, Jalbert G, Castonguay A. Biodistribution of ellagic acid and dose-related inhibition of lung tumorigenesis in A/J mice. Nutr Cancer. 1992;18(2):181–189. | ||
Ahire V, Kumar A, Mishra KP, Kulkarni G. Ellagic acid enhances apoptotic sensitivity of breast cancer cells to gamma-radiation. Nutr Cancer. Epub 2017 Jul 18. | ||
Chen HS, Bai MH, Zhang T, Li GD, Liu M. Ellagic acid induces cell cycle arrest and apoptosis through TGF-beta/Smad3 signaling pathway in human breast cancer MCF-7 cells. Int J Oncol. 2015;46:1730–1738. | ||
Ceci C, Tentori L, Atzori MG, et al. Ellagic acid inhibits bladder cancer invasiveness and in vivo tumor growth. Nutrients. 2016;8(11):E744. | ||
Farbood Y, Sarkaki A, Dianat M, Khodadadi A, Haddad MK, Mashhadizadeh S. Ellagic acid prevents cognitive and hippocampal long-term potentiation deficits and brain inflammation in rat with traumatic brain injury. Life Sci. 2015;124:120–127. | ||
Abdelazeem KNM, Singh Y, Lang F, Salker MS. Negative effect of ellagic acid on cytosolic pH regulation and glycolytic flux in human endometrial cancer cells. Cell Physiol Biochem. 2017;41(6):2374–2382. | ||
Bravo L. Polyphenols: chemistry, dietary sources, metabolism, and nutritional significance. Nutr Rev. 1998;56(11):317–333. | ||
Bala I, Bhardwaj V, Hariharan S, Kharade SV, Roy N, Ravi Kumar MN. Sustained release nanoparticulate formulation containing antioxidant-ellagic acid as potential prophylaxis system for oral administration. J Drug Target. 2006;14(1):27–34. | ||
Cerda B, Llorach R, Ceron JJ, Espin JC, Tomas-Barberan FA. Evaluation of the bioavailability and metabolism in the rat of punicalagin, an antioxidant polyphenol from pomegranate juice. Eur J Nutr. 2003;42(1):18–28. | ||
Lei F, Xing DM, Xiang L, et al. Pharmacokinetic study of ellagic acid in rat after oral administration of pomegranate leaf extract. J Chromatogr B Analyt Technol Biomed Life Sci. 2003;796(1):189–194. | ||
Seeram NP, Lee R, Heber D. Bioavailability of ellagic acid in human plasma after consumption of ellagitannins from pomegranate (Punica granatum L.) juice. Clin Chim Acta. 2004;348(1–2):63–68. | ||
Whitley AC, Stoner GD, Darby MV, Walle T. Intestinal epithelial cell accumulation of the cancer preventive polyphenol ellagic acid – extensive binding to protein and DNA. Biochem Pharmacol. 2003;66(6):907–915. | ||
Peer D, Karp JM, Hong S, Farokhzad OC, Margalit R, Langer R. Nanocarriers as an emerging platform for cancer therapy. Nat Nanotechnol. 2007;2(12):751–760. | ||
Dubey N, Varshney R, Shukla J, et al. Synthesis and evaluation of biodegradable PCL/PEG nanoparticles for neuroendocrine tumor targeted delivery of somatostatin analog. Drug Deliv. 2012;19(3):132–142. | ||
Ma Y, Zheng Y, Zeng X, et al. Novel docetaxel-loaded nanoparticles based on PCL-Tween 80 copolymer for cancer treatment. Int J Nanomedicine. 2011;6:2679–2688. | ||
Lopes MA, Abrahim BA, Cabral LM, et al. Intestinal absorption of insulin nanoparticles: contribution of M cells. Nanomedicine. 2014;10(6):1139–1151. | ||
Florence AT. The oral absorption of micro- and nanoparticulates: neither exceptional nor unusual. Pharm Res. 1997;14(3):259–266. | ||
Clark MA, Jepson MA, Hirst BH. Exploiting M cells for drug and vaccine delivery. Adv Drug Deliv Rev. 2001;50:81–106. | ||
Brayden DJ, Jepson MA, Baird AW. Keynote review: intestinal Peyer’s patch M cells and oral vaccine targeting. Drug Discov Today. 2005;10(17):1145–1157. | ||
Shaker DS, Shaker MA, Hanafy MS. Cellular uptake, cytotoxicity and in-vivo evaluation of Tamoxifen citrate loaded niosomes. Int J Pharm. 2015;493(1–2):285–294. | ||
Twentyman PR, Luscombe M. A study of some variables in a tetrazolium dye (MTT) based assay for cell growth and chemosensitivity. Br J Cancer. 1987;56(3):279–285. | ||
Zhang Y, Zhang K, Wu Z, et al. Evaluation of transdermal salidroside delivery using niosomes via in vitro cellular uptake. Int J Pharm. 2015;478(1):138–146. | ||
Grasel Fdos S, Ferrão MF, Wolf CR. Development of methodology for identification the nature of the polyphenolic extracts by FTIR associated with multivariate analysis. Spectrochim Acta A Mol Biomol Spectrosc. 2016;153:94–101. | ||
Montes A, Wehner L, Pereyra C, Martínez de la Ossa EJ. Generation of microparticles of ellagic acid by supercritical antisolvent process. J Supercrit Fluids. 2016;116:101–110. | ||
Bruylants G, Wouters J, Michaux C. Differential scanning calorimetry in life science: thermodynamics, stability, molecular recognition and application in drug design. Curr Med Chem. 2005;12(17):2011–2020. | ||
Shaker MA, Dore JJ, Younes HM. Synthesis, characterization and cytocompatibility of a poly(diol-tricarballylate) visible light photo-cross-linked biodegradable elastomer. J Biomater Sci Polym Ed. 2010;21(4):507–528. | ||
Cavaco MC, Pereira C, Kreutzer B, et al. Evading P-glycoprotein mediated-efflux chemoresistance using solid lipid nanoparticles. Eur J Pharm Biopharm. 2017;110:76–84. | ||
Li Y, Zhao X, Zu Y, et al. Preparation and characterization of micronized ellagic acid using antisolvent precipitation for oral delivery. Int J Pharm. 2015;486(1–2):207–216. |
 © 2017 The Author(s). This work is published and licensed by Dove Medical Press Limited. The
full terms of this license are available at https://www.dovepress.com/terms
and incorporate the Creative Commons Attribution
- Non Commercial (unported, 3.0) License.
By accessing the work you hereby accept the Terms. Non-commercial uses of the work are permitted
without any further permission from Dove Medical Press Limited, provided the work is properly
attributed. For permission for commercial use of this work, please see paragraphs 4.2 and 5 of our Terms.
© 2017 The Author(s). This work is published and licensed by Dove Medical Press Limited. The
full terms of this license are available at https://www.dovepress.com/terms
and incorporate the Creative Commons Attribution
- Non Commercial (unported, 3.0) License.
By accessing the work you hereby accept the Terms. Non-commercial uses of the work are permitted
without any further permission from Dove Medical Press Limited, provided the work is properly
attributed. For permission for commercial use of this work, please see paragraphs 4.2 and 5 of our Terms.