Back to Journals » Nanotechnology, Science and Applications » Volume 8
Emerging optical nanoscopy techniques
Authors Montgomery PC, Leong-Hoi A
Received 7 February 2015
Accepted for publication 26 March 2015
Published 29 September 2015 Volume 2015:8 Pages 31—44
DOI https://doi.org/10.2147/NSA.S50042
Checked for plagiarism Yes
Review by Single anonymous peer review
Peer reviewer comments 4
Editor who approved publication: Professor Israel Rubinstein
Video abstract presented by Paul C Montgomery.
Views: 1076
Paul C Montgomery, Audrey Leong-Hoi
Laboratoire des Sciences de l'Ingénieur, de l'Informatique et de l'Imagerie (ICube), Unistra-CNRS, Strasbourg, France
Abstract: To face the challenges of modern health care, new imaging techniques with subcellular resolution or detection over wide fields are required. Far field optical nanoscopy presents many new solutions, providing high resolution or detection at high speed. We present a new classification scheme to help appreciate the growing number of optical nanoscopy techniques. We underline an important distinction between superresolution techniques that provide improved resolving power and nanodetection techniques for characterizing unresolved nanostructures. Some of the emerging techniques within these two categories are highlighted with applications in biophysics and medicine. Recent techniques employing wider angle imaging by digital holography and scattering lens microscopy allow superresolution to be achieved for subcellular and even in vivo, imaging without labeling. Nanodetection techniques are divided into four subcategories using contrast, phase, deconvolution, and nanomarkers. Contrast enhancement is illustrated by means of a polarized light-based technique and with strobed phase-contrast microscopy to reveal nanostructures. Very high sensitivity phase measurement using interference microscopy is shown to provide nanometric surface roughness measurement or to reveal internal nanometric structures. Finally, the use of nanomarkers is illustrated with stochastic fluorescence microscopy for mapping intracellular structures. We also present some of the future perspectives of optical nanoscopy.
Keywords: microscopy, imaging, superresolution, nanodetection, biophysics, medical imaging
Introduction
In the development of new solutions to the challenges faced by modern health care, there is no doubt that there is a growing need for new high performance imaging techniques. Some of the difficulties to be overcome concern not only the need for higher resolution at a cellular or subcellular level, but the problem of imaging at very large variations in scale between the basic structures to be studied and the size of the larger cells or organs within which they are situated. For example, studying the movement of molecules inside a living cell represents a scale range of over 104. Considering new biomaterials and composites for bone implants, the mineral part, hydroxyapatite (HA), consists of nanocrystallites organized in different sized structures1 together with collagen and the living cellular matrix right up to the size of the bone at a scale of many centimeters and represents a scale range of over 107. Direct unlabeled ex vivo imaging with visible light microscopy that provides at best a typical resolution of 0.2 μm over a field of 200 μm, gives a scale range of only 103.
On top of the need for large scale range other requirements can be added such as performing imaging within deep tissue in real time, in vivo and with the ability to differentiate between healthy and pathological cells.2 There is a clear need for new high-speed microscopy techniques capable of coping with such high scale ranges as well as multiparameter characterization to be able to perform what could be called intelligent nanoscopy.
The field of nanoscopy has been brought to the forefront with the recent 2014 Nobel Prize for chemistry.3 Two types of nanoscopy techniques were honored in the field of fluorescence microscopy: the use of stimulated emission depletion (STED) by Klar et al,4 a superresolution technique giving a real resolution of up to 30 nm, and single molecule microscopy by Betzig et al5 and Dickson et al6 that enables the mapping of nanostructures to within 10–20 nm. The difference between the two techniques is that in the first there is a real improvement in resolving power of the optical system7 whereas in the second the unresolved molecules are used to map to a higher resolution using “superlocalization”. We could therefore refer to two families of nanoscopy: superresolution and nanodetection.
Superresolution allows a real improvement in lateral resolution to provide details at higher resolution. Concerning nanodetection, many far field techniques exist, in which, although limited by diffraction, some aspect of a nanostructure is revealed by several different means to make it observable and measurable without necessarily resolving all the details.8 As in the case of single molecule microscopy, once it is observable it can be studied. Nanodetection is important because it means that in many cases nanostructures become visible and thus can be studied and characterized over wide fields or large volumes without actually resolving them, thus solving the scale range problem. Many of the basic principles of nanodetection by far field nanoscopy were first developed in the field of materials science. In particular, Fillard’s team at Montpellier University (France) at the end of the 1980s was one of the first to explore the notion of far field nanoscopy and several of its principles, resulting in many publications in the field of digital imaging for studying defects in semiconductors.9,10 Some of these remarkable early results were published again by Montgomery et al8 and are revisited here so as to highlight the difference between superresolution and nanodetection and to show that there is great potential for the use of each category of techniques in the life sciences.
In this review, we present a classification scheme of the many optical nanoscopy techniques that exist and highlight several of the new emerging techniques that are or will be particularly useful in biophysics and medical imaging. We illustrate two emerging techniques within the category of “superresolution”: tomographic diffractive microscopy (TDM) which gives a twofold improvement in resolution, with results on the imaging of diatoms, and scattering lens microscopy which gives a fivefold improvement in resolution and can be used in single fiber endoscopy for imaging cells. To illustrate some of the emerging techniques in the category of “nanodetection”, we present the use of surface enhanced ellipsometric contrast microscopy (SEEC) for observing slime trails of moving bacteria, strobed phase-contrast microscopy for measuring the vibration modes of 5 nm thick vesicle membranes, and 4D microscopy for measuring the nanometric change in surfaces in real time. Finally, we present the study of intracellular cytoskeleton structure in real time using quadriwave lateral shearing interferometry (QWLSI), and with nanometric resolution using dual objective 3D stochastic optical reconstruction microscopy (STORM).
Optical nanoscopy
In classical optical microscopy, the lateral resolution is limited by the effects of diffraction to a typical value of about 0.4 μm in air using visible light and 0.2 μm with an oil immersion lens in blue light. The limit can be calculated from the Rayleigh criterion, given by Rl = 0.61×λ/NA, where λ is the wavelength of the light from the sample, and NA is the numerical aperture of the imaging lens, given by NA = n×sin α. Here, n is the refractive index of the imaging medium and α is the half-angle of the light cone that can enter the objective.7 Modifying any of these three parameters leads to the so-called superresolution techniques, giving a real increase in resolving power of the imaging system that leads to finer details. Individual structures smaller than the limit in resolution of an optical system that are not resolved but visible would appear as point sources, their visibility being determined by the laws of Rayleigh scattering (see “Nanodetection and measurement using contrast” section).
Although most optical nanoscopy techniques for resolving or detecting structures smaller in size than the classical Rayleigh limit of 0.2 μm have been developed over the last two decades, some date further back and have simply benefited from modern cameras and digital processing techniques. To better apprehend the significance of emerging techniques, it is worth first considering a brief history of optical nanoscopy and then placing them in a classification scheme.
A brief history of optical nanoscopy
As mentioned, the basic principles of the three first subcategories of nanodetection were largely exploited in the work at Montpellier to develop new techniques for defect analysis in new semiconductor materials. Another way of highlighting the difference between superresolution and nanodetection is to show the limits of resolution and detection achieved over the last three decades, as illustrated in the graph in Figure 1.
 | Figure 1 Graphical representation of the recent history of nanoscopy techniques, showing the advances in lateral resolution by superresolution and detection limit in nanodetection. |
For example, using laser scanning tomography (LST), while the lateral resolution of the system remained at 4 μm, clouds of individual 10 nm-sized microprecipitates (calibrated with transmission electron microscopy) were observable in annealed GaAs, an important material at that time that contributed to the beginning of the revolution in mobile communication.11 Nanometric detection was achieved by means of a very high contrast due to the use of a light sheet illumination scheme. The LST technique was used to measure defect density and distribution and was even used at the time for sub-micrometer positioning of particles using deconvolution in a type of “superlocalization” technique,12 which is now an important tool for the nanopositioning of molecules in cells.13 By using multiple wavelengths and polarized light, LST was developed further to provide information concerning the orientation and nature of the unresolved nanoparticles.14 Similar polarization techniques have been proposed for the use of single fluorescent molecules as local field probes.15 The use of a light sheet, as in LST, has also recently led to the development of low photodamage multicolor 3D mapping, such as for observing the beating heart of a zebra fish embryo.16 Another application is the use of single molecule light sheet based fluorescence microscopy for the analysis of molecular diffusion and interactions in complex biological systems.17
High-resolution phase-contrast microscopy has been successfully used to reveal a single dislocation which is atomic in size but observable because it is extended in one dimension and is associated with a visible strain field.18 The phase-shifting techniques in interference microscopy developed by several groups toward the end of the 1980s opened up the optical measurement of nanometric surface roughness,9,19 and white light scanning interferometry (WLSI) extended this to deep surface roughness.20,21
With the subsequent development of other techniques such as SEEC and QWLSI, the important point to note is that while being diffraction limited and unable to resolve all the lateral details, the very important category of nanodetection techniques can nonetheless be used to extract many different parameters from nanostructures, such as roughness, position, size, shape, orientation, density, distribution, movement, and modification. All the advantages of classical imaging are conserved, such as the use of wide fields of hundreds of micrometers and even millimeters, large volumes, high data acquisition rates that often allows real time measurement, and the production of a large quantity of useful data. The use of an optical probe can also be noninvasive, nondestructive, and nontoxic for living organisms at low enough light intensities. It is worth underlining as well that although some techniques date back several decades (for example, Nomarski [differential interference contrast {DIC}] and phase-contrast), it is due to the use of improved light sources, detectors, and digital image processing techniques together with new imaging methods that make this new category of nanodetection techniques so useful in nanocharacterization.
In the sections that follow, we therefore present a summary of some of the emerging techniques in superresolution and nanodetection and show some of their uses for nanoimaging and characterization in biophysics and medicine.
Classification scheme for optical nanoscopy techniques
When approaching this new field of nanoscopy, it immediately becomes clear that the existence of so many different techniques can make it quite confusing for the life sciences specialist who is looking for an appropriate characterization technique for a particular problem. The classification scheme we show in Figure 2 helps to better distinguish between different categories of technique on the basis of how they work.
 | Figure 2 Classification scheme for the many different types of optical nanoscopy techniques for nanoresolution and detection. |
By using the distance at which the optical information is obtained as a criterion for differentiation, a first level of classification can be obtained between far-field and near-field imaging. The first most often uses an imaging objective, and the second, a physical probe placed in the nanometric vicinity of the surface such as with scanning near-field optical microscopy. For the far field techniques, which are the main interest of this review, a second level of classification can then be made concerning the lateral resolution or detection attained, either by superresolution or nanodetection. In the category of superresolution, the different techniques use different means for increasing the effective numerical aperture of the imaging lens. Here, we describe just two emerging techniques, TDM and scattering lens microscopy.
A third level is then presented to distinguish between the many techniques within the category of nanodetection, which can be divided into four classes according to the means used:
- Increasing the contrast by means of the illumination, the phase or the polarization.
- Measuring the phase by interferometry or wavefront sensing.
- Using deconvolution in subpixel metrology techniques.
- Using nanomarkers such as fluorophores or gold nanoparticles (AuNP).
Superresolution techniques using synthetic apertures
The most common way of improving on the classical limit of 0.4 μm in air based in visible light microscopes is to use shorter wavelength light or immersion lenses, which are now in common use and lead to a resolution of 0.2 μm. This value can be improved further by a factor of about 30% in confocal microscopy using an optimized imaging system consisting of point illumination and a pinhole in front of the detector to eliminate out-of-focus signals.22
In the field of fluorescence microscopy, several techniques for superresolution exist. The use of structured light illumination allows a resolution of better than 50 nm to be achieved for certain types of regular structures.23 Using the combination of wider and bidirectional 4π illumination with the novel technique of STED4,24 to reduce the size of the airy disc allows a resolution of 30 nm to be reached.
Some of the emerging techniques in superresolution involve increasing the synthetic aperture size to improve the resolution, with the advantage over fluorescence techniques of not requiring sample labeling, thus reducing potential damage to living cells. This can be achieved in several ways, such as with specimen rotation or angular scanning of the illumination. In this section, we present two of these techniques; TDM and scattering lens microscopy.
Tomographic diffractive microscopy
Digital holographic microscopy saves all the information about the shape of a sample, such as its surface and volume, in a hologram. However, recorded holograms contain large speckle grain size and limited spatial frequencies in the Fourier domain, which implies low lateral resolution in the reconstructed images.
By combining microholography with tomography and by varying the illumination angle to increase the synthetic aperture size, an improvement in resolution is obtained in TDM for the high-resolution imaging of transparent unlabeled specimens. For each illumination angle, the incident wave diffracted by the specimen is measured in the Fourier domain by phase-shifting interferometry. The series of recorded images at each angle is used to reconstruct a 3D representation of the object in the spatial frequency domain. The use of a simple Fourier transform then makes it possible, according to the first approximation of Born and Wolf,7 to obtain the distribution of the complex index of refraction in the specimen.
The theoretical lateral resolution of TDM in the transmission mode is about λ/(4×NA), which is twice as good as in classical holographic microscopy. An experimental value of about λ/(3.5×NA) has been achieved, resulting in a lateral resolution of 97 nm using a high numerical aperture lens (NA =1.4) and a wavelength of 475 nm.25 The results in Figure 3 show the reconstructed images of a diatom in the transmission mode using TDM in these conditions. The diatom has a width of 22 μm and a length of 40 μm, viewed from six different angles.
 | Figure 3 Diatom measured using TDM in the transmission mode, showing a lateral resolution of 100 nm. |
By reducing the wavelength even further to 405 nm, this was improved to 90 nm.26 Both results clearly show that imaging below 100 nm in a transmission nonfluorescent microscope is possible. Using TDM in the reflection mode leads to an improvement in the axial resolution from a value of 300–200 nm.27 Such techniques will find many applications for high resolution, noninvasive imaging of live cells.
Scattering lens microscopy
Another way of improving the resolution by increasing the illumination angle is by using what is coming to be known as a scattering lens. This applies, in particular, to imaging below a turbid or diffusing layer, such as cell imaging within live tissue. For a long time, light diffusion within such media has been considered as a source of noise to be removed; the effect of multiple light scattering causes distortions of the waves propagating through the media and thus degrades image quality. Recently, efforts have been made not to remove the effects of light scattering but to exploit them.28,29 This example is very similar to what happened in the early days of holography when speckles, first considered as unwanted noise, were then used to convert phase into intensity with electronic speckle pattern interferometry, opening the door to easier deformation and vibration measurement with video cameras.30
In the same way as for speckles, turbid media can be used as a means of imaging, with the additional advantage of improved resolution and field of view since light is scattered at larger angles than that collected in conventional imaging. One method of retrieving an image distorted by light diffusion is to determine the so-called transmission matrix of the system, which is equivalent to considering the turbid medium as a lens. This is performed by first illuminating the medium with a laser beam at all the required illumination angles and recording the scattered light output images for each angle. Then the sample is illuminated by the beam along the optical axis to obtain the distorted image obtained from the scattered waves. Calculating the correlation between the transmission matrix and the distorted image then leads to recovering of the undistorted image of the object. A fivefold improvement in the resolution has been demonstrated by this means.29
The scattering lens technique has been successfully applied in endoscopy to reduce the relative bulkiness of the multicore fiber that is typically used. This is achieved by combining the technique with speckle imaging in single fiber microendoscopy. The results in Figure 4 show the resulting images of a rat intestine tissue obtained with a conventional transmission microscope (Figure 4A),31 showing poor contrast and resolution. Using endoscopic imaging operating in the reflection mode through a single multimode optical fiber (without a lens or any scanning element attached to the fiber), applying the scattering lens technique leads to the improved images in Figure 4B and C. The spatial resolution of this new endoscopic imaging technique with a single multimode optical fiber is equivalent to that of incoherent imaging and is twice as better than that of coherent imaging, due to the speckle illumination.
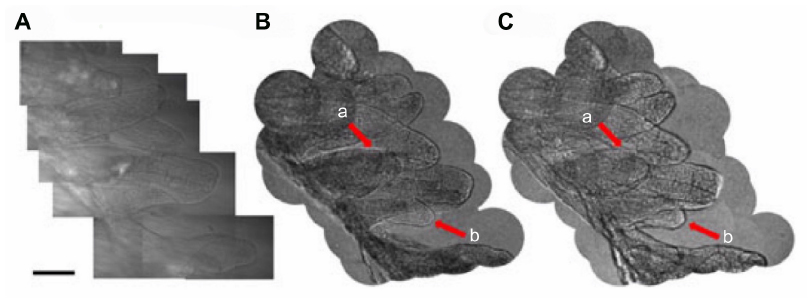 | Figure 4 Images of villi in a rat intestine tissue. |
Nanodetection techniques
Nanodetection to make nanostructures visible or make some parameter connected with them observable or measurable without necessarily resolving all the details can be achieved by increasing the contrast, measuring the phase, using deconvolution techniques, or with nanomarkers. These different methods are now illustrated.
Nanodetection and measurement using contrast
The first family of nanodetection techniques concerns those that use contrast. When the size of a structure under a conventional optical microscope is slightly smaller than the Rayleigh limit, the intensity decreases rapidly to the point of it becoming no longer visible. This can be described in terms of Rayleigh scattering, in which the object size d < < λ and the intensity of the scattered light decreases as a function of d6. But since scattering is uniform in all directions, one way of making nanostructures visible in the far field is simply to increase the contrast. The intensity scattered by the nanostructure and the intensity of the background, therefore, become important parameters and the contrast can be described either by the Weber contrast, CW, if the structures are present on a large uniform background, or the Michelson contrast, CM, if the structures have equivalent bright and dark features.8
Some of the older techniques using contrast such as dark field microscopy, LST, and Nomarski (DIC) have been described in the literature.8 Here, we describe two newer contrast-based techniques, one using polarized light and the second, strobed phase-contrast microscopy.
Surface-enhanced ellipsometric contrast microscopy
In the SEEC technique (commercially known as Sarfus® from Nanolane, Le Mans, France), a 10–100 times improvement in the contrast is achieved by reducing the background signal using an antireflection-coated substrate.32 Structures much smaller than the wavelength of the light used will modify the polarization of the reflected light and become visible in a crossed polarized light system.33 The results in Figure 5 were used in the study of bacteria (delta-proteobacterium Myxococcus xanthus) motility in water by observing the nanometer-thick extracellular matrix (slime) trails left by the moving bacteria. This was used to determine the patterns of slime secretion during different velocity phases and analyze the slime-propulsion hypothesis. The results in Figure 5A use combined images from phase-contrast microscopy to show detailed views of the bacteria and SEEC to reveal the slime trails in real time (at video rate) and without labeling. This high-sensitivity technique made it possible to elucidate, for the first time, how slime is deposited during motility and to demonstrate that slime does not mediate propulsion but more likely facilitates motility-driven attachment to the substrate.
 | Figure 5 The use of the SEEC technique for studying nanostructures. |
A second example of SEEC in Figure 5B shows the measurement of the optical thickness of a single DNA biochip spot in air, calibration revealing a real thickness of 16 Å. Amongst the many applications of SEEC in the life sciences,34–36 it has also been used in the real-time analysis of self-organized monolayers of phospholipids as they form protein microarrays of PLL-g-PEG biotin and in specific antibody recognition.37 The interest in the technique is its ability to perform unlabeled imaging in real time with nanometer sensitivity for nanolayers and nanoparticles and the possibility of calibrating the z-axis to provide surface roughness and layer thickness measurements.
Strobed phase-contrast microscopy
The use of phase-contrast microscopy for nanodetection and characterization depends very much on the particular conditions of the sample under study, in terms of the difference between the refractive index of the structure to be visualized and that of the background, and the extent of the structure across the field. In the case of the study of the slime trails of moving bacteria in the “Surface-enhanced ellipsometric contrast microscopy” section, the difference in the refractive index between the slime and the surrounding water was not high enough to produce any contrast and required the additional use of the SEEC technique. But, given the right conditions, previous results have demonstrated the possibility of even imaging atomic-sized structures, such as dislocations in semiconductor crystals when extended in one of the imaging dimensions and associated with a sufficient variation in refractive index of the strain field.10,18
In the field of biology, strobed phase-contrast microscopy has been used recently to characterize the bending elasticity of lipid membranes through the study of thermal shape fluctuations of giant, (10 μm radius) nearly spherical vesicles.38 Although the thickness of the membranes is less than 5 nm, the edge of the sphere becomes clearly visible in phase-contrast microscopy since its refractive index is about 10% higher than that of the aqueous surroundings. The addition of the many different vibration modes results in thermal fluctuations being very complex, requiring the use of stroboscopic illumination with a xenon flashlamp to freeze the movement and avoid blurring. To reduce the uncertainty in the measurement of the bending modulus due to various artifacts, more sophisticated measurement procedures are necessary. One way of doing this is to use selection criteria on the series of images of moving vesicles to reject certain images when they do not satisfy the requirements of the applied theory (Figure 6).39 Such a procedure has been successfully used to measure the bending moments of 1-stearoyl-2-oleoyl-sn-glycero-3-phosphocholine lipid membranes, as well as to estimate the friction between the monolayers comprising the bilayer. These studies are important to help understand complex cell functions, the role of vesicle formation and transport, and the development of synthetic cells.
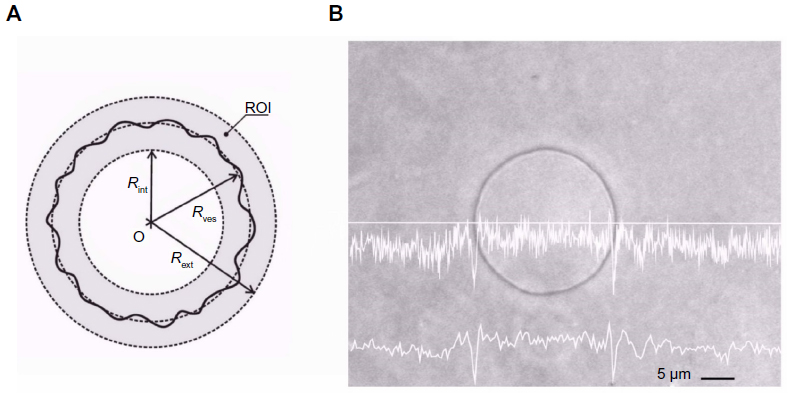 | Figure 6 Measurement of dynamic thermal shape fluctuations of a giant vesicle using strobed phase-contrast microscopy. |
Nanodetection and measurement using phase
Instead of using the phase of the light just for improving the contrast as in the previous technique, by using interferometry or wavefront sensing it is possible to measure the phase, and so access useful information of nanostructures such as cell roughness, adhesion, and internal structures.
Interference microscopy
By using interferometry, in which the wavefront of the light coming from the sample to be measured is compared with that from a flat reference surface, the phase of the light can be converted into intensity and can be calibrated to give high resolution maps of surface roughness and layer thickness. For example, when observing a live cell through a glass substrate, interference fringes are produced between the light reflected from the substrate surface and from the cell membrane. Quantifying these fringes enables the distance to be measured between the membrane and the substrate surface, which is useful in adhesion studies. Because of the very high sensitivity of the “fluctuation contrast” technique in interference reflection microscopy, even nanometer variations due to bunches of ligand-receptor links within the substratum can be detected and studied.40
Direct phase measurement using monochromatic phase-stepping microscopy (PSM) with a dedicated interference objective is a technique known in materials science from the end of the 1980s for sub-nanometer resolution surface-roughness measurement for low roughness below about 300 nm. WLSI, now known as coherence scanning interferometry (CSI), uses the short packet of white light fringes along the optical axis as a probe to measure the height of much rougher surfaces with a typical axial sensitivity of 10–15 nm. PSM and CSI are now emerging as useful tools in biological and medical applications.
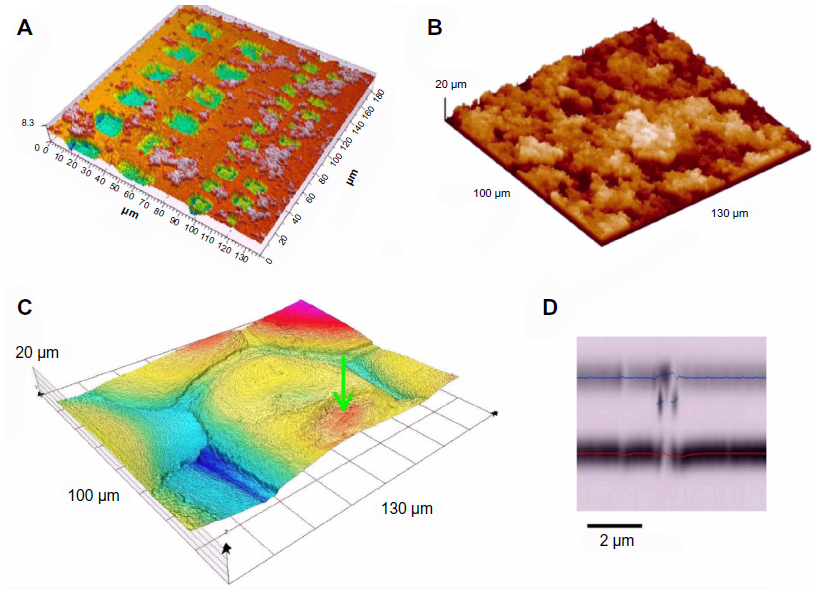
The results in Figure 7 show some of these new applications. In the development of new biomaterials such as composites of HA and nanodiamonds, the technique is well adapted for the determination of quantified roughness that is otherwise very difficult to measure because of its spongy aspect (Figure 7A and B).1
 | Figure 7 Nanometric 3D surface characterization using CSI. |
Although PSM and CSI have become mature techniques in materials science, there is still a need to improve calibration and measurement uncertainty. This can be achieved by using certified height standards to check measurements, or by comparing results using different techniques on the same sample,41 or even better, in the same place. In practice, this is quite difficult to achieve since measuring at a nanoscale presents problems when moving the sample between different microscopes. The results in Figure 7A are taken from a series of measurements of HA deposited on a silicon substrate having a series of numbered etched squares that enable exactly the same place to be found. Using this grid, it was possible to compare measurements from the same place made with scanning electron microscopy and two different microscopes using CSI, one commercial (Zygo NewView 7200, Zygo, Middlefield, CT, USA) and one home built (based on a modified Leitz-Linnik microscope). The results demonstrated that it was possible to measure heights to within 20–40 nm on the smooth Si substrate using different techniques, and to within about 130 nm for the rough HA layer on Si for depths between 2.5 and 3.3 μm. The increase in uncertainty is due to the large lateral variation in roughness.42 Such a study contributes to a better understanding of the performance of each measurement system in terms of artifact generation and interaction between the optical probe and the material.
The results in Figure 7C are part of a series of measurements of the external 3D structure of plant cells (Allium cepa [onion]) before and after dehydration.8 The interesting aspect of these results is that the nanometer axial resolution over deep structures and wide fields reveals clearly some of the detail of the cell nucleus through the membrane (marked by green arrow). CSI has also been used to make quantitative measurements of the optical properties of live NIH 3T3 mouse fibroblast cells, revealing intracellular organelles.43
Being based on an optical probe, CSI can also be used for optical tomography, to obtain slices and volumes of transparent or semitransparent layers. Optical coherence tomography (OCT) has become well known in the study of the retina in vivo, using a scanned spot and a fiber based system. The full-field or FF-OCT version is a promising technique for deep tissue imaging.2,44,45 Two challenges in live tissue imaging are the need to improve resolution, which is between 2 and 5 μm and to perform the measurement in real time to make in vivo measurements possible. Work is under way to develop new techniques and algorithms. The results in Figure 7D show a high resolution image of defects in a 3 μm thick layer of polymer. Moving to real time by continuous fringe scanning and high speed image processing is possible using dedicated camera sensors with integrated electronic processing connected to each pixel46 but at the expense of image quality and axial resolution. Real-time measurement and high image quality can be achieved using a high-speed CMOS camera and processing in 4D microscopy, giving up to 25 3D surface images per second and 90 nm uncertainty along the optical axis.47,48 This opens up new applications in the measurement of moving or changing surfaces, such as cell mobility, cell growth, or cell reaction to external stimulations from chemicals or drugs.
Quadriwave lateral shearing interferometry
Phase measurement can also be performed using QWLSI, which has the particularity of requiring only a single image per measurement, making real-time measurement possible. The method is based on the use of a high-resolution 2D hole-grating wavefront sensor (modified Hartman mask) in front of the CCD (charge coupled device) in combination with Fourier transform analysis.49 The very high sensitivity to variations in refractive index make the technique particularly useful in the study of cell membrane dynamics and intracellular activities.50 The results in Figure 8 show the label-free imaging of the cytoskeletal network activity in living wild-type (wt) Chinese hamster ovary (CHO) cells. While Nomarski can be used to show the presence of the thin lamellipodia which are typically 10–200 nm thick (Figure 8A), the smaller cytoskeletal network is not visible. The higher sensitivity of the QWLSI technique reveals the microtubule structures (1–15 nm thick) and allows the monitoring of the cytoskeleton dynamics in lamellipodia during protrusion and mitochondria displacement along the cytoskeletal network (Figure 8B and C).
 | Figure 8 Living wt CHO cells observed at 100× and NA of 1.4. |
Using the quantitative function of the technique, together with simulation tools, the refractive index of a single tubulin microtubule was determined to be ntubu =2.36±0.6 at a wavelength of 527 nm.
Nanodetection and measurement using deconvolution
A third family of nanodetection consists of subpixel or subvoxel metrology to measure the position of simple, regular structures, such as small particles, or regular patterns using deconvolution, based on the knowledge of the optical transfer function of the optical system. Deconvolution consists of reversing the effects of optical distortion introduced by the imaging system or using a known mathematical function that describes the optical effect when imaging a simple structure, such as a small particle, to locate it more precisely. In materials science, this has been used to measure the 3D distribution of defects inside semiconductor crystals by measuring the intensity response of the particles as a function of either the Gaussian beam profile of the laser beam or the sinc2 longitudinal PSF (point spread function, or optical response of the system to a point source at infinity) of the optical system in LST, giving a measurement uncertainty of 0.1 μm along the optical axis.9,10 This technique has since been used for measuring the positions of individual molecules inside cells using single fluorescence microscopy involving the “superlocalization” of point source photons.13 Another application of deconvolution is in the precise repositioning of a petri dish to within 20 nm in the study of the absorption of apoptotic bodies by fibroblasts, using a carefully designed reference mask.51 The evolution of cell activity can be monitored over long periods of tens of hours by removing the petri dish from a controlled environment for imaging on the microscope at regular intervals and using the mask to correct for positioning errors.
Nanodetection and measurement using nanomarkers
If in materials science it has been possible to make use of “native” nanomarkers such as microprecipitates in crystals to reveal the effects of annealing11 or the local variations in strain fields to reveal atomic sized dislocations in semiconductors,18 in biological materials it is the use of “foreign” markers such as fluorophores and AuNP that are finding extensive use in the study of cell type and structure. Such labeling represents a large step forward in optical microscopy for the life sciences. The particularity of these techniques is that although they are not resolvable, nanomarkers appear as point sources and can be used to mark the positions of nanometric structures and so build up finer details of normally unresolved biological structures.
Two-photon microscopy and AuNP mapping
For example, in combination with two photon microscopy, single 5 nm-AuNP’s have been used to map out the nanometric structure of collagen fibers by moving them along the fiber by means of a photoacoustic effect from a pulsed laser.52 But, it is the use of stochastically controlled fluorophores in confocal fluorescence microscopy that is a major emerging technique for very high resolution imaging of biological samples.
Confocal fluorescence and total internal reflection microscopy
Confocal fluorescence microscopy is commonly used for the selective labeling of different cellular structures, but is limited by the resolution of the imaging system. A certain improvement in positional selectivity can be attained using total internal reflection (TIRF) illumination at an interface. This is achieved by a reduction in the background intensity using the evanescent field to excite only the fluorophores that are attached to structures within a depth of about 100 nm.13 More detailed images are thus accessible within the region of the cell membrane, allowing the study of dynamic processes such as cell membrane adhesion or the movement of nanometric vesicles.
Stochastic and superlocalization fluorescent techniques
To attain even higher resolution positional measurement of nanostructures using individual fluorescent molecules, stochastic techniques are required to separate them spatially together with superlocalization techniques to measure their positions. Individual molecules can be observed by switching on and off a low number at any one time and measuring their positions. By successive illumination and mapping of large numbers of molecules, the structures to which they are attached can be mapped out with a much higher resolution than that of the imaging system in the technique known as photo-activated localization microscopy (PALM).5 Many different fluorophores suitable for stochastic imaging have been developed, enabling the spatiotemporal analysis of different structural details in cellular processes with resolutions of 20–40 nm.53
Further improvements in nanodetection mapping precision have been obtained using a dual objective arrangement and astigmatic imaging in what is called dual-objective 3D STORM. A dissymmetry is introduced into the PSF that enables higher precision measurement of the positions of individual molecules to within 10 nm laterally and 20 nm axially. The results in Figure 9 show the measured layout of individual actin filaments in a COS-7 cell, well illustrating the finer detail achievable together with the valuable depth information available that helps in the understanding of the structural organization of the actin cytoskeleton.54 Bleaching (or blinking) assisted localization microscopy (BALM) is another single molecule detection imaging technique similar to PALM and STORM. BALM is based on the intrinsic bleaching and blinking behavior of single fluorescent molecules which are detected by acquiring a stack of fluorescence images and subtracting each image from the previous one. A Gaussian fit is then used to determine the lateral localization to within 50 nm.55,56
 | Figure 9 Dual-objective 3D STORM for resolving individual actin filaments in a COS-7 cell. |
Conclusion
In this review we have underlined some of the emerging techniques in optical nanoscopy for imaging, measurement, and characterization in biophysics and medical applications. We have presented a classification scheme that is useful to help in understanding the many different techniques that exist. Two particular categories have been underlined, superresolution techniques and nanodetection techniques. Superresolution allows a real improvement in lateral resolution to provide finer details, and this has been illustrated with TDM for high resolution imaging of diatoms and scattering lens microscopy for cell imaging in vivo. The second category, concerning nanodetection, although limited by diffraction, nonetheless allows the detection, observation, or measurement of different types of nanostructures. This category has been illustrated with different techniques based on contrast, phase, deconvolution, and nanomarkers. Contrast based techniques such as SEEC has been used to visualize the very thin layers of slime to study bacterial motility and strobed phase-contrast microscopy has been used to study the complex dynamic vibration modes on 5-nm-thick vesicle membranes. By measuring the phase in real time, CSI allows the nanometric roughness measurement of cells to high accuracy and QWLSI, nanostructures within cells. Finally, the use of nanomarkers in the form of AuNP and fluorophores when used stochastically together with superlocalization techniques demonstrate how the finer 10–20 nm details of intracellular structures can be mapped out in 3D.
Both superresolution and nanodetection are thus increasingly being used for nanoimaging and characterization in many different fields of biophysics and medicine, while retaining all the advantages of far-field optical imaging such as a wide-field, real-time operation, and high data acquisition. Some fundamental and technological challenges remain in optical nanoscopy. Near-infrared based deep tissue imaging remains a fundamental challenge due to the problem of light scattering in diffuse materials which reduces the resolution. Solutions could be found with FF-OCT or scattering lens methods or temporal imaging. Improvements in signal and image processing could also be found with correlative techniques or those based on energy operators. The use of adaptive optics and the combination of several different imaging techniques would also help to move toward “intelligent” nanoscopy in which one goal would be to improve internal structural identification without labeling. Finally, miniaturizing the probe heads using dedicated MOEMS (Micro-Opto-Electro-Mechanical Systems) would be a way forward to handheld or optical fiber based systems for endoscopic use in medical imaging.
Acknowledgments
Thanks are extended to M Guellil (ICube, Strasbourg, France), O Haeberlé and B Simon (MIPS, Mulhouse, France), V Vitkova (BAS, Sofia, Bulgaria), N Médard (Nanolane, France), Z Serra (Phasics, Palaiseau, France), and K Xu (Howard Hughes Medical Institute, Harvard University, Cambridge, MA, USA) for permission to use their material in this review.
Disclosure
The authors report no conflicts of interest in this work.
References
Pecheva E, Montgomery P, Montaner D, Pramatarova L. White light scanning interferometry adapted for large-area optical analysis of thick and rough hydroxyapatite layers. Langmuir. 2007;23(7):3912–3918. | |
Dubois A. Full-field optical coherence microscopy: technology and applications. Singapore: Pan Stanford Publishing, in press; 2015. | |
Ehrenberg M. Super-resolved fluorescence microscopy. In: The Royal Swedish Academy of Sciences. Stockholm, Sweden; 2014. | |
Klar TA, Jakobs S, Dyba M, Egner A, Hell SW. Fluorescence microscopy with diffraction resolution barrier broken by stimulated emission. Proc Natl Acad Sci U S A. 2000;97(15):8206–8210. | |
Betzig E, Patterson GH, Sougrat R, et al. Imaging intracellular fluorescent proteins at nanometer resolution. Science. 2006;313(5793):1642–1645. | |
Dickson RM, Cubitt AB, Tsien RY, Moerner WE. On/off blinking and switching behaviour of single molecules of green fluorescent protein. Nature. 1997;388(6640):355–358. | |
Born M, Wolf E. Principles of Optics: Electromagnetic Theory of Propagation, Interference and Diffraction of Light. 6th ed. Oxford, England: Pergamon Press; 1980. | |
Montgomery PC, Serio B, Anstotz F, Montaner D. Far field optical nanoscopy: how far can you go in nanometric characterization without resolving all the details? Appl Surf Sci. 2013;281:89–95. | |
Montgomery PC. Nanoscopy: nanometre defect analysis by computer aided 3D optical imaging. Nanotechnology. 1990;1(1):54. | |
Fillard JP. Near Field Optics and Nanoscopy. Singapore, Singapore: World Scientific; 1996. | |
Fillard JP, Gall P, Weyher J, Asgarina M, Montgomery P. Laser scanning microtomography and selective etching: evidence of matrix microprecipitates and decoration of dislocations in SI GaAs. In: Grossmann G, Ledebo L, editors. Proceedings of the 5th Conference on Semi-Insulating III-V Materials at Malmö, Sweden. New York, NY: CRC Press; 1988:537–542. | |
Fillard JP, Montgomery PC, Gall P, Castagné M, Bonnafé J. High resolution and sensitivity infrared tomography. J Cryst Growth. 1990; 103(1–4):109–115. | |
Mashanov GI, Tacon D, Knight AE, Peckham M, Molloy JE. Visualizing single molecules inside living cells using total internal reflection fluorescence microscopy. Methods. 2003;29(2):142–152. | |
Ma M, Nango N, Ogawa T, Watanabe M, Eguchi M. Study on defects in EMCZ-Si crystal by infrared light scattering tomography. J Cryst Growth. 2000;208(1–4):282–288. | |
Beversluis MR, Novotny L, Stranick SJ. Programmable vector point-spread function engineering. Opt Express. 2006;14(7):2650. | |
Mahou P, Vermot J, Beaurepaire E, Supatto W. Multicolor two-photon light-sheet microscopy. Nat Methods. 2014;11(6):600–601. | |
Ritter JG, Veith R, Veenendaal A, Siebrasse JP, Kubitscheck U. Light sheet microscopy for single molecule tracking in living tissue. PLoS One. 2010;5(7):e11639. | |
Montgomery PC, Fillard JP. High-resolution imaging of defects in III-V compound wafers by near-infra-red phase contrast microscopy. Electron Lett. 1989;25(2):89. | |
Creath K. Phase-measurement interferometry techniques. In: Wolf E, editor. Progress in Optics. Vol 26. Amsterdam, the Netherlands: Elsevier Science; 1988:349–393. | |
Kino GS, Chim SS. Mirau correlation microscope. Appl Opt. 1990; 29(26):3775–3783. | |
Montgomery PC, Fillard J-P. Peak fringe scanning microscopy: submicron 3D measurement of semiconductor components. In: Brown G, Kwon OY, Kujawinska M, et al, editors. Proceedings of the International Conference on Interferometry: Techniques and Analysis. Vol 1755. San Diego, USA. Bellingham, WA: SPIE – International Society for Optical Engineering; 1993:12–23. | |
Wilson T, Sheppard C. Theory and Practice of Scanning Optical Microscopy. London, England: Academic Press; 1984. | |
Gustafsson MG. Nonlinear structured-illumination microscopy: wide-field fluorescence imaging with theoretically unlimited resolution. Proc Natl Acad Sci U S A. 2005;102(37):13081–13086. | |
Bretschneider S, Eggeling C, Hell SW. Breaking the diffraction barrier in fluorescence microscopy by optical shelving. Phys Rev Lett. 2007; 98(21):218103. | |
Debailleul M, Georges V, Simon B, Morin R, Haeberlé O. High-resolution three-dimensional tomographic diffractive microscopy of transparent inorganic and biological samples. Opt Lett. 2009; 34(1):79. | |
Cotte Y, Toy F, Jourdain P, et al. Marker-free phase nanoscopy. Nat Photonics. 2013;7(2):113–117. | |
Liu H, Bailleul J, Simon B, Debailleul M, Colicchio B, Haeberlé O. Tomographic diffractive microscopy and multiview profilometry with flexible aberration correction. Appl Opt. 2014;53(4):748. | |
Van Putten E, Akbulut D, Bertolotti J, Vos W, Lagendijk A, Mosk A. Scattering lens resolves sub-100 nm structures with visible light. Phys Rev Lett. 2011;106(19):193905. | |
Choi Y, Kim M, Yoon C, Yang TD, Lee KJ, Choi W. Synthetic aperture microscopy for high resolution imaging through a turbid medium. Opt Lett. 2011;36(21):4263. | |
Jones R, Wykes C. Holographic and Speckle Interferometry. Cambridge, England: Cambridge University Press; 1989. | |
Choi Y, Yoon C, Kim M, Choi W, Choi W. Optical imaging with the use of a scattering lens. IEEE J Sel Top Quantum Electron. 2014;20(2):61–73. | |
Ausserré D, Valignat M-P. Surface enhanced ellipsometric contrast (SEEC) basic theory and lambda/4 multilayered solutions. Opt Express 2007;15(13):8329–8339. | |
Ducret A, Valignat M-P, Mouhamar F, Mignot T, Theodoly O. Wet-surface–enhanced ellipsometric contrast microscopy identifies slime as a major adhesion factor during bacterial surface motility. Proc Natl Acad Sci U S A. 2012;109(25):10036–10041. | |
Gunnarsson A, Bally M, Jönsson P, Médard N, Höök F. Time-resolved surface-enhanced ellipsometric contrast imaging for label-free analysis of biomolecular recognition reactions on glycolipid domains. Anal Chem. 2012;84(15):6538–6545. | |
Egea AMC, Metivier M, Croguennoc P, Remaud-Simeon M, Vieu C. Real-Time monitoring of dextransucrase-based enzymatic reaction through surface-enhanced ellipsometric contrast (SEEC) microscopy in liquid environment. BioNanoScience. 2013;4(1):37–45. | |
Monot J, Petit M, Lane SM, et al. Towards zirconium phosphonate-based microarrays for probing DNA−protein interactions: critical influence of the location of the probe anchoring groups. J Am Chem Soc. 2008;130(19):6243–6251. | |
Souplet V, Desmet R, Melnyk O. Imaging of protein layers with an optical microscope for the characterization of peptide microarrays. J Pept Sci. 2007;13(7):451–457. | |
Genova J, Zheliaskova A, Vitkova V, Mitov MD. Stroboscopic illumination study of the dynamics of fluctuating vesicles. J Optoelectron Adv Mater. 2009;11(9):1222–1225. | |
Genova J, Vitkova V, Bivas I. Registration and analysis of the shape fluctuations of nearly spherical lipid vesicles. Phys Rev E Stat Nonlin Soft Mater Phys. 2013;88(2):022707. | |
Atilgan E, Ovryn B. Reflectivity and topography of cells grown on glass-coverslips measured with phase-shifted laser feedback interference microscopy. Biomed Opt Express. 2011;2(8):2417. | |
Montgomery PC, Salzenstein F, Montaner D, Serio B, Pfeiffer P. Implementation of a fringe visibility based algorithm in coherence scanning interferometry for surface roughness measurement. In: Lehmann PH, Osten W, Albertazzi A, editors. Proceedings of SPIE Optical Metrology: 8th Conference on Optical Measurement Systems for Industrial Inspection at Munich, Germany. Vol 8788. Bellingham, WA: SPIE – International Society for Optical Engineering; 2013: 87883G-87883G-11. | |
Guellil M, Montgomery PC, Pfeiffer P, Serio B. Comparison of areal measurements of the same zone of etched Si and hydroxyapatite layers on etched Si using different profiling techniques. In: Gorecki C, Asundi AK, Osten W, editors. Proceedings of SPIE Photonics Europe: Optical Micro- and Nanometrology at Brussels, Belgium. Vol 9132. Bellingham, WA: SPIE – International Society for Optical Engineering; 2014:913204-913204-9. | |
Schmit J, Reed J, Novak E, Gimzewski JK. Performance advances in interferometric optical profilers for imaging and testing. J Opt Pure Appl Opt. 2008;10(6):064001. | |
Dubois A, Boccara A. Full-field OCT. Med Sci. 2006;22(10):859–864. | |
Dubois A. Spectroscopic polarization-sensitive full-field optical coherence tomography. Opt Express. 2012;20(9):9962. | |
Gastinger K, Haugholt KH, Kujawinska M, Jozwik M, Schaeffel C, Beer S. Optical, mechanical, and electro-optical design of an interferometric test station for massive parallel inspection of MEMS and MOEMS. In: Lehmann PH, editor. Proceedings of Optical Measurement Systems for Industrial Inspection VI. Vol 7389. Munich, Germany: SPIE; 2009: 73891J–73891J-12. | |
Montgomery P, Anstotz F, Johnson G, Kiefer R. Real time surface morphology analysis of semiconductor materials and devices using 4D interference microscopy. J Mater Sci Mater Electron. 2008;19(1):194–198. | |
Montgomery PC, Anstotz F, Montagna J, Montaner D, Pramatarova L, Pecheva E. Towards real time 3D quantitative characterisation of in situ layer growth using white light interference microscopy. J Phys Conf Ser. 2010;253(1):012017. | |
Bon P, Maucort G, Wattellier B, Monneret S. Quadriwave lateral shearing interferometry for quantitative phase microscopy of living cells. Opt Express. 2009;17(15):13080. | |
Bon P, Lécart S, Fort E, Lévêque-Fort S. Fast label-free cytoskeletal network imaging in living mammalian cells. Biophys J. 2014;106(8):1588–1595. | |
Galeano Z JA, Sandoz P, Gaiffe E, et al. Position-referenced microscopy for live cell culture monitoring. Biomed Opt Express. 2011; 2(5):1307. | |
Chen B, Estrada LC, Hellriegel C, Gratton E. Nanometer-scale optical imaging of collagen fibers using gold nanoparticles. Biomed Opt Express. 2011;2(3):511–519. | |
Sahl SJ, Moerner W. Super-resolution fluorescence imaging with single molecules. Curr Opin Struct Biol. 2013;23(5):778–787. | |
Xu K, Babcock HP, Zhuang X. Dual-objective STORM reveals three-dimensional filament organization in the actin cytoskeleton. Nat Methods. 2012;9(2):185–188. | |
Burnette DT, Sengupta P, Dai Y, Lippincott-Schwartz J, Kachar B. Bleaching/blinking assisted localization microscopy for superresolution imaging using standard fluorescent molecules. Proc Natl Acad Sci U S A. 2011;108(52):21081–21086. | |
Schoen I, Ries J, Klotzsch E, Ewers H, Vogel V. Binding-activated localization microscopy of DNA structures. Nano Lett. 2011;11(9):4008–4011. |
 © 2015 The Author(s). This work is published and licensed by Dove Medical Press Limited. The
full terms of this license are available at https://www.dovepress.com/terms
and incorporate the Creative Commons Attribution
- Non Commercial (unported, 3.0) License.
By accessing the work you hereby accept the Terms. Non-commercial uses of the work are permitted
without any further permission from Dove Medical Press Limited, provided the work is properly
attributed. For permission for commercial use of this work, please see paragraphs 4.2 and 5 of our Terms.
© 2015 The Author(s). This work is published and licensed by Dove Medical Press Limited. The
full terms of this license are available at https://www.dovepress.com/terms
and incorporate the Creative Commons Attribution
- Non Commercial (unported, 3.0) License.
By accessing the work you hereby accept the Terms. Non-commercial uses of the work are permitted
without any further permission from Dove Medical Press Limited, provided the work is properly
attributed. For permission for commercial use of this work, please see paragraphs 4.2 and 5 of our Terms.