Back to Journals » International Journal of Nanomedicine » Volume 15
Efficient Labeling Of Mesenchymal Stem Cells For High Sensitivity Long-Term MRI Monitoring In Live Mice Brains
Authors Ali AAA ![]() , Shahror RA
, Shahror RA ![]() , Chen KY
, Chen KY
Received 5 April 2019
Accepted for publication 8 November 2019
Published 8 January 2020 Volume 2020:15 Pages 97—114
DOI https://doi.org/10.2147/IJN.S211205
Checked for plagiarism Yes
Review by Single anonymous peer review
Peer reviewer comments 2
Editor who approved publication: Dr Mian Wang
Video abstract presented by Ahmed Atef Ahmed Ali.
Views: 3764
Ahmed Atef Ahmed Ali,1 Rami Ahmad Shahror,2,3 Kai-Yun Chen2,3
1TMU Neuroscience Research Center – NeuroImage, College of Medicine, Taipei Medical University, Taipei 110, Taiwan; 2Ph.D. Program for Neural Regenerative Medicine, College of Medical Science and Technology, Taipei Medical University and National Health Research Institutes, Taipei 110, Taiwan; 3Center for Neurotrauma and Neuroregeneration, Taipei Medical University, Taipei 110, Taiwan
Correspondence: Ahmed Atef Ahmed Ali
Taipei Medical University, No. 250, Wuxing Street, Xinyi District, Taipei 110, Taiwan ROC
Tel +886-2-2736-1661 ext 3215
Email [email protected]
Background: Regenerative medicine field is still lagging due to the lack of adequate knowledge regarding the homing of therapeutic cells towards disease sites, tracking of cells during treatment, and monitoring the biodistribution and fate of cells. Such necessities require labeling of cells with imaging agents that do not alter their biological characteristics, and development of suitable non-invasive imaging modalities.
Purpose: We aimed to develop, characterize, and standardize a facile labeling strategy for engineered mesenchymal stem cells without altering their viability, secretion of FGF21 protein (neuroprotective), and differentiation capabilities for non-invasive longitudinal MRI monitoring in live mice brains with high sensitivity.
Methods: We compared the labeling efficiency of different commercial iron oxide nanoparticles towards our stem cells and determined the optimum labeling conditions using prussian blue staining, confocal microscopy, transmission electron microscopy, and flow cytometry. To investigate any change in biological characteristics of labeled cells, we tested their viability by WST-1 assay, expression of FGF21 by Western blot, and adipogenic and osteogenic differentiation capabilities. MRI contrast-enhancing properties of labeled cells were investigated in vitro using cell-agarose phantoms and in mice brains transplanted with the therapeutic stem cells.
Results: We determined the nanoparticles that showed best labeling efficiency and least extracellular aggregation. We further optimized their labeling conditions (nanoparticles concentration and media supplementation) to achieve high cellular uptake and minimal extracellular aggregation of nanoparticles. Cell viability, expression of FGF21 protein, and differentiation capabilities were not impeded by nanoparticles labeling. Low number of labeled cells produced strong MRI signal decay in phantoms and in live mice brains which were visible for 4 weeks post transplantation.
Conclusion: We established a standardized magnetic nanoparticle labeling platform for stem cells that were monitored longitudinally with high sensitivity in mice brains using MRI for regenerative medicine applications.
Keywords: iron oxide nanoparticles, FGF21, regenerative medicine, tracking of cells, non-invasive imaging modality
Introduction
Therapeutic stem cells constitute a pivotal component of the regenerative medicine field. For the neurodegenerative diseases, brain injuries, and stroke, the use of therapeutic mesenchymal stem cells (MSCs) showed promising therapeutic effects due to their capability to induce regeneration and neurogenesis, and modulate the vascularization and inflammation of the affected tissues.1 The therapeutic effects of MSCs are attributed to their capability of producing various neurotrophic factors such as brain-derived neurotrophic factor (BDNF),2,3 glial-cell-derived neurotrophic factor (GDNF),4 stromal cell-derived factor 1 (SDF1),5 and angiogenic molecules.6
One important endogenous protein that is recently attracting the attention of neuroscientists due to its possible roles in neuroprotection is the fibroblast growth factor-21 (FGF21).7 It was found that FGF21 has a role in metabolism regulation by aiding cells to metabolize glucose and lipids.8,9 In addition, FGF21 showed significant neuroprotection effects by increasing levels of the cell-survival-related protein kinase Akt-1, which exhibits remarkable neuroprotective properties, and synergizes the neuroprotective effects of mood stabilizers such as lithium and valproic acid. Moreover, treating aging cerebellar granular cells with FGF21 could stop their glutamate-induced excitotoxicity and neuronal death.7 In this study, we aimed to use novel genetically engineered bone-marrow-derived MSCs that can produce FGF21 to help develop novel neuroprotective MSCs platform that can be used for treatment of neurodegenerative diseases and brain injuries.
Despite recent advances in therapeutic stem cells field, the dream of implementing stem cell therapy in clinical practice is still far to reach. There are several factors that hinder the stem cell therapeutic approaches from reaching clinical practice, among which the lack of adequate knowledge regarding migration and homing of stem cells towards the disease or injury sites,10,11 need of longitudinal non-invasive tracking of the stem cells during the treatment procedures,12 and necessity of monitoring the fate and biodistribution of the stem cells11,13 are major challenges that need to be addressed. In this study, we aim to develop and characterize a labeling strategy and imaging modality for engineered MSCs that may help to address the unmet needs mentioned above of the therapeutic stem cells field.
In order to deal with such challenges, many research groups exert considerable efforts to develop imaging modalities for the therapeutic stem cells. Most of the currently used imaging modalities suffer from significant drawbacks. For example, positron emission tomography (PET) and single photon emission computed tomography (SPECT) imaging techniques require the use of radiotracers which may leak into body tissues and have rapid radioactive decay, and hence are not suitable for longitudinal imaging studies, and optical imaging using fluorescence or bioluminescence techniques suffer from poor tissue penetration (suitable only for superficial imaging) and may require engineered cells with reporter genes which may affect the biological properties of cells.12,14 Despite having less sensitivity, magnetic resonance imaging (MRI) is an excellent imaging modality that suits well the non-invasive longitudinal monitoring of therapeutic stem cells both in preclinical and clinical practices because it exhibits high spatial resolution, excellent tissue penetration and contrast, and the capability to acquire the pathophysiological and anatomical information of tested subjects.15,16 In this study, we aimed to label MSCs for MRI applications and evaluated their imaging properties.
MRI techniques require the use of cells labeled with contrast agents that are photostable, non-toxic, biocompatible, and do not alter cell properties.17 Iron oxide superparamagnetic nanoparticle formulations are considered as simple and effective contrast agents for MRI applications.18 Such formulations exhibit strong negative contrast properties in both T2 and T2*-weighted MRI images,19 and allow the histochemical detection of labeled cells by simple staining techniques. However, the iron oxide nanoparticle formulations and cell labeling protocols should be designed in a way to avoid any toxic effects or alteration of biological properties or functions of cells.20 Depending on the type of iron oxide nanoparticle formulations and their surface properties, MSCs' labeling may not be sufficient for MRI applications. Consequently, several approaches have been utilized to enhance nanoparticle uptake by MSCs such as incubating cells with protamine sulfate21 or Poly(L-lysine)22 along with nanoparticles, and applying magnetoelectroporation methods.23 Such approaches require tedious tuning and characterization, and may alter cell properties and functions. Besides, there is no clinically approved iron oxide formulation for labeling stem cells.24 Therefore, there is a considerable need for more research to develop and characterize labeling strategies for MSCs for MRI applications.
In this study, we aimed to establish an efficient non-toxic labeling strategy for genetically engineered MSCs without affecting their production of FGF21 protein or differentiation capabilities for non-invasive MRI visualization and tracking, and characterize their MRI imaging properties longitudinally in vivo. We compared the labeling efficiencies of three commercial iron oxide nanoparticle formulations to select the best suited for our MSCs labeling. We determined the optimum labeling conditions of the selected nanoparticle formulation regarding iron oxide concentration and labeling medium supplementation. We investigated the cellular localization of nanoparticles within the labeled MSCs and determined the efficiency (percentage of labeled cells) of labeling the cells with nanoparticles using the optimized conditions. We investigated the effects of the optimized labeling conditions on cell viability, expression of FGF21 protein, and differentiation capabilities. We tested the imaging capabilities of labeled MSCs in vitro in agarose phantoms and longitudinally after their stereotaxic implantation in mice brains for a period of 4 weeks. We believe that our data presented in this manuscript demonstrate a foundation for preclinical studies concerned with tracking, determining the dosage and long-term monitoring of therapeutic stem cells, and would be of interest and inspiration to regenerative medicine, neuroscience, and nanomedicine scientists.
Materials And Methods
Chemicals And Reagents
We purchased the Iron oxide (II, III) magnetic nanoparticles solution in H2O (IO-S NPs) of 20 nm average particle size from Sigma-Aldrich, Molday ION EverGreen aqueous suspension of superparamagnetic iron oxide (magnetite) nanoparticles (IO-MI NPs) of 35 nm average particle size from BioPAL Inc., and amino group functionalized iron oxide (Fe3O4) nanoparticles (IO-TN) suspended in H2O of 6–10 nm average size from TAN Bead Inc.
Cell Culture
The mesenchymal stem cells were originally purchased from GIBCO® and are derived from bone marrow of C57BL/6 mice. Cells were genetically engineered by transduction using lentivirus particles containing bicistronic vectors containing either mCherry reporter gene to produce either mCherry red fluorescent protein alone (named herein as mCherry MSCs) or open reading frame of Mus musculus FGF21 along with mCherry reporter gene to produce fibroblast growth factor 21 (FGF21) hormone and mCherry (named herein as FGF21 MSCs), controlled by the human elongation factor 1-α (EF1-α) promoter and obtained from GenCopoeia, Rockville, MD, USA. Cells were sorted using fluorescence-activated cell sorting (FACS) to isolate the cells that highly express mCherry protein. Both types of engineered cells were supplied by assistant professor Kai-Yun Chen at Taipei Medical University. Cells were grown in D-MEM/F-12 medium with GlutaMAX™-I supplemented with 10% MSC-Qualified fetal bovine serum (FBS) and 5 μg/mL gentamycin.
Prussian Blue Staining For Iron
Labeling of cells with the iron oxide nanoparticles was evaluated using the prussian blue staining procedures for iron according to a previous report.25 Cells were seeded in 12-well plates at a density of about 1.5x10⁵ cells per well and grown to about 70% confluency, then labeled with the specified nanoparticles under the specified conditions (non-labeled cells were also used as control group). Cells were washed with phosphate-buffered saline, fixed using 10% formalin and stained using the Iron Stain Kit of Sigma-Aldrich according to the manufacturer’s protocol. Images were acquired using the TissueFAXS platform (TissueGnostics, Vienna, Austria) inverted microscope.
Confocal Laser Scanning Microscopy
FGF21 MSCs and mCherry MSCs were cultured on sterile slide coverslips inside 12-well plates, then labeled overnight with 25 µg/mL of IO-MI NPs in media with or without FBS supplementation. Non-labeled control cells were cultured and subjected to the same procedures but without nanoparticles. Coverslips were washed 5 times with phosphate-buffered saline (PBS), then mounted on microscope slides using DAPI containing mounting medium (ProLong™ Gold Antifade Mountant). Images were acquired using a confocal laser scanning microscope Leica TCS SP5 system.
Transmission Electron Microscopy Of Nanoparticles
Nanoparticle suspensions (original suspension suspended in PBS or in medium with or without FBS and incubated overnight at 37°C and 5% CO2) were added on TED PELLA grids for 5 mins, washed with double distilled water, and dried at 60°C. Images were acquired using a HITACHI Transmission Electron microscope (HT-7700).
Flow Cytometry Of Cells
Cells to be tested were grown in 6-well plates, then labeled overnight with 25 µg/mL of IO-MI NPs in medium without FBS supplementation at 37°C and 5% CO2. Cells were washed 5 times with PBS with gentle shaking for 5 mins for each wash. Cells were detached using Trypsin-EDTA solution, dissociated using gentle pipetting, and washed with ice cold PBS three times. Cell numbers of each group were adjusted to 1x10⁶ cells/mL, then analyzed using a CytoFLEX Flow Cytometer Platform – Beckman Coulter.
Cell Viability Assay
We used the WST-1 cell proliferation reagent (Roche Diagnostics, Germany) to test the viability of FGF21 MSCs according to our previous publications25,26 with slight modification. We seeded the cells in 96-well plates and incubated them at the optimum growth conditions to reach a confluency of about 80%. We removed the media from wells and added fresh ones with different concentrations of IO-MI NPs without FBS supplementation (media without nanoparticles were also used for non-labeled control cells). After overnight incubation, we removed the media and followed the reagent manufacturer’s protocol to determine the cell viability.
Western Blot
FGF21 MSCs were labeled overnight with 25 µg/mL of IO-MI NPs in medium without FBS supplementation at 37°C and 5% CO2. Non-labeled cells subjected to the same experimental conditions were used as control. Extracted total proteins of cells were denatured, subjected to electrophoresis separation in SDS-PAGE gels, and transferred to polyvinylidene difluoride polyacrylamide (PVDF) membranes according to previous protocols.25–27 Rabbit anti-mouse FGF21 antibody (Aviscera Bioscience, Code: A00145-03-100) and beta-actin antibody (C4) (Santa Cruz Biotechnology, Code: sc-47778) were used to probe the FGF21 and beta-actin proteins, respectively (stripping and reprobing were performed). Horseradish peroxidase (HRP) secondary antibodies and Immobilon Western Chemiluminescent HRP Substrate kit were used to visualize the protein bands. Protein bands were normalized based on those of beta-actin and quantified using ImageJ.
Osteogenic And Adipogenic Differentiation Of The Mesenchymal Stem Cells
We used the StemPro® Osteogenesis Differentiation Kit and StemPro® Adipogenesis Differentiation Kit from GibcoTM to test the osteogenic and adipogenic differentiation capabilities of cells, respectively. We tested the differentiation capabilities of FGF21 MSCs and mCherry MSCs with and without labeling with 25 µg/mL of IO-MI NPs in medium without FBS supplementation at 37°C and 5% CO2. We followed the kit's manufacturer’s protocols to induce differentiation of cells. We tested cell differentiation into the osteogenic lineage by Alizarin Red S staining and into the adipogenic lineage by Oil Red O staining. Images were acquired using the TissueFAXS platform (TissueGnostics, Vienna, Austria) inverted microscope.
Preparation Of Cell Phantoms For Magnetic Resonance Imaging (MRI)
Cells were labeled under the optimum conditions with different concentrations of nanoparticles, then washed 5 times with ice cold PBS for 5 mins each, harvested using Trypsin-EDTA solution, dissociated using gentle pipetting, and cell numbers were determined and adjusted to the desired counts. Cell suspensions were warmed to 60°C, mixed at a 1:1 volume ratio carefully with warm 2% agarose solutions (60°C) to avoid introduction of air bubbles inside PCR tubes and cooled rapidly on ice to solidify. Solidified phantom tubes were put in a polystyrene support at the same height level and scanned by the MRI scanner.
Animal Experiments
All animal experiments of this study were performed according to the guidelines and regulations of the Institutional Animal Care and Use Committee (IACUC) of Taipei Medical University (TMU) and “3Rs” guidelines for animal experiments. The IACUC reviewed the study procedures and experimental protocols, and granted approval for the animal experiments presented in this study (IACUC approval number: LAC-2018-0174). We used 6–8-weeks-old male C57BL/6 mice (n=15) of 20–25 g weight in our experiments which were bought from the National Laboratory Animal Center, Taiwan. Mice were divided into three groups (n=5 each) to receive 50,000, 10,000, or 2000 transplanted cells per one side of the brain. Mice were anesthetized using intraperitoneal injections of a mixture of tiletamine-zolazepam (Zoletil®) (dose: 10 mg/kg) and xylazine (Rompun®) (dose: 10 mg/kg), then maintained under 2% isoflurane. For implantation of the nanoparticles labeled and non-labeled FGF21 MSCs, each mouse was fixed on a Kopf® small animal stereotaxic device using the mouse adaptor (nose and tooth bars) and ear bars over a heating pad to maintain body temperature. Above the skull, the fur was shaved, skin was cut (small incision) to expose the region of implantation of cells, drill openings were done at the specified coordinates, and the desired number of cells was injected using a Hamilton syringe connected to a 26G needle through Intramedic™ polyethylene tubing. Cells were injected at a depth of 3 mm below the brain surface at coordinates of 1 mm anterior to the bregma with 2 mm to the right side for the IO-MI NPs labeled FGF21 MSCs and 2 mm to the left side for the non-labeled FGF21 MSCs. The specified number of cells was injected slowly in aliquots of PBS of 2 µL volume over a period of 10 mins. After injection of cells, the syringe was kept in place for further 10 mins, then raised slowly out of the brain over a period of 10 mins. The drill openings were closed by dental cement mixed with acrylic liquid then the skin was closed by surgical sutures. The mice were maintained under 2% isoflurane anesthesia for MRI scanning at the specified time intervals. At the end of experiments, the mice were euthanized using excess dose of anesthetics.
In Vitro And In Vivo Magnetic Resonance Imaging (MRI) Experiments
MRI images were acquired using a 7T Bruker PharmaScan MRI scanner equipped with a volume coil of inner diameter of 72 mm (Bruker Biospin, MA, USA). For the embedded cell phantoms, we acquired their T2-weighted images using the multi-spin multi-echo (MSME) pulse sequence protocol of a repetition time of 3500 msec, echo times of 8.8–440 msec with an echo spacing of 8.8 msec, 50 echo images and a flip angle of 90°. For mice, we anesthetized them by making them inhale 1–2% isoflurane prior to and during scans, and acquired their T2*-weighted images using the fast low-angle shot (FLASH) gradient echo sequence of a repetition time of 300 msec, echo times of 3.627–68.987 msec with an echo spacing of 3.44 msec, 20 echo images and a flip angle of 15°, and their MSME T2-weighted images using the MSME pulse sequence protocol of a repetition time of 5054.781 msec, echo time of 8.8–308 msec with an echo spacing of 8.8 msec, 35 echo images, and a flip angle of 90°. The signal intensity versus echo time graphs were constructed by selecting regions of interest (ROI) in images of phantoms or mice brains and measuring the signal intensities of each ROI at different echo times using the ImageJ software. The ROI were of the same shape and area in the same image for the sake of accurate comparison.
Statistical Analysis
The data of this manuscript are presented as mean values ± standard deviation (SD) values. Statistical analysis of our results was performed using the ANOVA (analysis of variance) two-way with replication method to assume the two-tail p-values, F-values, and F-critical values of the data sets, and the t-test assuming unequal variances method to assume the two-tail p-values of the data sets. The performed statistical analysis methods as well as the analysis outcomes are displayed on the figures and/or mentioned in the figure legends.
Results
Screening Different Superparamagnetic Nanoparticle Formulations For Efficient Labeling Of The Mesenchymal Stem Cells And Optimizing Their Labeling Conditions
To determine the most suitable superparamagnetic nanoparticle formulation to label our mesenchymal stem cells, we investigated the labeling efficiencies of three commercially available superparamagnetic nanoparticle formulations (IO-S NPs, IO-MI NPs, IO-TN NPs) under the same labeling conditions of a working nanoparticle concentration of 50 µg/mL (iron content of nanoparticles), suspended in culture media supplemented with FBS and incubated overnight with cells. We stained the labeled cells for iron using the Prussian blue staining procedure25 and compared them to non-labeled control cells (Figure 1A). We found that IO-S NPs labeled the FGF21 MSCs partially using the specified conditions and showed aggregates of the nanoparticles both inside and outside cells. On the other side, IO-MI NPs showed more uptake of nanoparticles by cells and the least aggregates of nanoparticles among the tested nanoparticle formulations. Whereas, IO-TN NPs showed the least uptake of nanoparticles by cells and the most aggregates of nanoparticles among the tested formulations. Representative micrographs of the cells labeled with the three nanoparticle formulations are presented in Figure 1B. Based on these findings, we selected IO-MI NPs to proceed with our study.
 |
Figure 1 Representative micrographs of FGF21-producing mesenchymal stem cells (FGF21 MSCs) stained with prussian blue stain for iron, showing iron oxide nanoparticles uptaken by cells. (A) Non-labeled (cells without nanoparticles). (B) Cells labeled with different types of iron oxide nanoparticles (IO-S NPs, IO-MI NPs, and IO-TN NPs) of iron content concentration of 50 µg/mL and suspended in culture media supplemented with FBS. (C) Cells labeled with different concentrations of IO-MI NPs suspended in culture media without FBS supplementation. (D) Cells labeled with 25 µg/mL IO-MI NPs suspended in media with or without FBS supplementation. |
In order to determine the optimum concentration of IO-MI NPs to label the cells, we tested the labeling efficiencies of three concentrations of IO-MI NPs suspended in culture media without FBS supplementation and incubated overnight with cells (Figure 1C). We found that a concentration of 12.5 µg/mL of IO-MI NPs did not achieve labeling for all FGF21 MSCs and the amounts of uptaken nanoparticles were not high enough compared to the other tested concentrations. The concentration of 25 µg/mL of IO-MI NPs achieved labeling of almost all cells and did not show visible aggregates of nanoparticles. Although the concentration of 50 µg/mL of IO-MI NPs labeled all cells and achieved the highest amounts of nanoparticles per cell, the nanoparticles were aggregated both inside and outside cells. Accordingly, we concluded that 25 µg/mL of IO-MI NPs is the optimum concentration to label our mesenchymal stem cells.
To further optimize the labeling conditions for our mesenchymal stem cells, we characterized the labeling outcomes of 25 µg/mL of IO-MI NPs suspended in culture media with or without FBS supplementation and incubated overnight with FGF21 MSCs (Figure 1D). We observed that the labeling efficiency of nanoparticles suspended in the FBS supplemented medium was higher than those suspended in the non-FBS supplemented medium. However, the nanoparticles suspended in the FBS supplemented medium showed lots of aggregates that seemed to adhere to the outside of cells contrary for those suspended in the non-FBS supplemented medium which did not show almost any significant aggregates. Therefore, we excluded the labeling condition of nanoparticles suspended in the FBS supplemented medium from our further experiments because the aggregated nanoparticles will contribute to the measured magnetic properties of the cells by MRI and will not reflect the actual amounts of uptaken nanoparticles, and hence will not be suitable to detect or monitor the labeled cells in vitro and in vivo.
Visualizing The Cellular Localization And Uptake Of Nanoparticles By MSCs Labeled At Different Media Supplementation Conditions
We found that IO-MI NPs showed dense blue spots associated with cells following the prussian blue staining of labeled cells. However, it was not clear whether the nanoparticles were uptaken inside cells or aggregated outside cells. In order to detect the cellular localization and uptake of nanoparticles by cells and the aggregation properties of nanoparticles, we visualized FGF21 MSCs and mCherry MSCs after labeling with IO-MI NPs in media with or without FBS supplementation with confocal laser scanning microscopy and compared them to the corresponding non-labeled cells.
Results showed that both FGF21 MSCs (Figure 2A) and mCherry MSCs (Figure 2B) were equally labeled with IO-MI NPs under the same conditions. Both non-labeled cell types showed clear distinct cytoplasm and nucleus structures that were visible using the phase contrast technique and DAPI staining, respectively. No autofluorescence was detected in any of the cell types. Both cell types labeled with IO-MI NPs in media without FBS supplementation showed clear intracellular vesicles containing green fluorescent nanoparticles that were localized in cytoplasm. No nanoparticles were detected in nuclei of cells and no aggregates of nanoparticles were detected outside cells. For labeling with IO-MI NPs in FBS supplemented media, both cell types showed distinct intracellular vesicles of uptaken nanoparticles that were larger in size and more in number than those of the cells labeled with nanoparticles in media without FBS supplementation. Such vesicles were absent from nuclei of cells. Interestingly, we found that IO-MI NPs showed aggregates of nanoparticles outside cells of both types (shown by red arrows in the illustrated micrographs of cells), in accordance with our findings of the prussian blue staining of labeled cells and TEM imaging of IO-MI NPs suspended in media with FBS supplementation.
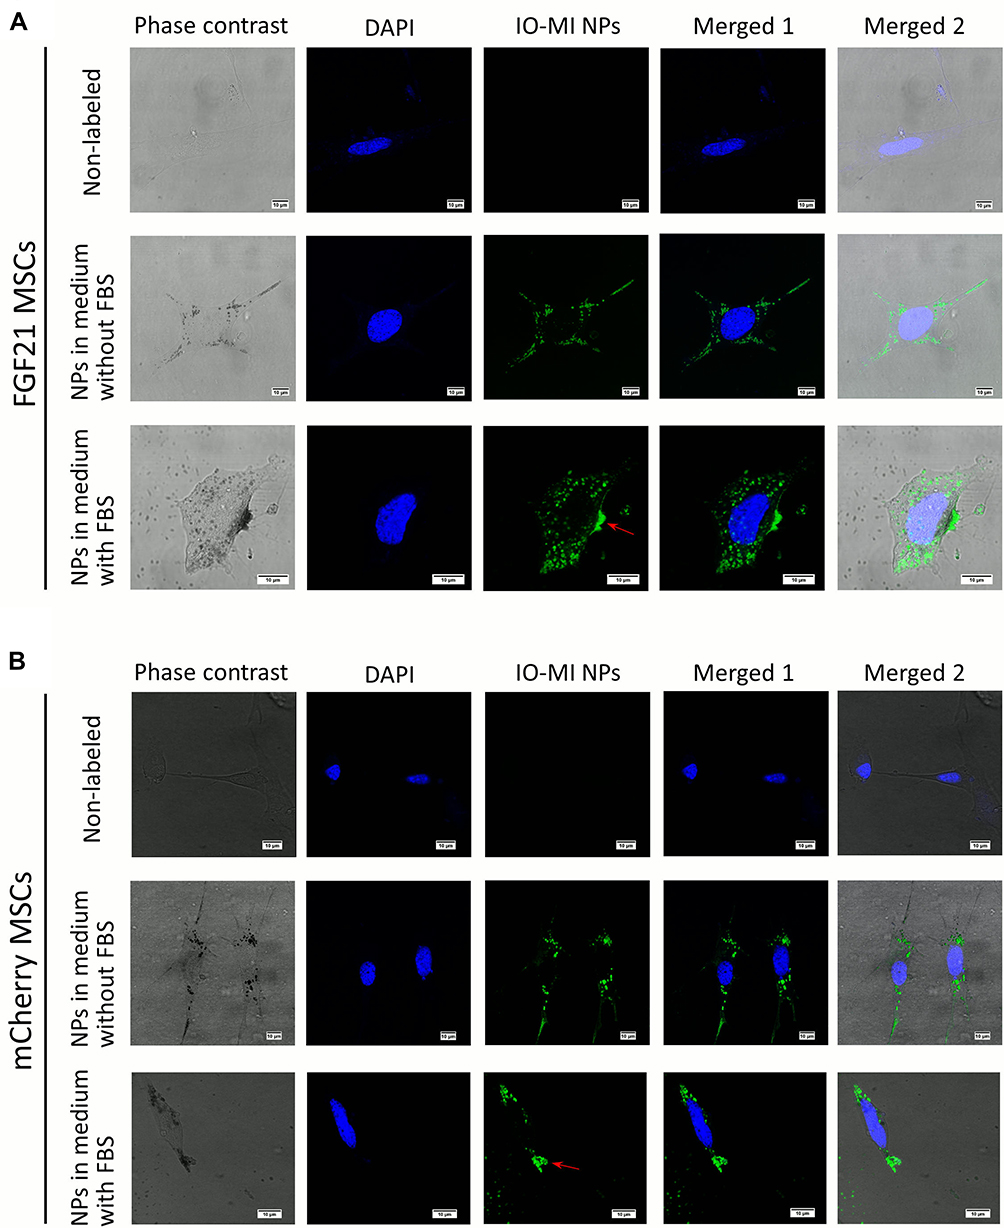 |
Figure 2 Representative confocal laser scanning microscopy micrographs of FGF21 MSCs (A) and mCherry MSCs (B) labeled with 25 µg/mL of IO-MI NPs in media with or without FBS supplementation. Non-labeled control cells are also shown. Nuclei: blue color, nanoparticles: green color, and aggregates of nanoparticles: red arrows. |
Effect Of Culture Media Supplementation On The Aggregation Properties Of Nanoparticles
We observed that labeling the MSCs in media containing FBS supplementation resulted in the appearance of large aggregates of nanoparticles that were clustered on cells. To determine whether this finding is due to the used cell type or inherent property of nanoparticles, we incubated IO-MI NPs without cells in culture media with or without FBS supplementation at the optimized labeling conditions that were determined from our previous experiments, then visualized the nanoparticles with TEM and compared them to the original nanoparticle suspension.
The IO-MI NPs original suspension showed uniform non-aggregated electron-dense nanoparticles of regular shapes, sizes, and monodisperse pattern as determined from the TEM images. The IO-MI NPs incubated in culture media with FBS supplementation produced large aggregates (that were even visible under light microscope) of nanoparticles, contrary for those incubated in culture media without FBS supplementation which showed almost no aggregates of nanoparticles compared to the original IO-MI NPs suspension (Figure 3A). These findings denote that IO-MI NPs aggregate in the presence of FBS regardless of the used cell type.
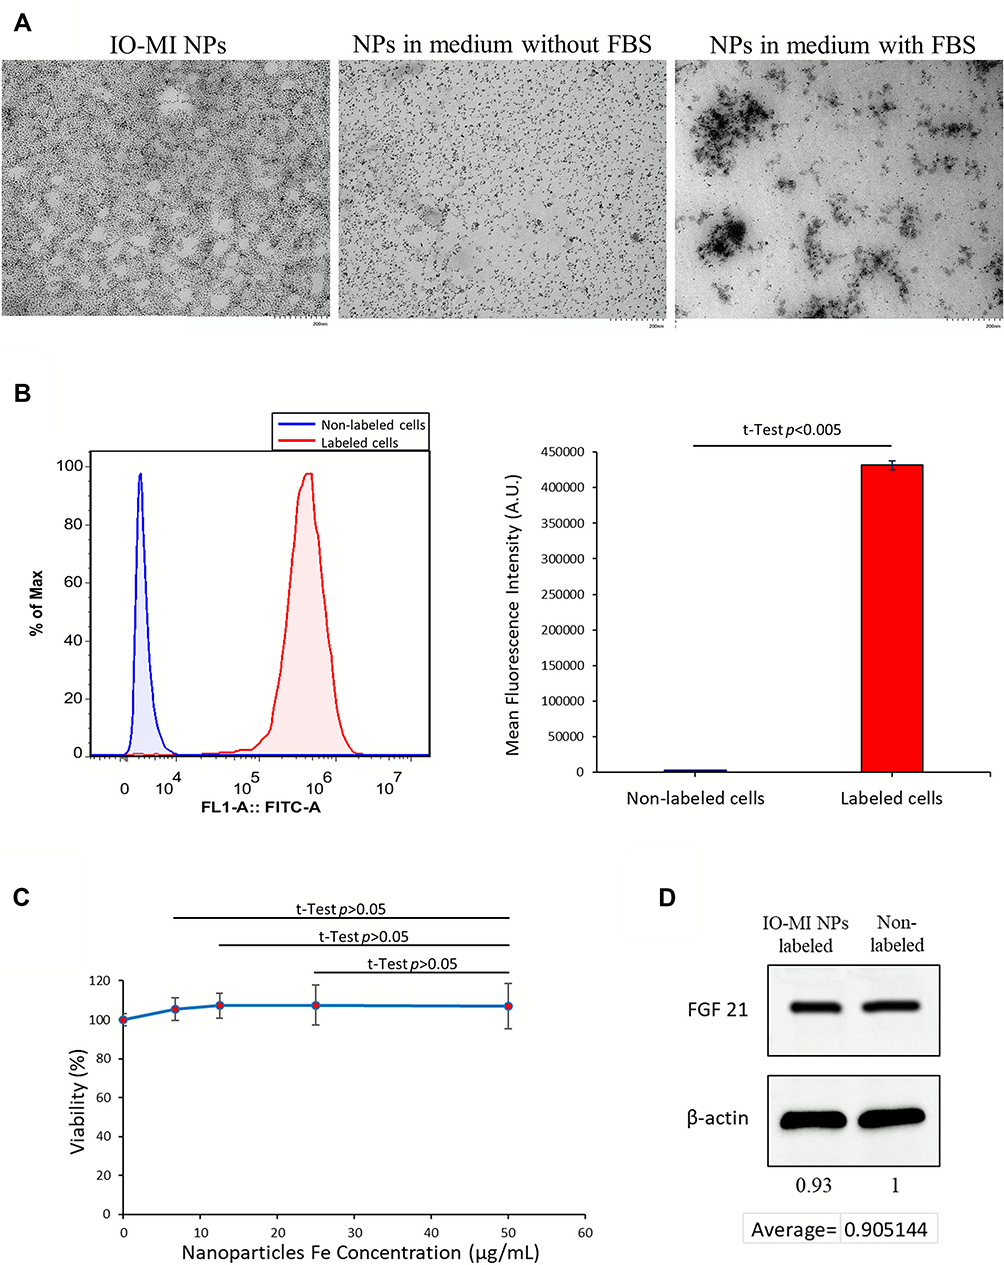 |
Figure 3 Characterization of IO-MI NPs, their labeling efficiency and effects on cells. (A) Representative micrographs of IO-MI NPs suspended in their original suspension or in culture media with or without FBS supplementation, acquired using transmission electron microscope (TEM). (B) Flow cytometry of FGF21 MSCs labeled or not labeled with IO-MI NPs and their respective mean fluorescence intensities. (C) Viability of FGF21 MSCs labeled with different concentrations of IO-MI NPs in medium without FBS, tested with WST-1 assay to detect any cytotoxic effects of nanoparticles. (D) Western blot assay of FGF21 extracted from FGF21 MSCs labeled with 25 µg/mL of IO-MI NPs, compared to that of the non-labeled cells. |
Determining The Efficiency Of The Optimized Labeling Conditions
In order to evaluate the labeling efficiency of IO-MI NPs under the optimized conditions, we performed flow cytometry analysis of FGF21 MSCs labeled overnight with 25 µg/mL of IO-MI NPs in culture media without FBS supplementation, compared to non-labeled cells. We found that these optimized conditions achieved labeling to almost all cells (98.29 ± 0.86% of the cells) which was evident from the strong shift of fluorescence peak from the non-labeled to the labeled cells and the statistical significant difference of the mean fluorescence intensities of non-labeled and labeled cells (Figure 3B). We decided that such labeling efficiency is suitable for our intended purpose of tracking cells in vivo in terms of acquired magnetic properties and absence of adsorbed extracellular nanoparticles or aggregates.
Effects Of Labeling The Mesenchymal Stem Cells With Nanoparticles On Their Viability And Expression Of FGF21 Protein
We aimed to evaluate the safety of labeling MSCs with IO-MI NPs by testing the viability of cells labeled with different concentrations of nanoparticles (up to 50 µg/mL, which is double the concentration we use to label cells for MRI applications), using the WST-1 cell proliferation reagent. We found that labeling the FGF21 MSCs with IO-MI NPs did not reduce the viability of cells at the optimized labeling conditions for all tested concentrations compared to the non-labeled control cells, indicating that IO-MI NPs have no cytotoxicity against cells at the tested concentrations (Figure 3C). Moreover, there was no statistical significant difference between the viability of cells labeled with different concentrations of nanoparticles.
Our FGF21 MSCs produce the fibroblast growth factor 21 (FGF21) protein which showed a great potential for many therapeutic applications as mentioned earlier. Therefore, we had a special interest to evaluate the effects of labeling the cells with magnetic nanoparticles on the production of such protein. We tested the amounts of FGF21 in cell lysates using Western blot experiments. We found that FGF21 MSCs labeled with 25 µg/mL of IO-MI NPs produced about 90.5% of the amounts of FGF21 produced by the non-labeled cells (Figure 3D). Although the amounts of FGF21 produced by the labeled cells were little less than the non-labeled cell, we believe that such amounts are satisfactory for the therapeutic effects of the mesenchymal stem cells.
Influence Of Labeling The Mesenchymal Stem Cells With Nanoparticles On Their Differentiation Capabilities
One important property of bone marrow-derived mesenchymal stem cells is to differentiate into different specialized cell types such as osteoblasts and adipocytes.28,29 Along with the capability to produce growth factors, mesenchymal stem cells need their capability of differentiating into different cell types to boost regeneration of injured tissues,30 and hence exert their therapeutic role. In order to determine whether labeling our mesenchymal stem cells with IO-MI NPs will affect their differentiation capabilities, we performed osteogenic and adipogenic differentiation experiments for labeled and non-labeled FGF21 MSCs (Figure 4A) and mCherry MSCs (Figure 4B).
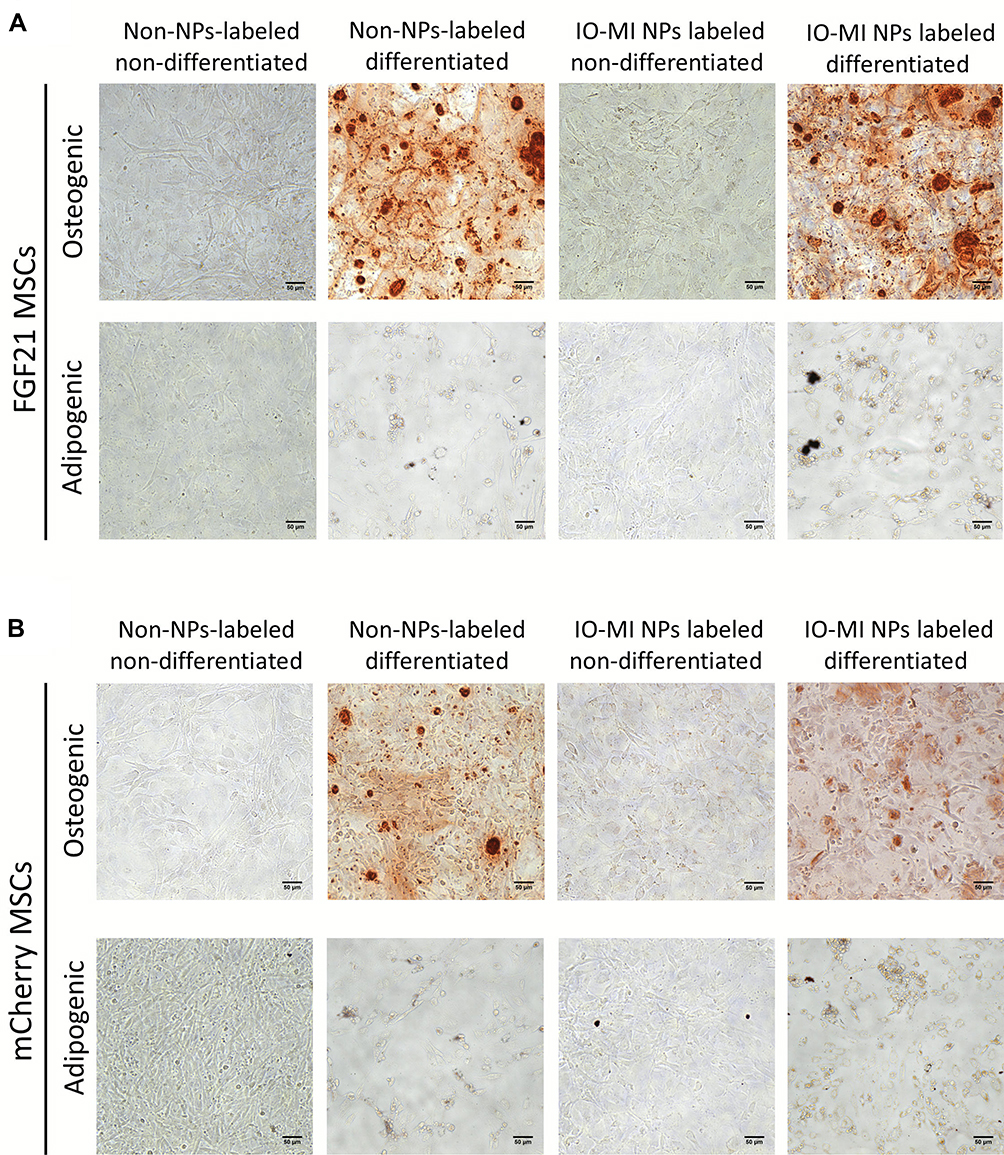 |
Figure 4 Representative micrographs of osteogenic and adipogenic differentiated FGF21 MSCs (A) and mCherry MSCs (B), compared to non-differentiated cells with or without labeling using 25 µg/mL of IO-MI NPs in media without FBS supplementation. |
We observed that the non-labeled FGF21 MSCs and mCherry MSCs showed clear osteogenic and adipogenic differentiation of cells after culturing in the differentiation media for the specified durations of 21 and 14 days, respectively. For the osteogenic differentiation experiment, we found that the morphology of cells changed clearly from their typical spindle shape (fibroblast-like morphology) to new distinct shapes such as round, oval, and polygonal shapes. We further confirmed the osteogenic differentiation by staining the samples for Ca+2 deposits by Alizarin Red S staining technique and found that the differentiated cells sample showed abundant dense deposits of Ca+2 that were stained red, which were absent in the non-differentiated cells. On the other side, FGF21 MSCs and mCherry MSCs labeled with 25 µg/mL of IO-MI NPs and cultured in the non-differentiating medium showed minute granular brownish yellow intracellular aggregates of nanoparticles that were localized in cytoplasms and absent from nuclei of cells. Staining with Alizarin Red S technique did not show any red deposits, indicating absence of osteogenic differentiation of cells. However, FGF21 MSCs and mCherry MSCs labeled with 25 µg/mL of IO-MI NPs and cultured in the osteogenic differentiating medium showed abundant dense red color of Ca+2 deposits with Alizarin Red S stain, indicating osteogenic differentiation of the labeled cells.
For the adipogenic differentiation experiments, the non-labeled FGF21 MSCs and mCherry MSCs cultured in the non-differentiating medium showed the typical spindle shape morphology of cells. However, the non-labeled FGF21 MSCs and mCherry MSCs cultured in the adipogenic differentiation medium showed different morphology of cells of round shape and round intracellular lipid droplets that were stained light red with Oil Red O staining technique. For FGF21 MSCs and mCherry MSCs labeled with 25 µg/mL of IO-MI NPs and cultured in the non-differentiating medium, cells showed similar morphology to the non-labeled ones with intracellular cytoplasmic minute granular aggregates of nanoparticles of brownish yellow color and no droplets of lipid, indicating no differentiation of cells due to nanoparticles labeling. For FGF21 MSCs and mCherry MSCs labeled with 25 µg/mL of IO-MI NPs and cultured in the adipogenic differentiation medium, cells exhibited different morphology than the parent cells, of round shape with cytoplasm containing lipid droplets that were stained light red with Oil Red O staining technique, denoting that labeling the cells with nanoparticles did not affect their differentiation capabilities.
Investigation Of The Contrast Enhancement Capabilities Of The Labeled Mesenchymal Stem Cells By MRI
To evaluate the capabilities of our nanoparticles-labeled FGF21 MSCs to impart contrast to MRI and to develop optimized MRI scan sequence protocols, we prepared phantom tubes of increasing numbers of labeled cells (175, 1756, 17,560, and 175,600 cells in the scanned slices) embedded in agarose gels and tested several MRI sequence protocols including T2 MSME, T2* FLASH, T2 RARE, SWI FLASH, SWI, T1 FISP (not all sequences are shown in this manuscript) using a 7T MRI scanner. We tested the signal intensities of different numbers of labeled cells compared to the control phantoms and their response to several relaxation types including the transverse relaxation (T2). We found that the transverse relaxation (T2) measurements were more significant and suitable for our experiments. Results of the T2 MSME sequence showed a gradual decrease in signal intensities of phantoms with increase in the number of labeled cells. The T2 signal intensities decayed rapidly and significantly for higher numbers of labeled cells (175,600 and 17,560 cells) at echo times of small values compared to the control phantoms, whereas the lower numbers of labeled cells (175 and 1756 cells) showed gradual exponential decay of their signal intensities. The sensitivity of our system could determine a number of about 175 of labeled cells, where their signal intensities were statistically significantly less than those of the control phantom. Such results indicate that the labeled FGF21 MSCs have strong T2 contrast capabilities (signal decay) compared to control phantoms. The signal intensities versus echo times graph showed that there is a correlation between the intensities of the 175,600 cells phantom and echo times of 8.8 to 26.4 msec, 17,560 cells phantom and echo times of 8.8 to 123.2 msec, and both 1756 and 175 cells phantoms and echo times of 8.8 to 352 msec. Please refer to Figure 5 for a representative MRI image of the phantoms and the corresponding graph for the signal intensities versus echo times.
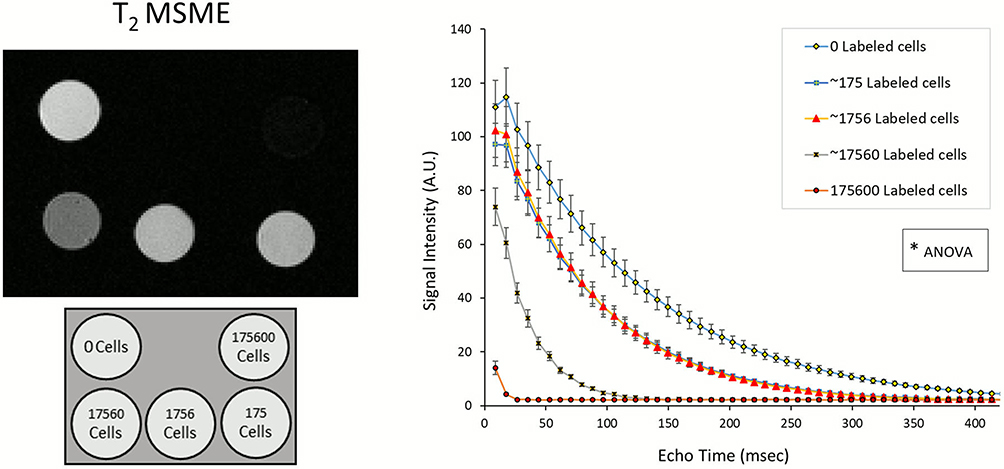 |
Figure 5 Representative T2-weighted MRI image of different numbers of labeled FGF21 MSCs in agarose phantoms acquired using MSME sequence protocol and their corresponding signal intensities versus echo times graph (all cells were labeled using 25 µg/mL of IO-MI NPs in media without FBS supplementation). *Analysis of variance (ANOVA) showed that there are statistical significant differences between the signal intensities of any of the labeled cells (175, 1756, 17,560, or 175,600 cells) and of the non-labeled cells (0 cells). However, there is no statistical significant difference between the signal intensities of 175 and 1756 cells. |
MRI Of Labeled And Non-Labeled Mesenchymal Stem Cells Transplanted In Mice Brains
To determine the suitability and potential of our labeled mesenchymal stem cells for MRI applications and tracking in vivo, we stereotaxically transplanted different numbers (50,000 cells; Figure 6A, 10,000 cells; Figure 6B, and 2000 cells; Figure 7) of labeled (right side) and non-labeled (left side) FGF21 MSCs in mice brains at the specified coordinates and acquired their live MRI images at different time points (0, 1, 7, 14, 21, and 28 days) after the transplantation procedures using the T2* FLASH and T2 MSME sequence protocols. All counts of labeled cells were detectable by T2* FLASH and T2 MSME sequences. We noticed that the labeled cells showed areas of significant hypointense regions (marked with blue dotted line outlines) that persisted for 28 days after transplantation compared to areas of non-labeled cells (marked with red dotted line outlines) which did not show any difference from neighboring regions of the brain (except for slight disruption of the brain tissue and minor bleeding that were occasionally observed due to the injection needle and transplanted cells). The hypointense areas of the labeled cells correlated to the numbers of injected cells and MRI scan sequence protocols, and decreased with time. The T2* FLASH sequence showed more sensitivity to detect labeled cells than the T2 MSME sequence (T2* FLASH images showed more clear hypointense regions for the smallest cell count (2000 cells) compared to the T2 MSME images) (Figure 7). However, the T2 MSME sequence showed better anatomical structure of the brain than the T2* FLASH sequence. We observed significant “blooming effect” in the images acquired by T2* FLASH sequence especially for higher cell counts (50,000 cells; Figures 6A and 10,000 cells; Figure 6B); such effect was less visible with the T2 MSME sequence. Signal intensity calculations of the acquired images showed that T2* FLASH and T2 MSME sequences produced sharp signal decay for the labeled 50,000 cells that were statistically significantly different from the non-labeled cells of the same count (Figure 6A). For the 10,000 cells, the T2* FLASH sequence showed sharp signal decay for the labeled cells, whereas the T2 MSME sequence produced gradual exponential signal decay for the labeled cells. Signal intensities of both sequences were statistically significantly less than those of the non-labeled cells of the same count (Figure 6B).
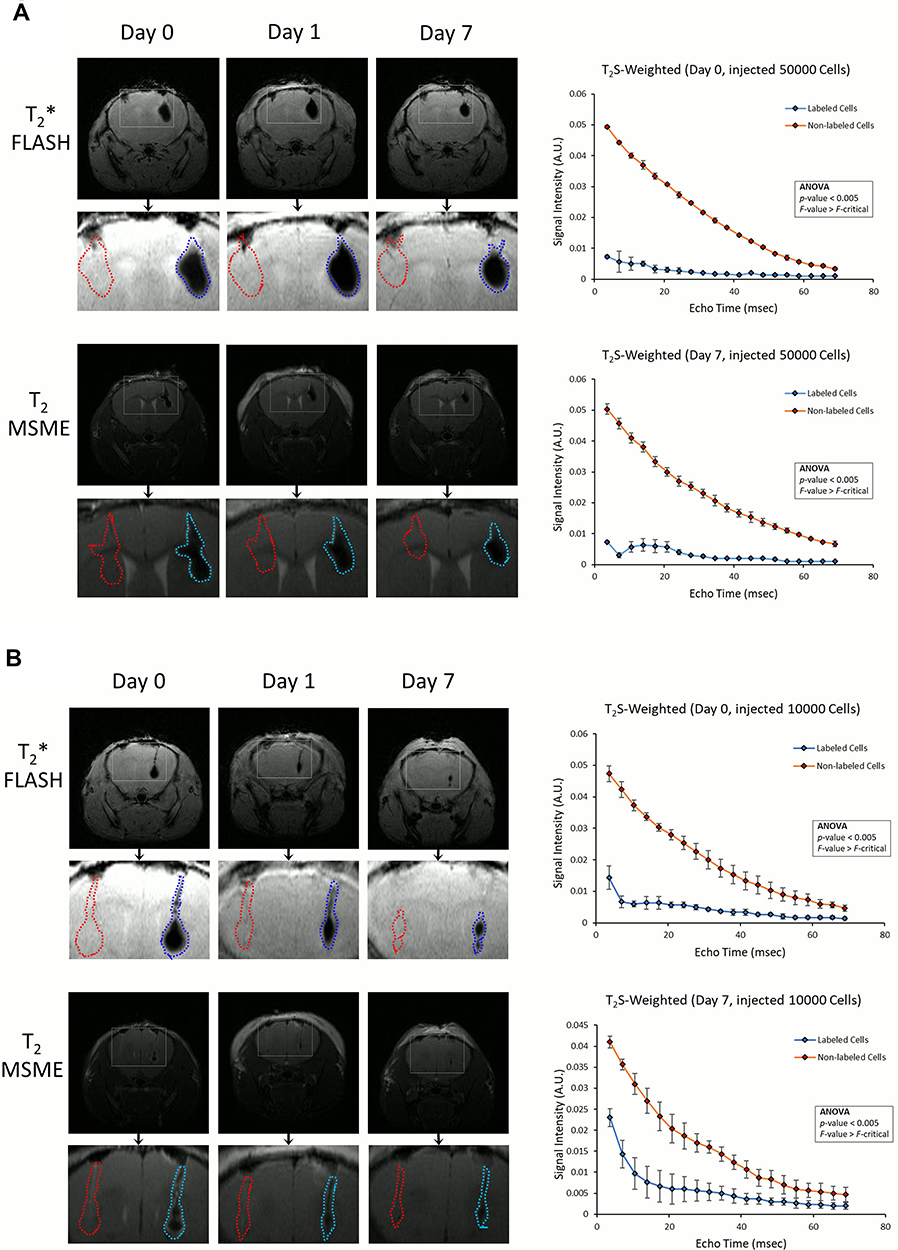 |
Figure 6 Representative T2*- and T2-weighted MRI images acquired using FLASH gradient echo and MSME sequence protocols, respectively, of live mice brains implanted stereotaxically with labeled (using 25 µg/mL of IO-MI NPs in media without FBS supplementation) (right side) and non-labeled (left side) FGF21 MSCs of counts of 50,000 cells (A), and 10,000 cells (B) suspended in 2 µL aliquots of PBS solution, acquired at days 0, 1, and 7 after surgery. The regions of interest (solid line rectangles) are enlarged below every image, and the areas of labeled FGF21 MSCs are marked with blue dotted line outlines, whereas those of the non-labeled FGF21 MSCs are marked with red dotted line outlines. The corresponding signal intensities versus echo times graph of the T2*-weighted MRI images (T2S-Weighted) are also shown. |
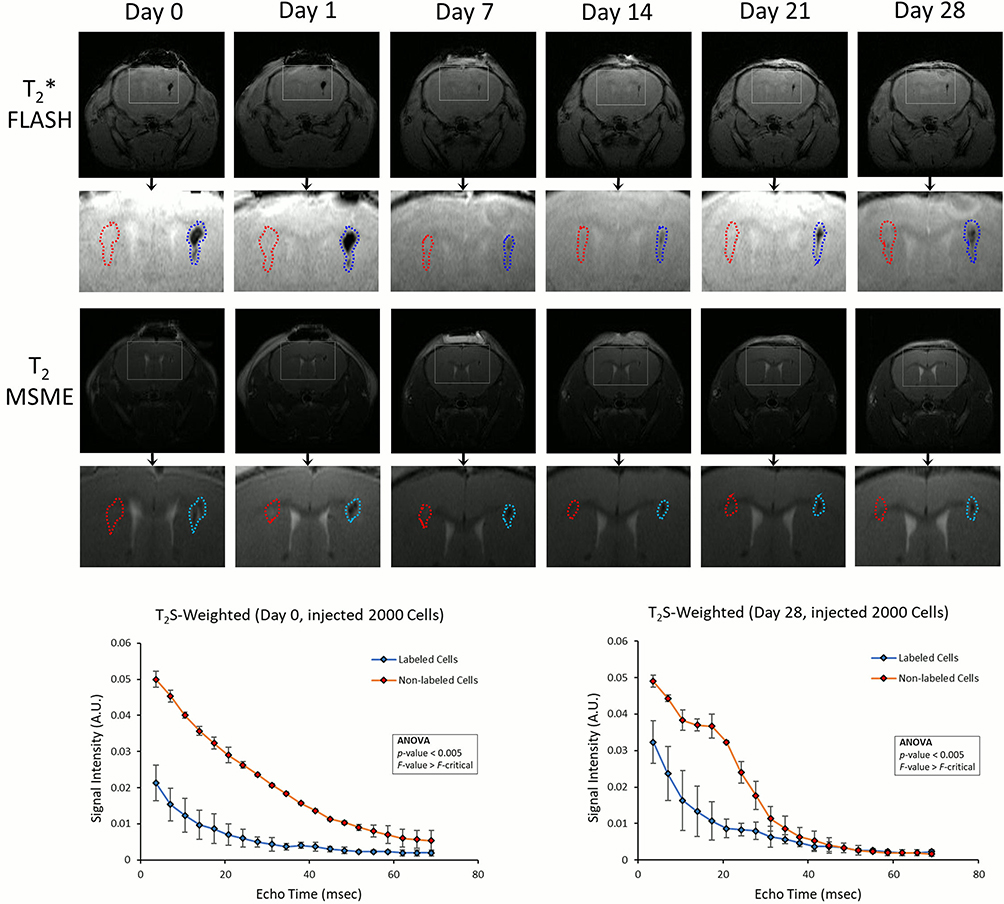 |
Figure 7 Representative T2*- and T2-weighted MRI images acquired using FLASH gradient echo and MSME sequence protocols, respectively, of live mice brains implanted stereotaxically with labeled (using 25 µg/mL of IO-MI NPs in media without FBS supplementation) (right side) and non-labeled (left side) FGF21 MSCs of counts of 2000 cells suspended in 2 µL aliquots of PBS solution, acquired at days 0, 1, 7, 14, 21, and 28 after surgery. The regions of interest (solid line rectangles) are enlarged below every image, and the areas of labeled FGF21 MSCs are marked with blue dotted line outlines, whereas those of the non-labeled FGF21 MSCs are marked with red dotted line outlines. The corresponding signal intensities versus echo times graph of the T2*-weighted MRI images (T2S-Weighted) are also shown. |
To investigate whether the decrease in MRI signal by the labeled cells will stay long enough to serve the purpose of longitudinal tracking, we acquired images using both MRI sequences of the smallest cell count (2000 cells) at different time points until 28 days after transplantation. We observed that both T2* FLASH and T2 MSME sequences could detect the cells at all time points up to 28 days post-transplantation, and that the cells did not migrate to other regions of the brain and were confined to the regions of implantation. We observed that both T2* FLASH and T2 MSME sequences produced gradual exponential signal decay for the labeled cells. Signal intensities of both sequences were statistically significantly less than those of the non-labeled cells of the same count indicating that these sequences are capable of distinguishing small number of labeled cells (Figure 7). Such results indicate that the labeled FGF21 MSCs have strong T2 contrast capabilities compared to non-labeled cells and that the MRI sequences are suitable for detection of small counts of labeled cells, which will be suitable for further homing and cell tracking studies.
Discussion
An integral component of the development of therapeutic stem cells in the regenerative medicine field is to establish protocols for monitoring the transplanted cells continuously and non-invasively to evaluate their therapeutic efficiency. There are mainly two stages needed to monitor the transplanted cells in vivo. The first stage is to label the therapeutic cells with an agent that imparts imaging properties to cells and the second one is to utilize a suitable medical imaging modality to track and monitor the labeled cells.
This study aims to establish and characterize optimized protocols to monitor MSCs using a genetically engineered MSCs model labeled with iron oxide nanoparticles and visualized using MRI. To the best of our knowledge, there is no clinically approved iron oxide nanoparticle formulation to label MSCs (most clinically approved iron oxide nanoparticles were discontinued from the market due to safety or other reasons,31 and the usage of the FDA-approved Ferumoxytol iron oxide nanoparticles to label the cells for MRI applications is considered as an “off label” use because it is only approved clinically to treat anemia patients with kidney diseases32,33), and hence it is vital to fill this missing gap and present potential labeling formulations to the research community for further investigations.
In this study, we used two MSC types derived from bone marrow of C57BL/6 mice and genetically engineered to produce either FGF21 and mCherry or mCherry alone, with the aim of utilizing such cells in traumatic brain injury research by our group. We selected three commercial iron oxide nanoparticles formulations and tested their labeling efficiencies at the same conditions, and found that two of the formulations (IO-S NPs and IO-TN NPs) produced aggregates of nanoparticles outside cells and showed less internalization into the cells compared to the third formulation (IO-MI NPs); the aggregations observed with the two formulations might have been due to the surface charges and colloidal stability of nanoparticles in serum-containing media.24
Regarding labeling MSCs with IO-MI NPs, we found that the cellular uptake of nanoparticles is concentration-dependent and a concentration of 25 µg/mL of IO-MI NPs achieved an optimum labeling of cells with minimal extracellular aggregations; these results are in line with those of Taylor et al.34 To reduce any aggregation of IO-MI NPs, we tested their properties in media with or without FBS supplementation and found that the presence of FBS in labeling media enhances the aggregation of IO-MI NPs, which were confirmed with the prussian blue staining and confocal laser scanning microscopy of labeled cells, and the TEM imaging of the nanoparticles incubated in the labeling media. This aggregation of nanoparticles might have happened due to formation of protein coronas around nanoparticles in serum-containing media, which alters their physicochemical properties and hydrodynamic sizes.35 After determining the optimum labeling conditions, we visualized the labeled MSCs of both types by confocal laser scanning microscopy and found the nanoparticles to localize in the perinuclear space and to be absent from nuclei of cells. We evaluated the efficiency of the optimized labeling conditions with flow cytometry and found that labeling was uniform among cells, which was evident from narrow peaks of the fluorescence intensity histograms. Also, flow cytometry showed that about 98% of the cells were labeled with the nanoparticles, and that they showed strong fluorescence signal intensity shift of their peaks as well as statistically significantly higher mean signal intensity values compared to the non-labeled cells. Our results of the confocal laser scanning microscopy and flow cytometry are in agreement with a previous report.34
To evaluate the effects of labeling on the biological properties of MSCs, we observed that labeling MSCs with increasing concentrations (up to 50 µg/mL) of IO-MI NPs did not reduce their cell viability. In fact, the viability of cells increased slightly; this observation was previously reported with other iron oxide nanoparticle formulations by other groups and it may be due to the facts that iron can accelerate and not arrest the cell cycle, and has peroxidase-like activity which breaks down the cellular H2O2 and hence stimulates cell growth.15,36 On the other side, Umashankar et al reported that labeling the neural stem cells with Molday ION Rhodamine B iron oxide nanoparticle formulation reduced the viability of cells at a concentration of 50 µg/mL;20 however, we cannot relate their finding to our results because they used different types of tested cells and nanoparticle formulations. Moreover, we found that labeling MSCs with IO-MI NPs slightly reduced the amounts of FGF21 (amounts produced by labeled cells were about 91% of those produced by non-labeled cells). There are no published data regarding this finding to compare our results to, but we believe that the amounts of produced protein are enough to produce regenerative therapeutic effects, as we observed from our unpublished data of other projects.
The effects of labeling stem cells with iron oxide nanoparticles on the differentiation capacity of cells are variable and depends on several factors including the type of nanoparticles, concentration of iron oxide, duration of labeling, and type of tested cells,20,34,37 so careful design and evaluation of the labeling protocols are necessities. For the differentiation capabilities of both types of our MSCs, we observed that labeling the cells with IO-MI NPs did not affect their capabilities of osteogenic and adipogenic differentiation. These observations are in agreement with Taylor et al34 who used the same type of iron oxide formulation to label MSCs.
Collectively, our findings indicate that the optimized labeling protocol we developed did not alter the viability of cells, and their capabilities of expressing FGF21 and osteogenic and adipogenic differentiation, and hence the used protocol has the potential of labeling MSCs safely without altering their biological characteristics.
To evaluate the efficiency of labeled MSCs for MRI applications, we tested the signal intensities of different counts of labeled cells embedded in agarose phantoms at different echo times and compared them to zero cell control phantoms using T2 MSME sequence. We found that the decay in signal is correlated to the number of labeled cells, and that the scan parameters were sensitive enough to visualize about 175 labeled cells. There are published studies that reported different limits of sensitivity of detection for lower number of cells;19,38 however, we cannot compare their findings to ours due to any of the following factors: different magnetic field strength of MRI scanners, varying MRI sequence protocols, distinct cell types, different nanoparticle formulations, and postprocessing of images. For in vivo live imaging of mice brains, we did not use the same scan sequence protocols we used for phantoms due to long scan times which were not suitable for live animals. We used T2* FLASH and T2 MSME sequences to visualize the mice brains. We observed that both sequences could visualize all numbers of labeled cells clearly as hypointense regions in the transplantation area. The hypointense regions of the labeled cells decreased gradually with time but were persistent for all time points up to 28 days post transplantation. On the other side, the non-labeled cells did not show hypointense regions similar to those observed with the labeled cells; however, there were minor magnetic field distortions along the needle and injection sites, similar to the findings of Namestnikova et al38 and Brisset et al.39 We observed “blooming effect” which decreased with time in images acquired using T2* FLASH sequence for higher number of labeled cells, denoted by spread of the hypointense regions due to disturbance of the magnetic field of a region bigger than that occupied by the cells by iron nanoparticles.38 Although the T2* FLASH sequence was sensitive enough to detect 2000 labeled cells, it did not show clear anatomical structures of the brain. Whereas, the T2 MSME sequence was not as sensitive as the T2* FLASH sequence in detecting small numbers of labeled cells; it showed more clear anatomical structures of the brain and more realistic sizes of the transplanted cells regions. Therefore, the use of the two sequences is complementary to visualize the transplanted cells to get the benefits and avoid the drawbacks of both sequences. Although it was possible for our scanning protocols to detect smaller numbers of labeled MSCs, we decided not to use less than 2000 cells because at lower number of cells, the hypointense regions will not be reliably distinguishable from the needle injection sites and hemorrhages. Also, the counts of therapeutic stem cells used in research are usually much more than 2000 cells, so we believe that visualizing this number of cells is enough to serve our purpose of tracking the therapeutic stem cells. Collectively, the MRI data demonstrated that the engineered MSCs labeled with IO-MI NPs according to our optimized protocol could be monitored non-invasively in vivo over an extended period of 4 weeks.
Conclusion
This study presents a facile optimized magnetic labeling platform for cells and in vivo MRI visualization model for tracking and monitoring cells to assist the bench-to-bedside translation of therapeutic stem cells. Our carefully standardized protocols presented in this manuscript resulted in efficient labeling of the cells that did not alter their viability, expression of FGF21 (neuroprotective) or differentiation capabilities, and demonstrated the capacity for in vitro and long-term in vivo MRI visualization and tracking of the labeled MSCs with high sensitivity for various regenerative medicine applications.
Acknowledgments
This study was partly funded by the Taipei Medical University project TMU107-AE1-B17, National Health Research Institutes projects NHRI-EX107-10732NI, MG-106-SP-07, MG-105-SP-07, and Taipei Medical University Hospital projects 105TMUH-SP-01 and 106TMUH-SP-04. The authors would like to thank Prof. Cheng-Yu Chen for providing laboratory work bench and financial support to this study, Mahmoud Ashraf Fikry Fathy Askar for his help to plot the graphs and perform the statistical calculations, Chun-Hsien Chen for his technical assistance to carry on experiments, Wen-Chie Wu for operating the MRI scanner, and Bassam Mohamed Mohamed Reda Mohamed Taher and Basel Ashraf Fikry Fathy Askar for filming, editing, and producing the video abstract of this manuscript.
Disclosure
The authors report no conflicts of interest in this work.
References
1. Vissers C, Ming G-L, Song H. Nanoparticle technology and stem cell therapy team up against neurodegenerative disorders. Adv Drug Deliv Rev. 2019. doi:10.1016/j.addr.2019.02.007
2. Aboutaleb N, Faezi M, Nasseri Maleki S, Nazarinia D, Razavi Tousi SMT, Hashemirad N. Conditioned medium obtained from mesenchymal stem cells attenuates focal cerebral ischemia reperfusion injury through activation of ERK1/ERK2-BDNF signaling pathway. J Chem Neuroanat. 2019;97:87–98.
3. Lejkowska R, Kawa MP, Pius-Sadowska E, et al. Preclinical evaluation of long-term neuroprotective effects of BDNF-engineered mesenchymal stromal cells as intravitreal therapy for chronic retinal degeneration in Rd6 mutant mice. Int J Mol Sci. 2019;20:3. doi:10.3390/ijms20030777
4. Matsuda Y, Sasaki M, Kataoka-Sasaki Y, et al. Intravenous infusion of bone marrow–derived mesenchymal stem cells reduces erectile dysfunction following cavernous nerve injury in rats. Sexual Med. 2018;6(1):49–57. doi:10.1016/j.esxm.2017.10.005
5. Gong XH, Liu H, Wang SJ, Liang SW, Wang GG. Exosomes derived from SDF1-overexpressing mesenchymal stem cells inhibit ischemic myocardial cell apoptosis and promote cardiac endothelial microvascular regeneration in mice with myocardial infarction. J Cell Physiol. 2019.
6. Chierchia A, Chirico N, Boeri L, et al. Secretome released from hydrogel-embedded adipose mesenchymal stem cells protects against the Parkinson’s disease related toxin 6-hydroxydopamine. Eur J Pharm Biopharm. 2017;121:113–120. doi:10.1016/j.ejpb.2017.09.014
7. Leng Y, Wang Z, Tsai LK, et al. FGF-21, a novel metabolic regulator, has a robust neuroprotective role and is markedly elevated in neurons by mood stabilizers. Mol Psychiatry. 2015;20(2):215–223. doi:10.1038/mp.2013.192
8. Berglund ED, Li CY, Bina HA, et al. Fibroblast growth factor 21 controls glycemia via regulation of hepatic glucose flux and insulin sensitivity. Endocrinology. 2009;150(9):4084–4093. doi:10.1210/en.2009-0221
9. Inagaki T, Dutchak P, Zhao G, et al. Endocrine regulation of the fasting response by PPARalpha-mediated induction of fibroblast growth factor 21. Cell Metab. 2007;5(6):415–425. doi:10.1016/j.cmet.2007.05.003
10. De Becker A, Riet IV. Homing and migration of mesenchymal stromal cells: how to improve the efficacy of cell therapy? World J Stem Cells. 2016;8(3):73–87. doi:10.4252/wjsc.v8.i3.73
11. Ankrum J, Karp JM. Mesenchymal stem cell therapy: two steps forward, one step back. Trends Mol Med. 2010;16(5):203–209. doi:10.1016/j.molmed.2010.02.005
12. Zheng Y, Huang J, Zhu T, et al. Stem cell tracking technologies for neurological regenerative medicine purposes. Stem Cells Int. 2017;2017:9. doi:10.1155/2017/2934149
13. Leibacher J, Henschler R. Biodistribution, migration and homing of systemically applied mesenchymal stem/stromal cells. Stem Cell Res Ther. 2016;7:7. doi:10.1186/s13287-015-0271-2
14. Xu C, Mu L, Roes I, et al. Nanoparticle-based monitoring of cell therapy. Nanotechnology. 2011;22(49):494001. doi:10.1088/0957-4484/22/49/494001
15. Lu C-W, Hsiao J-K, Liu H-M, Wu C-H. Characterization of an iron oxide nanoparticle labelling and MRI-based protocol for inducing human mesenchymal stem cells into neural-like cells. Sci Rep. 2017;7(1):3587. doi:10.1038/s41598-017-03863-x
16. Heryanto YD, Achmad A, Taketomi-Takahashi A, Tsushima Y. In vivo molecular imaging of cancer stem cells. Am J Nucl Med Mol Imaging. 2015;5(1):14–26.
17. Liu S, Tay LM, Anggara R, Chuah YJ, Kang Y. Long-term tracking mesenchymal stem cell differentiation with photostable fluorescent nanoparticles. ACS Appl Mater Interfaces. 2016;8(19):11925–11933. doi:10.1021/acsami.5b12371
18. Dabrowska S, Del Fattore A, Karnas E, et al. Imaging of extracellular vesicles derived from human bone marrow mesenchymal stem cells using fluorescent and magnetic labels. Int J Nanomedicine. 2018;13:1653–1664.
19. Ariza de Schellenberger A, Kratz H, Farr TD, et al. Labeling of mesenchymal stem cells for MRI with single-cell sensitivity. Int J Nanomedicine. 2016;11:1517–1535.
20. Umashankar A, Corenblum MJ, Ray S, et al. Effects of the iron oxide nanoparticle Molday ION Rhodamine B on the viability and regenerative function of neural stem cells: relevance to clinical translation. Int J Nanomedicine. 2016;11:1731–1748.
21. Mishra SK, Khushu S, Gangenahalli G. Biological effects of iron oxide-protamine sulfate complex on mesenchymal stem cells and its relaxometry based labeling optimization for cellular MRI. Exp Cell Res. 2017;351(1):59–67. doi:10.1016/j.yexcr.2016.12.025
22. Babic M, Horak D, Trchova M, et al. Poly(L-lysine)-modified iron oxide nanoparticles for stem cell labeling. Bioconjug Chem. 2008;19(3):740–750. doi:10.1021/bc700410z
23. Walczak P, Kedziorek DA, Gilad AA, Lin S, Bulte JW. Instant MR labeling of stem cells using magnetoelectroporation. Magn Reson Med. 2005;54(4):769–774. doi:10.1002/mrm.20701
24. Barrow M, Taylor A, Murray P, Rosseinsky MJ, Adams DJ. Design considerations for the synthesis of polymer coated iron oxide nanoparticles for stem cell labelling and tracking using MRI. Chem Soc Rev. 2015;44(19):6733–6748. doi:10.1039/C5CS00331H
25. Ali AAA, Hsu F-T, Hsieh C-L, et al. Erlotinib-conjugated iron oxide nanoparticles as a smart cancer-targeted theranostic probe for MRI. Sci Rep. 2016;6:36650. doi:10.1038/srep36650
26. Ali AA, Lee YR, Chen TC, et al. Novel Anthra[1,2-c][1,2,5]Thiadiazole-6,11-Diones as promising anticancer lead compounds: biological evaluation, characterization & molecular targets determination. PLoS ONE. 2016;11(4):e0154278. doi:10.1371/journal.pone.0154278
27. Liang Q, Zhong L, Zhang J, et al. FGF21 maintains glucose homeostasis by mediating the cross talk between liver and brain during prolonged fasting. Diabetes. 2014;63(12):4064–4075. doi:10.2337/db14-0541
28. Han I, Kwon B-S, Park H-K, Kim KS. Differentiation potential of mesenchymal stem cells is related to their intrinsic mechanical properties. Int Neurourol J. 2017;21(Suppl 1):S24–S31. doi:10.5213/inj.1734856.428
29. Huang J, Zhao L, Xing L, Chen D. MicroRNA-204 regulates Runx2 protein expression and mesenchymal progenitor cell differentiation. Stem Cells. 2010;28(2):357–364.
30. Loye AM, Kinser ER, Bensouda S, et al. Regulation of mesenchymal stem cell differentiation by nanopatterning of bulk metallic glass. Sci Rep. 2018;8(1):8758. doi:10.1038/s41598-018-27098-6
31. Jasmin, de Souza GT, Louzada RA, Rosado-de-Castro PH, Mendez-Otero R, Campos de Carvalho AC. Tracking stem cells with superparamagnetic iron oxide nanoparticles: perspectives and considerations. Int J Nanomedicine. 2017;12: 77–93.
32. Nejadnik H, Pandit P, Lenkov O, Lahiji AP, Yerneni K, Daldrup-Link HE. Ferumoxytol can be used for quantitative magnetic particle imaging of transplanted stem cells. Mol Imaging Biol. 2019;21(3):465–472. doi:10.1007/s11307-018-1276-x
33. Bernsen MR, Guenoun J, van Tiel ST, Krestin GP. Nanoparticles and clinically applicable cell tracking. Br J Radiol. 2015;88(1054):20150375. doi:10.1259/bjr.20150375
34. Taylor A, Herrmann A, Moss D, et al. Assessing the efficacy of nano- and micro-sized magnetic particles as contrast agents for MRI cell tracking. PLoS ONE. 2014;9(6):e100259. doi:10.1371/journal.pone.0100259
35. Daldrup-Link HE. Ten things you might not know about iron oxide nanoparticles. Radiology. 2017;284(3):616–629. doi:10.1148/radiol.2017162759
36. Huang DM, Hsiao JK, Chen YC, et al. The promotion of human mesenchymal stem cell proliferation by superparamagnetic iron oxide nanoparticles. Biomaterials. 2009;30(22):3645–3651. doi:10.1016/j.biomaterials.2009.03.032
37. Kasten A, Gruttner C, Kuhn JP, Bader R, Pasold J, Frerich B. Comparative in vitro study on magnetic iron oxide nanoparticles for MRI tracking of adipose tissue-derived progenitor cells. PLoS ONE. 2014;9(9):e108055. doi:10.1371/journal.pone.0108055
38. Namestnikova D, Gubskiy I, Kholodenko I, et al. Methodological aspects of MRI of transplanted superparamagnetic iron oxide-labeled mesenchymal stem cells in live rat brain. PLoS ONE. 2017;12(10):e0186717. doi:10.1371/journal.pone.0186717
39. Brisset JC, Desestret V, Marcellino S, et al. Quantitative effects of cell internalization of two types of ultrasmall superparamagnetic iron oxide nanoparticles at 4.7 T and 7 T. Eur Radiol. 2010;20(2):275–285. doi:10.1007/s00330-009-1572-6
 © 2020 The Author(s). This work is published and licensed by Dove Medical Press Limited. The
full terms of this license are available at https://www.dovepress.com/terms
and incorporate the Creative Commons Attribution
- Non Commercial (unported, 3.0) License.
By accessing the work you hereby accept the Terms. Non-commercial uses of the work are permitted
without any further permission from Dove Medical Press Limited, provided the work is properly
attributed. For permission for commercial use of this work, please see paragraphs 4.2 and 5 of our Terms.
© 2020 The Author(s). This work is published and licensed by Dove Medical Press Limited. The
full terms of this license are available at https://www.dovepress.com/terms
and incorporate the Creative Commons Attribution
- Non Commercial (unported, 3.0) License.
By accessing the work you hereby accept the Terms. Non-commercial uses of the work are permitted
without any further permission from Dove Medical Press Limited, provided the work is properly
attributed. For permission for commercial use of this work, please see paragraphs 4.2 and 5 of our Terms.