Back to Journals » Clinical Ophthalmology » Volume 14
Effects on IOL Power Calculation and Expected Clinical Outcomes of Axial Length Measurements Based on Multiple vs Single Refractive Indices
Authors Shammas HJ ![]() , Shammas MC
, Shammas MC ![]() , Jivrajka RV, Cooke DL
, Jivrajka RV, Cooke DL ![]() , Potvin R
, Potvin R ![]()
Received 8 April 2020
Accepted for publication 22 May 2020
Published 4 June 2020 Volume 2020:14 Pages 1511—1519
DOI https://doi.org/10.2147/OPTH.S256851
Checked for plagiarism Yes
Review by Single anonymous peer review
Peer reviewer comments 2
Editor who approved publication: Dr Scott Fraser
H John Shammas,1,2 Maya C Shammas,2 Renu V Jivrajka,2 David L Cooke,3 Richard Potvin4
1Department of Ophthalmology, The Keck School of Medicine of the University of Southern California, Los Angeles, CA, USA; 2Shammas Eye Medical Center, Lynwood, CA, USA; 3Great Lakes Eye Care, St. Joseph, MI 49085, USA; 4Science in Vision, Akron, NY, USA
Correspondence: H John Shammas
Shammas Eye Medical Center, 3510 Martin Luther King Jr. Blvd., Lynwood, CA 90262, USA
Email [email protected]
Purpose: To compare axial length measurements based on multiple specific refractive indices for each segment of the eye to those obtained using a single refractive index for the entire eye and to evaluate the subsequent effects on IOL power calculation.
Setting: One site in Lynwood, CA.
Design: Single-arm, non-interventional, non-randomized retrospective chart review.
Methods: Eyes undergoing cataract surgery where biometry and IOL power calculations were based on axial length calculated with multiple specific refractive indices (multiple) were evaluated. A simulated axial length based on using a single refractive index was calculated for each case (single). The expected residual refractions based on different IOL formulas were calculated for both single and multiple groups. Formulas were then optimized, and the mean prediction errors (MPE) and mean absolute prediction errors (MAE) were calculated, based on the difference between the (optimized) expected value and the actual refractive outcome.
Results: A total of 595 eligible eyes were evaluated. Differences between the axial lengths determined in the single and multiple groups ranged from +0.28 mm to − 0.14 mm, with a significant correlation between the difference in AL and average AL (r2 = 0.73, p < 0.001). AL differences between groups were statistically significant in long and short eyes (p < 0.001) but not in average eyes or overall (p > 0.25). In nearly all cases, the average MPE in the multiple group was lower than that for the single group across all axial lengths and formulas. When larger differences in MAE were present, the multiple group results were more often lower (better).
Conclusion: Differences were found between axial lengths calculated using a single refractive index and multiple refractive indices, mainly in the short and long eyes. Differences had some effect on IOL power calculation. Such effects may become increasingly important as the precision of formulas increases.
Keywords: IOL power calculation, biometry, axial length, sum of segments, refractive index, optical coherence tomography
Plain Language Summary
During typical cataract surgery, the clouded natural lens of the eye is removed and replaced with an intraocular lens, or IOL. The surgeon can plan how much power this lens may have, so that most patients will not need glasses or contact lenses to see well at distance. A critical measurement for IOL power calculation is the overall length of the eye. Measuring this is challenging, because it must be done from outside the eye. In addition, the effective length of the eye is different from the actual length, because the various components of the eye have different refractive indices. (Consider a spoon in a glass of water. From the side, the spoon looks bent, because the refractive index of water is different than air.) This study was conducted to see whether an average refractive index for the whole eye was as good for surgical planning as considering the refractive indices for all the parts of the eye separately (i.e. multiple indices).
Our results showed that the use of multiple refractive indices was likely to reduce the error in IOL power calculation, but not significantly, except in shorter and longer eyes where there was expected improvement in power calculations with the multiple refractive indices. As measurement technology improves, and the calculation formulas improve, these small differences may become more important.
Introduction
Most patients presenting for cataract surgery and most surgeons performing the procedure have an expectation that the patient’s dependence on spectacles or contact lenses for distance vision will be significantly reduced or eliminated. Using modern diagnostic instrumentation and intraocular lens (IOL) power calculations, it is not uncommon for 70–80% of eyes to be within 0.50D of their intended correction.1,2 Achieving a near-emmetropic outcome is particularly important when toric and/or presbyopia-correcting IOLs are implanted because the relative benefit of these advanced technology IOLs is best appreciated when the patient’s refraction is near plano.
A key factor in successful IOL power calculation is accurate biometry, with axial length (AL) being one of the most critical components.3 The prediction error of IOL power is significantly associated with axial length measurement in most of the third-generation formulas in common use.4
The IOLMaster 500 (Carl Zeiss Meditec, Jena, Germany) uses partial coherence interferometry5 (PCI) with a 780 nm laser diode infrared light to measure the optical path length (OPL). The OPL is then converted to a geometrical path length using a single variable regression equation, thus allowing the PCI biometer’s AL output to match the same AL measured with immersion ultrasound.6 The Lenstar LS900 (Haag-Streit AG, Koeniz, Switzerland) uses optical low-coherence reflectometry7 (OLCR) with an 820 nm superluminescent diode to measure the OPL. The OPL is then converted to a geometric path length using a single refractive index for the entire eye.8 When different components of the eye are more variable (e.g. thicker lens, deeper anterior chamber), this single refractive index may be suboptimal.
The Argos® (MOVU, Santa Clara, CA) swept-source optical coherence tomographer (SS-OCT) uses a 1060 nm wavelength and a 20 nm bandwidth swept-source technology to collect 2-dimensional OCT data of the full eye.9,10 More importantly, it measures the OPL of each segment of the eye and uses a specific refractive index (SRI) for each of these segments (cornea, anterior chamber, lens and vitreous). As such, when there are variations in the relative lengths of these components, the axial length calculation is appropriately adjusted. In two recent studies,8,11 the refractive accuracy of most formulas was higher in eyes measured with a specific refractive index for each segment of the eye (referred to as segmented AL8 and sum-of-segments AL11) than in eyes measured with a single refractive index for the entire eye (referred to as the OLCR displayed AL8 and traditional AL11); this increase in the formulas’ refractive accuracy was more evident in the short and long eyes.
The purpose of this retrospective study is two-fold: (1) to compare the AL as measured by the Argos SS-OCT biometer (using multiple indices of refraction specific to each component of the eye, also termed sum-of-segments) to a measurement that simulates an AL measured with a single refractive index as performed in the Lenstar biometer, and (2) to compare the postoperative results (6 to 8 weeks after surgery) achieved in eyes that underwent cataract surgery and where the IOL power calculations were performed with an axial length based on sum-of-segments to the same eyes where the IOL power calculations were performed with the simulated AL from a single refractive index.
Patients and Methods
This was a comparative non-interventional study comprising a single-arm retrospective chart review of patients with a history of cataract surgery at one center. The comparator was a simulated variable derived from the available clinical data. The study was approved by the Milkie-Shammas Surgery Center Institutional Review Board (Lynwood, CA). A waiver of informed consent was granted to allow the use of de-identified patient data. Data were collected in a manner consistent with the tenets of the Declaration of Helsinki. Sample size calculations suggested a minimum of 388 eyes should be included in the data set.
Eligible charts were those from patients that have had previous uncomplicated cataract surgery where the biometry and IOL calculations were performed using the Argos device that also had a postoperative clinical outcomes data (visual acuity and refraction). To reduce variability related to the IOL implanted, only eyes receiving the SN60WF aspheric monofocal lens (Alcon, Fort Worth, TX) were included. Eyes with clinically significant ocular pathology other than residual refractive error (e.g., macular degeneration, advanced glaucoma) were excluded. Eyes with suboptimal surgical outcomes that were not related to the treatment plan (e.g., capsular tear, cystoid macular edema and wound leaks necessitating corneal suturing) were also excluded. In addition, the best-corrected visual acuity in the eye had to be 20/40 or better, to reduce the likelihood of variability in the postoperative refraction. If both eyes of a patient were eligible to be included in the study, only the first operated eye was included.
Both manual and electronic data records were used to identify a consecutive series of eyes that fit the inclusion and exclusion criteria above. De-identified data from the preoperative examination and the 6–8 week postoperative examination were collected, including age, sex, postoperative refraction and best-corrected visual acuity. The biometric data retrieved from the Argos biometer included the displayed AL (ALSRI, in this study termed ALmultiple), the central corneal thickness (CCT), the aqueous depth (AD), the anterior chamber depth (ACD), the lens thickness (LT), the corneal diameter (CD) and the average keratometric readings. The surgical treatment data, IOL power calculations and power of the IOL implanted were also recorded. The expected residual refractive errors using each formula available on the biometer were calculated.
ALSingle is calculated from the Argos eye measurements by algebraically rearranging the Cooke-modified AL (CMAL) equation,12 as follows below. CMAL has the advantage of being wavelength-independent because it uses geometric path lengths and not optical path lengths. The displayed axial length from the Argos biometer uses the following indices of refraction: 1.375 for the cornea, 1.336 for the aqueous depth and for the vitreous, and 1.41 for the lens. We then used CMAL in reverse to calculate ALSingle, a measurement that simulates an AL measured with the OLCR biometer. CMAL is a published formula which was designed to convert traditional AL from the Lenstar OLCR biometer to segmental Cooke-modified AL11 where:
Solving this formula in reverse, it will read:
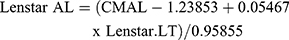
In our study, – ALMultiple replaces the CMAL, ALSingle replaces the Lenstar AL and the Argos LT replaces the Lenstar LT. A 0.0107 mm was also added to the calculated value; the nature of the methodology is such that a mean difference between the two methods would be expected to be zero. Hence,
where ALMultiple represents the Argos AL and ALSingle represents the simulated AL. From this point, the ALMultiple group is referred to as the “Multiple” group and the ALSingle group is referred to as the “Single” group, reflecting the number of refractive indices in each.
With all biometry values besides the AL kept the same for each eye, the expected residual refractions based on different IOL formulas were calculated in each eye for both the single and multiple groups. Formulas included those available as built-in options on the biometer: Barrett Universal II,13 Haigis,14 Hoffer Q,15 Holladay116 and SRK/T.17 Using the actual postoperative refraction, the lens constants for all formulas were optimized for both AL groups. This optimization ensured that the mean prediction error would be zero for each formula and each AL data set. Prediction errors were then calculated by subtracting the expected from the actual post-operative refraction; therefore, a positive number signifies an unexpected hyperopic result and a negative number signifies an unexpected myopic result.
Measures of interest with regard to the prediction errors were the mean prediction error (MPE) and the mean absolute prediction error (MAE). Also, of interest were the percentages of eyes with an absolute prediction error (AE) ≤0.25 D, ≤0.50 D, ≤0.75 D and ≤1.00 D by AL group and formula. The association of prediction error with axial length was evaluated for both AL groups. Categorical analyses based on axial length were also performed: the axial length data were divided into Short (<22 mm), Normal (22–25 mm) and Long (>25 mm) subgroups, using the single group results. All calculations were performed on the entire data set and on these three subgroups.
A Bland-Altman plot was used to compare the axial length measurements from the two groups (single and multiple). The McNemar test was used to analyze differences between the predicted errors as suggested by Wang et al.18 The statistical analyses were performed using Statistica, version 12 (TIBCO Software Inc., Palo Alto, CA, USA). Recognizing the potential confounding effect of multiple tests, all statistical tests of hypotheses were based on a level of significance of alpha=0.01. Below this level the actual p values are reported.
Results
Charts from a total of 595 consecutive eligible eyes were identified for inclusion in the data set.
Table 1 shows the lens constants that were used in the study. Note that the “lens factor” in Barrett’s formula, the “pACD” in Hoffer Q formula, the “sf” in Holladay 1 formula and the “A constant” in the SRK/T formula remain the same, while the “a0, a1, a2” in Haigis formula are different due to the triple optimization of these constants.
 |
Table 1 Lens Constants Used in the Two Groups |
Table 2 summarizes the details of the cohort. The last three rows show the aggregate statistics for the AL, calculated based on the methods described above, and the difference between the multiple and single AL groups. As expected from the methodology used, the mean AL difference was zero. However, the differences in AL measurements in individual eyes ranged from −0.14 mm to +0.28 mm. Figure 1 shows a Bland-Altman plot of the differences between single and multiple groups as a function of the average of both. There is a clear correlation between the difference in AL and average AL (r2 = 0.73, p < 0.001). Table 3 shows the distribution of the AL measurements for all eyes and the axial length categories (Short, Average, Long) by study group (multiple or single). As expected from the methodology, there was no statistically significant difference in the AL measured by group for all eyes. There were statistically significant differences in the AL between the multiple and single groups in both the Short and Long eyes, with the single group having slightly shorter ALs in the Short eyes and slightly longer ALs in the Long eyes, consistent with Figure 1.
 |
Table 2 Patient/Eye Cohort Baseline Characteristics |
 |
Table 3 Axial Lengths by Category (mm) |
 |
Figure 1 Bland-Altman plot of difference in axial length (Multiple – Single) by average axial length. |
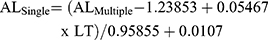
Table 4 summarizes the MPE and MAE by formula and axial length category. Shaded pairs of cells with bold text indicate data that were statistically significantly different, using the McNemar test and a p-value of ≤0.01; values below this threshold are shown in the table. In all cases where statistically significant differences were found, results indicated that the multiple group had a higher percentage of eyes inside the cutoff values. With one exception (Barrett, Long Eyes), the median absolute prediction error was lower for the multiple group. Within the group of long eyes, 17 eyes exceeded 26 mm. In this smaller group, the MRE, MAE and MedAE were substantially lower in the multiple group versus the single group, and the percentage of eyes within 0.25D and 0.50D were higher in all but a few instances. The number of cases was too low to permit any meaningful statistical analysis.
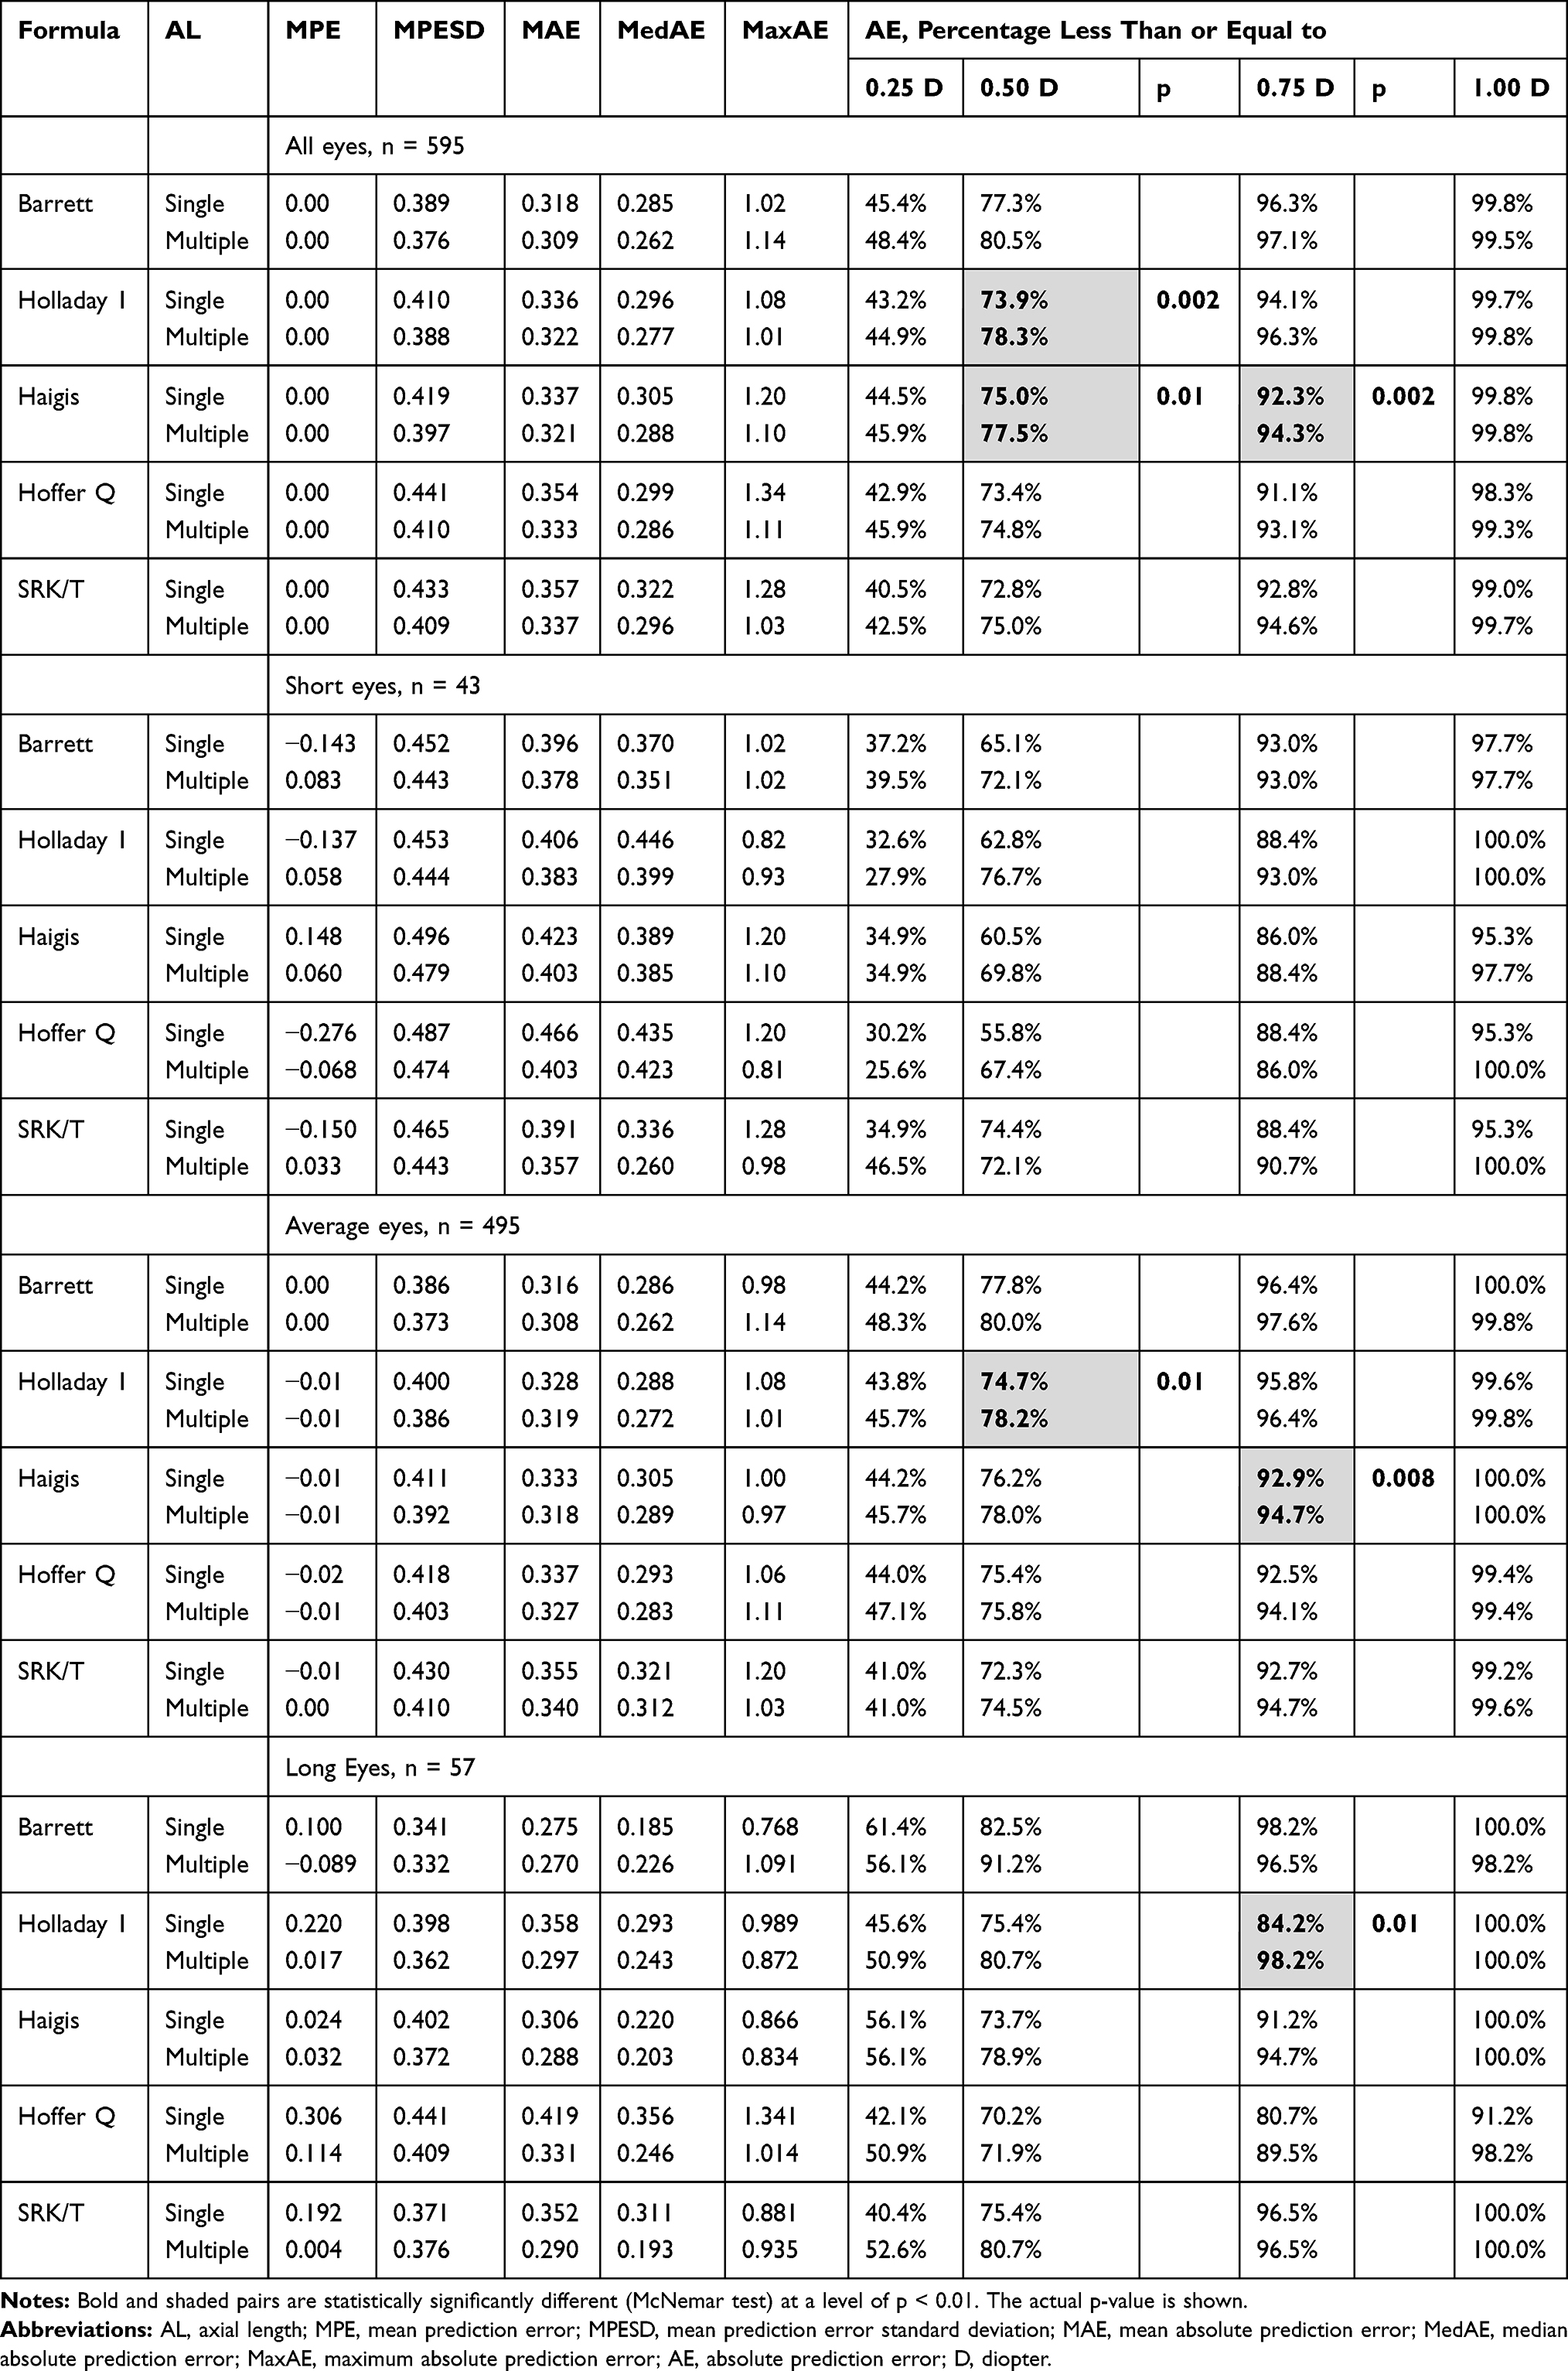 |
Table 4 Summary Data |
Table 5 shows the categorization of AE differences by formula, indicating for each formula whether the AE was lower (better) for the single group or the multiple group. Looking at all eyes, AE was lower for the multiple group in 53.8% to 62.2% of cases. More importantly, perhaps, is that in those eyes where the average difference of AEs between the two groups exceeded 0.50D (an arbitrary cutoff), the AE in the multiple group was lower in 63.3% to 76.6% of cases.
 |
Table 5 Absolute Error Categorization |
Discussion
The present study confirms initial findings of a previous study9 from the same center where AL measurements from the SS-OCT biometer were compared to the measurements obtained by PCI and OLCR in 107 eyes. In that study, there was general agreement between the AL measurements taken by the SS-OCT unit and those taken by the PCI and OLCR units with a correlation coefficient of 1.00 compared with both instruments; however, both the PCI and the OLCR yielded slightly longer measurements in long eyes and slightly shorter measurements in short eyes. The effect of these differences on IOL power calculation and expected clinical outcomes were not evaluated in this study.
To calculate ALSingle in our study, we used the CMAL equation in reverse with some adjustments.11,12 We favored the CMAL equation over the Haigis equation6 where those refractive indices were derived for an OPL measured with a wavelength of 780 nm comparing the measurements to immersion ultrasound. CMAL uses lengths from the machine printout which have already had an adjustment for the wavelength being used. We substituted the Lenstar LT for the Argos LT; in a previous study, the two values were comparable.7 We also had to add 0.0107 mm to the calculated value to equalize the means of ALMultiple and ALSingle. This also insured that the lens constants in the Barrett, Hoffer Q, Holladay 1 and SRK/T formulas are the same in both groups. The Haigis formula requires a triple optimization, yielding different a0, a1 and a2 constants.
Two other studies8,11 compared axial length measurements from an OLCR biometer using a single refractive index to calculated AL measurements using multiple refractive indices for each ocular segment, in reverse of the present study. Both studies found that the single index AL measurements taken from the OLCR biometer were on average too short in short eyes and too long in long eyes, when compared to the calculated measurements based on multiple refractive indices. Wang et al8 found the refractive accuracy using multiple indices of refraction to calculate AL and IOL power in 4992 eyes to be improved in short eyes with Hoffer Q and Holladay 1 formulas and in long eyes with all formulas except the Olsen formula. Using multiple indices instead of a single index to calculate AL in 1442 eyes, Cooke and Cooke11 improved predictions for formulas designed on US data (SRK/T, Holladay 1, Holladay 2, Hoffer Q and Haigis), although predictions were worse with the Barrett and Olsen formulas. Both of these studies are in agreement with our study in that most of the accuracy improvements are noted in short and in long eyes. Table 4 also shows that overall, the Barrett formula, using ALs generated with multiple refractive indices, resulted in more cases within 0.25 D (48.4%), within 0.50 D (80.5%) and within 0.75 D (97.1%). In those eyes that exceeded 25 mm, the best achieved results were noted with the Barrett Universal II formula in the multiple group, with the highest number of eyes achieving a final refraction within 0.50 D of predicted (91.2%).
It is clear from the tables in the current study that the prediction differences between the two groups vary with different formulas, and with different axial lengths. In particular, shorter and longer eyes tend to show more differences between the two AL measurement methods. This is consistent with the notion that a single refractive index is developed based on a normative data set, effectively presuming a fixed ratio of eye segments in the total axial length. In cases where this ratio is less likely to be observed (e.g. short eyes, long eyes), the use of different refractive indices for each ocular segment would be more reliable. In a long 26.00 mm eye measured by Argos, the biometers using a single refractive index for the entire eye will potentially report an AL of 26.10 mm; this 0.1 mm error in AL is in turn likely to cause a 0.20 to 0.25 D error in the final refraction.19
Consistent with this notion, there may be greater value in using an AL generated with multiple refractive indices for cases such as post-LASIK eyes, where the ratio of segments differs because of the thinner cornea and longer eyes. Of course, different IOL power calculation formulas than the ones here would have to be evaluated in this instance because the keratometry of the eye has been modified. Another potential application would be in cases with atypical optical geometry; such cases often represent the outliers in IOL power formulas.20 The use of an AL generated using multiple refractive indices might provide a more precise measurement and could improve outcomes with new formulas.
There are limitations to the current study. The single index AL had to be calculated rather than measured and some variability might be expected with such calculations. Another limitation is that while the overall number of eyes included was high, roughly 80% of them were in a normal range (22 to 25 mm), where the differences between the AL determined with a single refractive index or multiple refractive indices results were lowest. More data for very short or very long eyes would be beneficial for future studies. In addition, one specific methodology for axial length simulation was used; there are other potential methods that might be explored.
The present study suggests that there may be some advantages to using an AL based on multiple specific refractive indices for each ocular segment in our IOL power calculations. AL determined using multiple refractive indices appeared to incrementally improve results, especially in the short and long eyes. Further studies based on a larger number of short and long eyes are needed to better elucidate the benefits of AL measurements using multiple (segment-specific) indices.
Acknowledgments
Fei Yu, PhD of the Department of Biostatistics at UCLA reviewed the statistical results.
Funding
This study was supported with an investigator-initiated study grant from Alcon (IIT #44889825), Fort Worth, TX, USA.
Disclosure
Dr H John Shammas reports licensing fees from varies biometry companies for the Shammas Post-Lasik Formulas license. Dr Richard Potvin reports personal fees from Shammas Eye Medical Center, during the conduct of the study; personal fees from Alcon, outside the submitted work. The authors report no other conflicts of interest in this work.
References
1. Lundström M, Dickman M, Henry Y, et al. Risk factors for refractive error after cataract surgery: analysis of 282 811 cataract extractions reported to the European registry of quality outcomes for cataract and refractive surgery. J Cataract Refract Surg. 2018;44(4):447–452. doi:10.1016/j.jcrs.2018.01.031
2. Roberts TV, Hodge C, Sutton G, Lawless M; contributors to the Vision Eye Institute IOL outcomes registry. Comparison of Hill-radial basis function, Barrett universal and current third generation formulas for the calculation of intraocular lens power during cataract surgery. Clin Exp Ophthalmol. 2018;46(3):240–246. doi:10.1111/ceo.13034
3. Norrby S. Sources of error in intraocular lens power calculation. J Cataract Refract Surg. 2008;34:368–376. doi:10.1016/j.jcrs.2007.10.031
4. Jeong J, Song H, Lee JK, Chuck RS, Kwon JW. The effect of ocular biometric factors on the accuracy of various IOL power calculation formulas. BMC Ophthalmol. 2017;17(1):62. doi:10.1186/s12886-017-0454-y
5. Shammas HJ, Chan S. Precision of IOLMaster measurements. J Cataract Refract Surg. 2010;36:1474–1478. doi:10.1016/j.jcrs.2010.02.027
6. Haigis W, Lege B, Miller N, Schneider B. Comparison of immersion ultrasound biometry and partial coherence interferometry for intraocular lens calculation according to Haigis. Graefes Arch Clin Exp Ophthalmol. 2000;93:807–810.
7. Shammas HJ, Hoffer KJ. Repeatability and reproducibility of biometry and keratometry measurements using a non-contact optical low-coherence reflectometer and keratometer. Am J Ophthalmol. 2012;153:55–61. doi:10.1016/j.ajo.2011.06.012
8. Wang L, Cao D, Weikert MP, Koch DD. Calculation of axial length using a single group refractive index versus using different refractive indices for each ocular segment: theoretical study and refractive outcomes. Ophthalmology. 2019;126(5):663–670. doi:10.1016/j.ophtha.2018.12.046
9. Shammas HJ, Ortiz S, Shammas MC, Kim SH, Chong C. Biometry measurements using a new large-coherence-length swept-source optical coherence tomographer. J Cataract Refract Surg. 2016;42:50–61. doi:10.1016/j.jcrs.2015.07.042
10. Omoto MK, Torii H, Masui S, Ayaki M, Tsubota K, Negishi K. Ocular biometry and refractive outcomes using two swept-source optical coherence tomography-based biometers with segmental or equivalent refractive indices. Sci Rep. 2019;9(1):6557. doi:10.1038/s41598-019-42968-3
11. Cooke DL, Cooke TL. Approximating sum-of-segments axial length from a traditional optical low-coherence reflectometry measurement. J Cataract Refract Surg. 2019;45(3):351–354. doi:10.1016/j.jcrs.2018.12.026
12. Cooke DL, Cooke TL. A comparison of two methods to calculate axial length. J Cataract Refract Surg. 2019;45:284–292. doi:10.1016/j.jcrs.2018.10.039
13. Barrett GD. Barrett universal II formula. Singapore, Asia-Pacific association of cataract and refractive surgeons. Available from: www.apacrs.org/barrett_universal2/.
14. Haigis W. The Haigis formula. In: Shammas HJ, editor. Intraocular Lens Power Calculations. Thorofare, NJ: Slack, Inc.; 2004:41–57.
15. Hoffer KJ. The Hoffer Q formula: a comparison of theoretic and regression formulas. J Cataract Refract Surg. 1993;19(6):700–712. doi:10.1016/S0886-3350(13)80338-0
16. Holladay JT, Praeger TC, Chandler TY, Musgrove KH, Lewis JW, Ruiz RS. A three-part system for refining intraocular lens power calculations. J Cataract Refract Surg. 1988;14:17–24. doi:10.1016/S0886-3350(88)80059-2
17. Retzlaff J, Sanders DR, Kraff MC. Development of the SRK/T intraocular lens implant power calculation formula. J Cataract Refract Surg. 1990;16:333–340. doi:10.1016/S0886-3350(13)80705-5
18. Wang L, Koch DD, Hill W, Abulafia A. Pursuing perfection in intraocular lens calculations: III. Criteria for analyzing outcomes. J Cataract Refract Surg. 2017;43:999–1002. doi:10.1016/j.jcrs.2017.08.003
19. Shammas HJ. Intraocular Lens Power Calculations. Slack, Inc. Publishers; 2004:103.
20. Kane JX, Van Heerden A, Atik A, Petsoglou C. Accuracy of 3 new methods for intraocular lens power selection. J Cataract Refract Surg. 2017;43(3):333–339. doi:10.1016/j.jcrs.2016.12.021
 © 2020 The Author(s). This work is published and licensed by Dove Medical Press Limited. The
full terms of this license are available at https://www.dovepress.com/terms
and incorporate the Creative Commons Attribution
- Non Commercial (unported, 3.0) License.
By accessing the work you hereby accept the Terms. Non-commercial uses of the work are permitted
without any further permission from Dove Medical Press Limited, provided the work is properly
attributed. For permission for commercial use of this work, please see paragraphs 4.2 and 5 of our Terms.
© 2020 The Author(s). This work is published and licensed by Dove Medical Press Limited. The
full terms of this license are available at https://www.dovepress.com/terms
and incorporate the Creative Commons Attribution
- Non Commercial (unported, 3.0) License.
By accessing the work you hereby accept the Terms. Non-commercial uses of the work are permitted
without any further permission from Dove Medical Press Limited, provided the work is properly
attributed. For permission for commercial use of this work, please see paragraphs 4.2 and 5 of our Terms.