Back to Journals » Clinical Optometry » Volume 10
Effects of relative negative spherical aberration in single vision contact lens visual performance
Authors Kho D, Fedtke C, Tilia D ![]() , Diec J, Sha J
, Diec J, Sha J ![]() , Thomas V, Bakaraju RC
, Thomas V, Bakaraju RC ![]()
Received 31 May 2017
Accepted for publication 16 November 2017
Published 11 January 2018 Volume 2018:10 Pages 9—17
DOI https://doi.org/10.2147/OPTO.S142952
Checked for plagiarism Yes
Review by Single anonymous peer review
Peer reviewer comments 3
Editor who approved publication: Mr Simon Berry
Danny Kho,1 Cathleen Fedtke,1,2 Daniel Tilia,1,2 Jennie Diec,1 Jennifer Sha,1 Varghese Thomas,1 Ravi C Bakaraju1,2
1Brien Holden Vision Institute, Clinical Trial Research Centre, Sydney, NSW, Australia, 2School of Optometry and Vision Sciences, University of New South Wales, Sydney, NSW, Australia
Objective: The study aimed to compare the visual performance of contact lenses with and without negative spherical aberration (SA) over 5 days of wear.
Methods: At baseline, 32 myopic participants (aged 18–33 years) were fitted in a randomized order with two lenses (test lens with minimal or no SA and 1-Day Acuvue Moist designed with negative SA) for 5 days (minimum 6 hours wear/day). Participants returned for a follow-up visit. This consisted of on-axis SA measurements; high- and low-contrast visual acuities at 6 m; high-contrast acuities at 70 and 40 cm; low-illumination, low-contrast acuity at 6 m; stereopsis at 40 cm; horizontal phorias at 3 m and 33 cm; and ±2.00 D monocular accommodative facility at 33 cm. Participants also rated (1–10 scale) vision quality (clarity and lack of ghosting for distance, intermediate, near, driving vision and vision stability during day- and night-time), overall vision satisfaction, ocular comfort, and willingness to purchase (yes/no response).
Results: 1-Day Acuvue Moist induced significantly (p<0.05) more negative SA at distance (∆=0.078 μm) and near (∆=0.064 μm) compared to the test lens, for a 6 mm pupil. There were no significant differences (p>0.05) in acuity, binocular vision, and all subjective metrics except vision stability between lenses where the test lens was rated to provide more stable vision (p<0.05).
Conclusion: Contrary to expectations, incorporating negative SA in single vision soft contact lenses did not improve visual performance in non-presbyopic adult myopes.
Keywords: soft contact lens, spherical aberration, power profile, visual acuity
Introduction
Optical aberrations arise because of the innate imperfections of the ocular surface and refractive media that degrade the retinal image quality. Overall, ocular aberrations can be divided into lower- and higher-order aberrations and are commonly represented by Zernike polynomials.1 Clinicians primarily confront the lower-order aberrations because of their significant impact on vision (eg, defocus and astigmatism) and the ability to easily correct them with spectacles, contact lenses, or refractive surgery.2 However, higher-order aberrations have gained increasing interest in the recent past, primarily driven by the advances in wavefront aberration measurement technology.3–5 Various combinations of lower- and higher-order aberrations, in magnitude and sign, and their effects of visual performance have become of clinical interest, particularly for presbyopia applications.6–8 As this paper only relates to spherical aberration (SA) observed in single vision contact lenses, findings on through-focus visual performance improvements with deliberate introduction of SA for presbyopic applications will not be discussed.
The SA refers to the phenomena arising from the geometry of lens surfaces in which images appear blurred because peripheral light rays focus at a different point from those originating centrally. Population studies report that the mean SA measures are about 0.10±0.15 µm and its value increases with age. As SA is rotationally symmetric, spherical contact lenses have been considered for SA correction because of their distinct advantage of maintaining alignment with the optical axis with eye movements. Contact lens manufacturers have thus targeted SA correction in soft contact lenses to improve vision.9,10 Three recent studies examined the optical power profiles of commercial single vision contact lenses from major manufacturers and found the majority incorporated negative SA.11–13 This is in an attempt to compensate for the mean SA values observed in the population.14–17 However, in light of theory and findings related to the influence of peripheral hyperopia on the rate of myopia progression, the introduction of deliberate negative SA to improve the visual performance with single vision contact lenses could have a negative consequence on the myopia progression.18–20 In other words, soft contact lenses with negative SA may be detrimental from a myopia progression standpoint even if they were simply intended/optimized to provide better visual performance. Interestingly, some short-term (same day) assessments have been performed showing that contact lenses with negative SA have minimal or no benefit in visual performance over those with no SA.9,12,21 To better understand best practice for contact lens prescribing in children or young adults at risk of myopia progression, the current study aimed to compare the visual performance between a single vision contact lens with negative SA and one with minimal SA in non-presbyopic myopes after at least 5 days of lens wear.
Methods
Participants
Eligible participants were required to have healthy eyes (no ocular health findings that would contraindicate contact lens wear), aged between 18 and 35 years, a spherical subjective refractive error between −0.50 and −6.00 D, and less than or equal to −1.00 DC subjective cylinder power with best-corrected visual acuity (VA) of 0.30 logMAR (6/12) or better in each eye. Participants included habitual and non-contact lens wearers. Those with no prior contact lens experience required a successful adaptation period of at least 5 days with daily disposable single vision lenses before study commencement. Exclusion criteria were any pre-existing ocular or systemic conditions preventing safe contact lens wear, eye surgery within 12 weeks prior to enrolment or previous corneal refractive surgery, and use of any medications that could affect normal ocular findings.
This study was conducted at the Clinical Research and Trials Centre (CRTC), Brien Holden Vision Institute (BHVI) in Sydney, Australia, approved by an independent human research ethics committee (Bellberry Human Research Ethics Committee, South Australia), and adhered to the tenets of the Declaration of Helsinki. The trial was registered on the Australian New Zealand Clinical Trials Registry (ACTRN12615000652572).
Study design
This was a prospective, randomized, cross-over, double-masked, daily-wear dispensing clinical trial where participants wore two lens types. Participants attended a baseline visit to assess eligibility and provided written informed consent before any study procedures were performed. For each study lens, participants attended two visits: Fitting Visit (to ensure appropriate lens power and a clinically acceptable fit) and an Assessment Visit after at least 5 days of contact lens wear. Participants were instructed to wear each lens for a minimum of 6 hours each day. Investigators at the Assessment Visit were masked to the identity of lenses worn, and participants were masked at all times. The order of the lenses assigned was randomized and a minimum 2-night washout period from study lenses was implemented between Assessment Visit of the first lens and the Fitting Visit of the second lens.
Study lenses
The contact lenses used in the study were soft hydrogel (etafilcon A) daily disposable contact lenses. Each lens had a different power profile with one design consisting of increasing negative peripheral power to generate negative SA (1-Day Acuvue Moist, 1-DAM; Johnson & Johnson Vision Care, Jacksonville, FL, USA) and the other with a minimal or no SA (test lens custom manufactured for the BHVI). Excluding the power profile, lens parameters were identical with a lens diameter of 14.0 mm and a base curve of 8.5 mm.
Lens measurement
Power profile
The NIMO TR1504 (Lambda-X, Nivelles, Belgium) was used to measure the radial power of 3 labeled back vertex powers (BVPs; −1.00, −3.00, and −6.00 D) of each study lens. The radial power was measured across a 7 mm diameter. A minimum of three lenses (maximum of five) of each BVP were measured and their mean values across the optic zone diameter used to generate a power profile over a 3.5 mm half chord in 0.01 mm intervals. Based on the mean values for each half-chord increment, best-polynomial-fit power profiles were plotted using Microsoft Excel (Microsoft, USA).
Study procedures
At baseline, participant’s subjective distance refractive error and best-corrected binocular VA were measured using an electronic VA chart – Test Chart 2000 Pro (Thompson Software Solutions, Hertfordshire, UK) – at 6 m at high contrast (HC, 100% contrast) and low contrast (LC, 10% contrast) under high illumination (~400 lux). Near vision was assessed at 40 cm for HCVA binocularly with a Sloan ETDRS near card (Precision Vision, IL, USA) and for stereopsis with the Wirt Rings of the Random Dot 3 LEA SYMBOLS® Stereoacuity Test (Vision Assessment Corporation, IL, USA). Stereopsis was recorded in seconds of arc at the last target the participant correctly identified prior to two successive mistakes or at which the participant could no longer identify any targets.
Baseline binocular vision function was assessed for horizontal heterophorias, using the Howell-Prentice Distance and Near Cards (Cyclopean Design, VIC, Australia) at 3 m and 33 cm, respectively. Monocular accommodative facility (MAF) was measured with ±2.00 D flippers while viewing a 0.2 logMAR size print on a black-and-white MNREAD chart (Precision Vision, IL, USA) at 33 cm. Horizontal phorias at each distance were measured in free space with participant’s subjective distance refraction using a 6Δ base-down prism in front of the right eye. Participants were instructed to identify the number to which the top arrow is pointed. Numbers on the blue side corresponded to exophoria while the yellow indicated esophoria. MAF was assessed with the left eye occluded and participants were instructed to report when the 0.2 logMAR print first became clear with each lens power presentation. The procedure was performed for 1 minute and the result recorded in cycles per minute, where one cycle consisted of successfully clearing both plus and minus power.
SA was measured with the BHVI-EyeMapper (BHVI, Sydney, NSW, Australia) in low illumination (~10 lux).22 Four independent measurements were performed monocularly with a 6/9 target letter at distance (−1.00 D demand, ie, fogged by 1.00 D to relax accommodation) and near (+3.00 D demand) with the fellow eye occluded. Primary SA terms were analyzed at both natural pupil size and for a constant fixed pupil size of 6 mm.
Following the baseline visit, participants were power-matched to their subjective distance refraction spherical equivalent and the first assigned contact lens inserted and allowed to settle for 10 minutes. A trial frame spherical over-refraction was performed monocularly for best-corrected HCVA at 6 m. If an over-refraction was found, the equivalent power was refit and HCVA was reassessed following a subsequent settling period. Contact lens fit was assessed using a slit-lamp bio-microscope to ensure adequate centration (horizontal and vertical in mm at primary gaze), postblink primary gaze lens movement (mm), primary gaze lens lag (mm), and lens tightness (percentage). Lens tightness was based on the push-up test (1–100 scale) where optimum tightness was defined at 50% – lower values indicated looser lens fits while higher values indicated tighter lens fits.23 Investigators graded overall lens fit acceptance (0–4 in 0.1 steps), where a grade of 2 or above was considered clinically acceptable while values below 2 were considered unacceptable overall lens fit. If the contact lens fit was clinically unacceptable, participants were not dispensed with contact lenses. Otherwise, participants were dispensed with contact lenses, instructed of the required wear schedule, and given a take-home questionnaire.
The questionnaire consisted of vision quality (clarity and lack of ghosting for distance, intermediate, near, and driving vision in day and night-time), vision stability, overall vision satisfaction, and ocular comfort using a numerical rating scale for each category. The numeric rating scale consisted of a 1–10 rating in 1-point steps where for most categories, the rating of 10 indicated the most positive outcome (except for ghosting and night-time haloes where 1 indicated the most positive outcome). This questionnaire has been used extensively at the CRTC in multiple studies assessing visual performance of soft multifocal contact lenses.24–28 The questionnaire was completed halfway between Fitting and Assessment Visits prior to lens removal (ie, at the end of the third day of lens wear). Participants returned for an Assessment Visit after ~5 days of lens wear.
At the Assessment Visit, participants completed the same questionnaire as the take-home questionnaire with an additional forced choice question (Yes/No) on willingness to purchase: “Based on vision, would you buy this contact lens?”. Vision measurements at the Assessment Visit with study lenses consisted of monocular and binocular HCVA and binocular LCVA at 6 m, binocular HCVA at 70 cm and 40 cm, stereopsis at 40 cm, horizontal phorias at 3 m and 33 cm, MAF at 33 cm, and binocular LCVA at low illumination (~1 lux) at 6 m and BHVI-EyeMapper (distance and near).
Data analysis
Data were summarized as mean±SD for variables measured on an interval scale and as percentages for categorical variables. The scale for ghosting and night-time haloes was reversed to be consistent with the other ratings, such that a higher rating indicated better outcomes (ie, less ghosting and less bothersome haloes). As the stereopsis data were positively skewed, a log transformation to the raw data was performed prior to statistical analysis. To enable direct comparison between SA values for the different lens types and to compensate for variation in pupil sizes, SA values were also converted to “normalized” values in D/mm2 as established by Radhakrishnan and Charman.29
A linear mixed model with subject random intercepts was used to test the hypothesis that the test lens performed differently to 1-DAM lens. For subjective variables (clarity of vision and lack of ghosting), the factors included in the model were lens type (test lens, 1-DAM), test distance (far, intermediate, near), and time of day (day, night). For vision stability, factors in the linear mixed model were lens type and time of day. For overall vision satisfaction, haloes, and ocular comfort, lens type was the only factor included in the model. For HCVA and LCVA, lens type and test distance were included as factors. For stereopsis, distance horizontal phoria, near horizontal phoria, and accommodative facility, only lens type was included as a factor in the model.
The interaction of lens type with all other factors was tested. If the interactions of lens type with any other factor were found to be significant, further tests were deployed to determine significance of lens type within sublevels of the interacting factor. In all other instances, the results are generalized for the whole group. This modeling approach was used instead of several paired t-tests to avoid inflating the type I error rate. Lens purchase was analyzed using McNemar’s chi-square test for paired categorical data. SA data at distance and near were analyzed using a linear mixed model. Post hoc analysis for SA data was adjusted using Bonferroni correction. Pearson’s correlation (r) was used to determine the association between vision variables and spherical equivalent refractive error at baseline. Analyses were performed using SPSS 21 (IBM Corporation, Armonk, NY, USA), and the level of significance was set at 5%. Correlations were considered significant if r was >0.4 and p<0.05.
Results
Participants
The study evaluated 32 participants, of whom 75% were female; mean age ± SD =23.8±4.9 years (range 18.1-33.8 years) and mean spherical equivalent refraction ± SD =−2.96±1.13 D (range −1.00 to −5.75 D).
Power profile
1-DAM and test lens (labeled BVPs −1.00, −3.00, and −6.00 D) power profiles across a 3.5 mm half-chord diameter are illustrated in Figure 1, while Table 1 compares the average powers and SD over 1 and 3.5 mm half chord diameters between lens types. Both designs demonstrate similar variation levels within the 1 mm half chord but 1-DAM exhibits larger deviations in power across a 3.5 mm half chord, compared with the test lens, which increased with higher BVP.
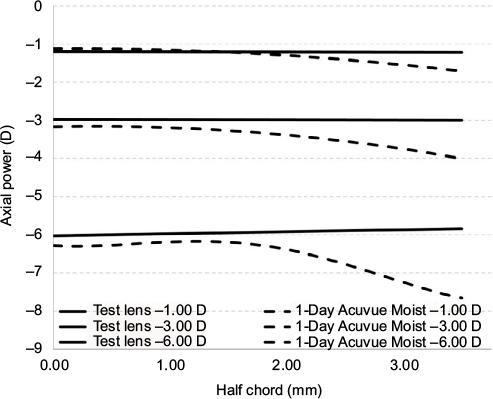 | Figure 1 Average power profiles of study lenses with labeled back vertex powers of −1.00, −3.00, and −6.00 D using the NIMO TR1504 across a 3.5 mm half chord. Note: Average values were calculated from a minimum of three lenses (maximum of five) for each nominal power. |
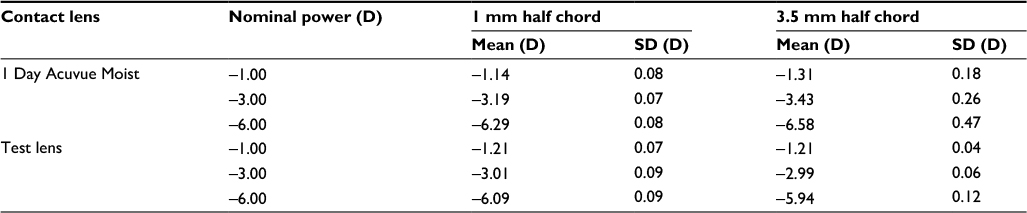 | Table 1 Comparison of the mean power and SD across 1 and 3.5 mm half chord for 1-Day Acuvue Moist and test contact lenses Note: Average and SD values were calculated from a minimum of three lenses (maximum of five) for each nominal power measured with the NIMO TR1504. |
Contact lens fitting characteristics are summarized in Table 2. There were no clinically significant differences between the lens types; however, statistically, 1-DAM decentered more inferiorly compared to the test lens (p<0.001), while test lenses tended to have a tighter fit (p<0.001). There were no instances of clinically unacceptable lens fits.
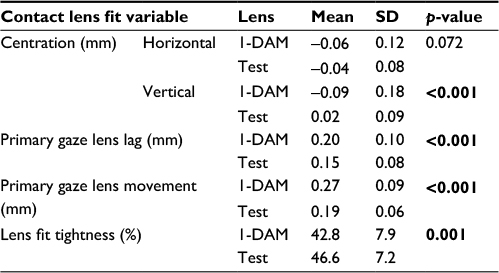 | Table 2 Comparison of lens fit characteristics for study lenses at the Fitting Visit Notes: For centration measurements, positive values indicate nasal or superior directions while negative values indicate temporal or inferior directions. Overall lens fit grades are based on a 0−4 scale, where a grade of 2 or higher indicates a clinically acceptable lens fit. Bold represents statistically significant values (p<0.05). Abbreviation: 1-DAM, 1-Day Acuvue Moist. |
On axis SA data are presented in Table 3. SA with test lens on-eye was not significantly different from eyes unaided at distance (p=1.00). Eyes wearing 1-DAM showed significantly more on-axis negative SA than eyes unaided at distance or compared to test lens at distance and near (p≤0.01).
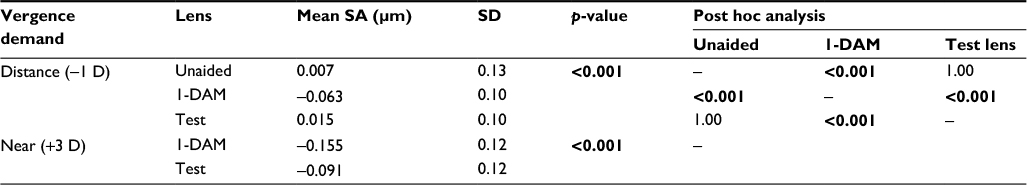 | Table 3 On-axis mean SA and SD for unaided (no lens wear) eye, while wearing 1-DAM and test lenses for 6 mm pupil size Note: Bold represents statistically significant values (p<0.05). Abbreviations: 1-DAM, 1-Day Acuvue Moist; SA, spherical aberration. |
Figure 2 illustrates SA between lens types, and unaided eyes at distance and near expressed in D/mm2. The mean natural pupil diameter under low illumination was 6.7±0.5 mm. When expressed in D/mm2, the test lens showed significantly more positive on-axis SA than unaided eyes at distance (p=0.038), while 1-DAM was significantly more negative than unaided eyes at distance (p=0.01). At near, 1-DAM showed significantly more negative on-axis SA than the test lens (p<0.001).
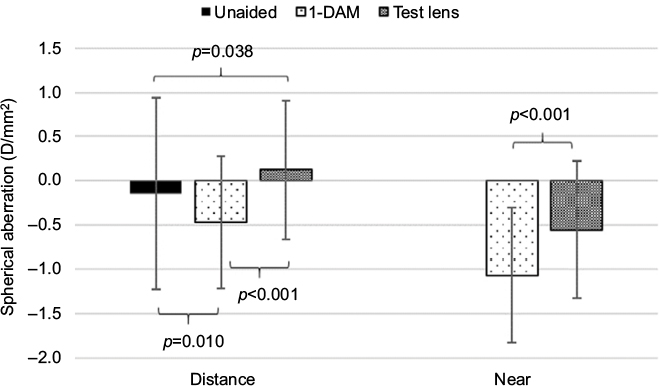 | Figure 2 On-axis spherical aberration expressed in D/mm2 for unaided, test lens, and 1-DAM at distance (−1.00 D demand) and near (+3.00 D demand). Abbreviation: 1-DAM, 1-Day Acuvue Moist. |
Vision variables assessed at the Assessment Visit are presented in Table 4. There was no significant difference between lens types for either HCVA or LCVA (p≥0.288). Statistical analysis suggested significant differences between distances for HCVA and LCVA (p≤0.001); however, the interaction between lens type and distance was not significant for both HCVA and LCVA (p≥0.629).
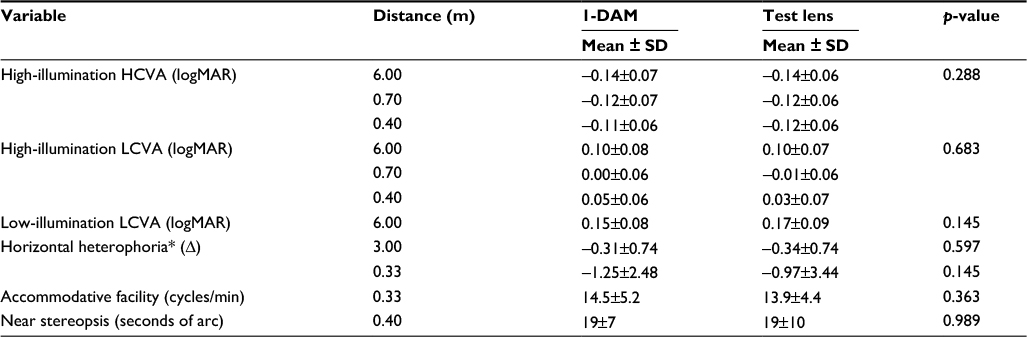 | Table 4 Mean objective visual performance measures (n=32) and SD Notes: p-values are based on a linear mixed model with lens type as a factor. For HCVA and LCVA, p-values for visual acuities examine for overall differences between lens types at all distances tested. *Positive values = esophoria, negative values = exophoria. Abbreviations: 1-DAM, 1-Day Acuvue Moist; HCVA, high-contrast visual acuity; LCVA, low-contrast visual acuity. |
As expected, illumination levels had a significant effect on LCVA (p<0.001). However, there were no significant differences between lens type (p=0.145) or between lens type and illumination level (p=0.412). Lens type was not a significant factor for any of the binocular vision functions tested: distance or near horizontal phoria (p=0.597 and p=0.145, respectively), accommodative facility (p=0.363), and stereopsis (p=0.989).
Correlations
Spherical equivalent refractive error was weakly negatively correlated for distance acuity measures: HCVA (Pearson’s r=−0.306; p=0.014), LCVA in high illumination (Pearson’s r=−0.318; p=0.01), and LCVA in low illumination (Pearson’s r=−0.359; p=0.004) for both lens types combined, which indicates better VAs for less myopic eyes. When comparing within lens types, the test lens demonstrated a moderate negative correlation for these distance acuity measures (r=−0.430 and p=0.014 for HCVA; r=−0.469 and p=0.007; r=−0.514 and p=0.003 for high- and low-illumination LCVA, respectively), but there was no correlation with 1-DAM (p≥0.297).
Subjective visual performance measures
Subjective visual performance measures are illustrated in Table 5. Time of day was a significant factor for clarity of vision ratings and driving vision (p<0.001 and p=0.05, respectively) with poorer subjective ratings at night-time compared to daytime irrespective of lens type. There was no significant effect of distance on clarity of vision ratings (p=0.527) with participants reporting no significant difference in clarity of vision (p=0.614) between study lenses. Distance and time of day did not significantly influence participant ghosting ratings (p=0.088 and p=0.363).
 | Table 5 Comparison of subjective visual performance mean and SD between 1-DAM and test lens Notes: Ratings are based on a 1–10 numeric rating scale where higher scores indicate better outcomes. Bold represents statistically significant values (p<0.05). Abbreviation: 1-DAM, 1-Day Acuvue Moist. |
While the mean difference was small, participants rated vision to be more stable with the test lens than 1-DAM (p=0.05). A majority of participants (65.6%) responded positively to “willingness to purchase” for both study lenses while 18.8% would not purchase the test lens, 9.4% would not purchase the 1-DAM lens, and 6.3% were unwilling to purchase either lens. There was no significant difference between willingness to purchase between lens types (p=0.508).
Discussion
Our findings suggest that young adult myopes obtain similar visual performance in single vision contact lenses either with or without negative SA. There were no statistically significant differences between lenses for any VA-based measures, binocular vision assessments, and almost all subjective metrics.
While Papas et al did examine visual performance measures in soft contact lenses with varying SA, their study also examined the effects of other lens parameters of the commercial lenses like material, base curve, and diameter.12 One of the key differences in the current study is the variation in the amount of SA between lens designs. Furthermore, in contrast to their contralateral lens wear short-term study design where lenses were worn only for a few hours, participants in this study were dispensed with lenses as per common clinical practice, that is, bilateral lens wear over several days in their habitual environment to experience the full spectrum of illumination levels and visual demands normally encountered.
Our findings are consistent with previous studies, with no discernible difference in acuity-based measures and vision satisfaction ratings with contact lenses with and without SA. The current study also assessed subjective wearer experiences under mesopic conditions where pupils are larger and the impacts of SA would be expected to be greater (eg, night-time and driving vision).12 Further, no significant difference between willingness to purchase between lens types was found.
The only significant difference between lens types was in vision stability ratings wherein participants reported more stable vision with the test lenses when combined for day and night conditions, possibly due to slightly tighter lenses. While not statistically significant, test lenses were rated 0.7 units more comfortable than 1-DAM, suggesting a trend toward better comfort with the test lenses. Speculatively, the greater vision stability offered by the test lenses could account for this trend in greater comfort, with previous studies suggesting an association between vision quality and ocular comfort ratings.30,31
Another possible explanation for our findings is neural compensation. Artal et al presented a target stimulus to subjects with variations of their inherent ocular aberrations and subjects reported greatest clarity of vision when presented with their eye’s own aberration.32 The authors hypothesize that individuals are adapted to their own inherent aberrations via processes in the neural visual system. Perhaps, the lower stability and overall comfort ratings with 1-DAM could be due to the increasingly negative SA generating an unfamiliar aberration profile.
Rae et al demonstrated that a −0.1 μm change in on-axis SA with a contact lens could produce a slight improvement (1–2 letters) in HCVA and LCVA.33 Despite on-axis SA with 1-DAM being significantly more negative than the test lens, we were unable to detect a difference in HCVA or LCVA. These findings could be attributed to methodology differences in VA assessment where Rae et al assessed HCVA at 3 m and LCVA at 4 m, and assigned 0.01 log units per correct letter identified instead of the conventional 0.02 log units, and in the amount of inherent SA.
By presenting observers with simulated images of a 6/15 HC Snellen letter with varying levels of induced SA based on a model eye, Rio and Legras suggested a tolerance interval of −0.15 to 0.01 D/mm2 of induced SA to avoid a noticeable reduction in image quality.34 Although test lenses did generate a relative shift in SA outside their proposed tolerance interval, we observed no decline in acuity or subjective metrics. However, Rio and Legras utilized a task requiring high levels of visual discrimination, which may not be representative of the real world, whereas our participants were able to experience their habitual visual environments.
While there was a moderate negative correlation between distance VA and refractive error (spherical equivalent) for eyes wearing test lenses but no significant correlation for 1-DAM, it cannot be concluded that more myopic refractive errors achieved worse LCVA because of the differences in SA. It is possible that the study population, which excluded high myopes (above −6.00 D), may not have been sensitive enough to detect the small differences in LCVA between lens types.
As the power profile of a soft contact lens can affect the peripheral refraction on-eye, this is of concern because of the potential role of peripheral refractive error in myopia progression. While animal studies suggest that relative peripheral hyperopic defocus can possibly lead to the development and/or progression of myopia, there has been no evidence to suggest a meaningful association between relative peripheral refraction and myopia onset and/or progression in myopic children.19,20,35,36 Soft spherical contact lenses can induce measurable changes in peripheral refraction (including relative peripheral hyperopia), and given current clinical interest in the peripheral retina in relation to myopia, clinicians should be aware of the insignificant visual performance gains when fitting soft contact lenses of this design on young and progressing myopes.37,38
One limitation of our study could be variations in pupil size in day-to-day life, which could affect the amount of negative SA induced. We used a reference pupil of 6 mm for SA measurements, but it is possible that during photopic and possibly mesopic conditions that pupil size would be variable and possibly smaller. However, given that our study cohort consisted of pre-presbyopic myopic adults, it is likely that their pupils would still be relatively large.
Another limitation was that the questionnaire was not validated. However, the questionnaire has been used extensively in our previous trials.24–28 As this study was executed in a randomized, cross-over fashion, any bias would be reduced when considering differences between lens types.
Conclusion
The introduction of negative SA into contact lenses did not produce appreciable visual performance gains in terms of VA or subjective metrics in young myopic adults.
Acknowledgments
The authors wish to acknowledge the contributions of the clinical team at the Brien Holden Vision Institute in the collection of participant data and day-to-day maintenance of the study: Ms Shona Delaney, Ms Anna Munro, Dr Nisha Yeotikar, Dr Monica Jong, Ms Kathleen Laarakkers, Ms Kassandra Wagenfeuhr, and Ms Elise Robertson. We would also like to acknowledge Dr Thomas Naduvilath for his review of the manuscript and contribution with data management and analysis, and Dr Eon Kim for her assistance in NIMO lens measurements.
Disclosure
The authors have no conflicts of interest to disclose in this work.
References
ANSI. Opthalmics - methods for reporting optical aberrations of eyes. ANSI Z80.28-2017. | ||
Porter J, Guirao A, Cox IG, Williams DR. Monochromatic aberrations of the human eye in a large population. J Opt Soc Am A Opt Image Sci Vis. 2001;18(8):1793–1803. | ||
Thibos LN, Hong X, Bradley A, Cheng X. Statistical variation of aberration structure and image quality in a normal population of healthy eyes. J Opt Soc Am A Opt Image Sci Vis. 2002;19(12):2329–2348. | ||
Atchison DA, Scott DH. Monochromatic aberrations of human eyes in the horizontal visual field. J Opt Soc Am A Opt Image Sci Vis. 2002;19(11):2180–2184. | ||
Atchison DA. Recent advances in measurement of monochromatic aberrations of human eyes. Clin Exp Optom. 2005;88(1):5–27. | ||
de Gracia P, Dorronsoro C, Gambra E, Marin G, Hernandez M, Marcos S. Combining coma with astigmatism can improve retinal image over astigmatism alone. Vis Res. 2010;50(19):2008–2014. | ||
de Gracia P, Dorronsoro C, Marin G, Hernandez M, Marcos S. Visual acuity under combined astigmatism and coma: optical and neural adaptation effects. J Vis. 2011;11(2):5. | ||
Vinas M, de Gracia P, Dorronsoro C, et al. Astigmatism impact on visual performance: meridional and adaptational effects. Optom Vis Sci. 2013;90(12):1430–1442. | ||
Dietze HH, Cox MJ. Correcting ocular spherical aberration with soft contact lenses. J Opt Soc Am A Opt Image Sci Vis. 2004;21(4):473–485. | ||
Chapman JE, Cox IG, Biddle GW, Comstock TL, Deryke KJ; Inventors. Contact lenses providing improved visual acuity. US patent EP 0943118 B11997. | ||
Wagner S, Conrad F, Bakaraju RC, Fedtke C, Ehrmann K, Holden BA. Power profiles of single vision and multifocal soft contact lenses. Cont Lens Anterior Eye. 2015;38(1):2–14. | ||
Papas E, Dahms A, Carnt N, Tahhan N, Ehrmann K. Power profiles and short-term visual performance of soft contact lenses. Optom Vis Sci. 2009;86(4):318–323. | ||
Kim E, Bakaraju RC, Ehrmann K. Power profiles of commercial multifocal soft contact lenses. Optom Vis Sci. 2017;94(2):183–196. | ||
Thibos LN, Bradley A, Hong X. A statistical model of the aberration structure of normal, well-corrected eyes. Ophthalmic Physiol Opt. 2002;22(5):427–433. | ||
Plainis S, Pallikaris IG. Ocular monochromatic aberration statistics in a large emmetropic population. J Mod Opt. 2008;55(4–5):759–772. | ||
Amano S, Amano Y, Yamagami S, et al. Age-related changes in corneal and ocular higher-order wavefront aberrations. Am J Ophthalmol. 2004;137(6):988–992. | ||
Fujikado T, Kuroda T, Ninomiya S, et al. Age-related changes in ocular and corneal aberrations. Am J Ophthalmol. 2004;138(1):143–146. | ||
Sankaridurg P, Smith E, Naduvilath T, et al. Decrease in rate of myopia progression with a contact lens designed to reduce relative peripheral hyperopia: one-year results. Invest Ophthalmol Vis Sci. 2011;52(13):9362–9367. | ||
Smith EL, III, Hung LF, Huang J. Relative peripheral hyperopic defocus alters central refractive development in infant monkeys. Vision Res. 2009;49(19):2386–2392. | ||
Smith EL, III, Kee CS, Ramamirtham R, Qiao-Grider Y, Hung LF. Peripheral vision can influence eye growth and refractive development in infant monkeys. Invest Ophthalmol Vis Sci. 2005;46(11):3965–3972. | ||
Efron S, Efron N, Morgan PB. Optical and visual performance of aspheric soft contact lenses. Optom Vis Sci. 2008;85(3):201–210. | ||
Fedtke C, Ehrmann K, Falk D, Bakaraju RC, Holden BA. The BHVI-EyeMapper: peripheral refraction and aberration profiles. Optom Vis Sci. 2014;91(10):1199–1207. | ||
Martin DK, Boulos J, Gan J, Gavriel K, Harvey P. A unifying parameter to describe the clinical mechanics of hydrogel contact lenses. Optom Vis Sci. 1989;66(2):87–91. | ||
Fedtke C, Bakaraju RC, Ehrmann K, Chung J, Thomas V, Holden BA. Visual performance of single vision and multifocal contact lenses in non-presbyopic myopic eyes. Cont Lens Anterior Eye. 2016;39(1):38–46. | ||
Sha J, Bakaraju RC, Tilia D, et al. Short-term visual performance of soft multifocal contact lenses for presbyopia. Arq Bras Oftalmol. 2016;79(2):73–77. | ||
Tilia D, Bakaraju RC, Chung J, et al. Short-term visual performance of novel extended depth-of-focus contact lenses. Optom Vis Sci. 2016;93(4):435–444. | ||
Tilia D, Munro A, Chung J, et al. Short-term comparison between extended depth-of-focus prototype contact lenses and a commercially-available center-near multifocal. J Optom. 2017;10(1):14–25. | ||
Diec J, Tilia D, Naduvilath T, Bakaraju RC. Predicting short-term performance of multifocal contact lenses. Eye Contact Lens. Epub 2016 May 26. | ||
Radhakrishnan H, Charman WN. Age-related changes in ocular aberrations with accommodation. J Vis. 2007;7(7):11. 1–21. | ||
Rao SB, Simpson TL. Influence of vision on ocular comfort ratings. Optom Vis Sci. 2016;93(8):793–800. | ||
Basuthkar Sundar Rao S, Simpson TL. Impact of blur on suprathreshold scaling of ocular discomfort. Invest Ophthalmol Vis Sci. 2015;56(4):2304–2311. | ||
Artal P, Chen L, Fernandez EJ, Singer B, Manzanera S, Williams DR. Neural compensation for the eye’s optical aberrations. J Vis. 2004;4(4):281–287. | ||
Rae SM, Allen PM, Radhakrishnan H, et al. Increasing negative spherical aberration with soft contact lenses improves high and low contrast visual acuity in young adults. Ophthalmic Physiol Opt. 2009;29(6):593–601. | ||
Rio D, Legras R. Which ratio of areas improves vision quality in simultaneous focus optics? Optom Vis Sci. 2015;92(4):429–436. | ||
Benavente-Perez A, Nour A, Troilo D. Axial eye growth and refractive error development can be modified by exposing the peripheral retina to relative myopic or hyperopic defocus. Invest Ophthalmol Vis Sci. 2014;55(10):6765–6773. | ||
Mutti DO, Sinnott LT, Mitchell GL, et al. Relative peripheral refractive error and the risk of onset and progression of myopia in children. Invest Ophthalmol Vis Sci. 2011;52(1):199–205. | ||
Kang P, Fan Y, Oh K, Trac K, Zhang F, Swarbrick H. Effect of single vision soft contact lenses on peripheral refraction. Optom Vis Sci. 2012;89(7):1014–1021. | ||
de la Jara PL, Sankaridurg P, Ehrmann K, Holden BA. Influence of contact lens power profile on peripheral refractive error. Optom Vis Sci. 2014;91(6):642–649. |
 © 2018 The Author(s). This work is published and licensed by Dove Medical Press Limited. The
full terms of this license are available at https://www.dovepress.com/terms
and incorporate the Creative Commons Attribution
- Non Commercial (unported, 3.0) License.
By accessing the work you hereby accept the Terms. Non-commercial uses of the work are permitted
without any further permission from Dove Medical Press Limited, provided the work is properly
attributed. For permission for commercial use of this work, please see paragraphs 4.2 and 5 of our Terms.
© 2018 The Author(s). This work is published and licensed by Dove Medical Press Limited. The
full terms of this license are available at https://www.dovepress.com/terms
and incorporate the Creative Commons Attribution
- Non Commercial (unported, 3.0) License.
By accessing the work you hereby accept the Terms. Non-commercial uses of the work are permitted
without any further permission from Dove Medical Press Limited, provided the work is properly
attributed. For permission for commercial use of this work, please see paragraphs 4.2 and 5 of our Terms.