Back to Journals » Clinical Interventions in Aging » Volume 14
Effects of a fall prevention program in elderly: a pragmatic observational study in two orthopedic departments
Authors Røyset B ![]() , Talseth-Palmer BA, Lydersen S, Farup PG
, Talseth-Palmer BA, Lydersen S, Farup PG ![]()
Received 23 October 2018
Accepted for publication 12 December 2018
Published 15 January 2019 Volume 2019:14 Pages 145—154
DOI https://doi.org/10.2147/CIA.S191832
Checked for plagiarism Yes
Review by Single anonymous peer review
Peer reviewer comments 3
Editor who approved publication: Dr Richard Walker
Bodil Røyset,1 Bente A Talseth-Palmer,2–4 Stian Lydersen,5 Per G Farup6,7
1Department for Medicine and Rehabilitation, Møre og Romsdal Hospital Trust, Ålesund, Norway; 2Department for Research, Innovation, Education and Competence Development, Møre og Romsdal Hospital Trust, Molde, Norway; 3Department of Clinical and Molecular Medicine, Faculty of Medicine and Health Sciences, Norwegian University of Science and Technology, Trondheim, Norway; 4School of Biomedical Sciences and Pharmacy, Faculty of Health and Medicine, University of Newcastle and Hunter Medical Research Institute, Newcastle, NSW, Australia; 5Regional Centre for Child and Youth Mental Health and Child Welfare, Department of Mental Health, Faculty of Medicine and Health Sciences, Norwegian University of Science and Technology, Trondheim, Norway; 6Department of Research, Innlandet Hospital Trust, Brumunddal, Norway; 7Unit for Applied Clinical Research, Department of Clinical and Molecular Medicine, Faculty of Medicine and Health Sciences, Norwegian University of Science and Technology, Trondheim, Norway
Purpose: Falls are a common adverse event experienced by elderly in hospitals. This study assessed the effects of a fall prevention program on the rate of fallers, the patient safety culture, and patient-perceived safety.
Materials and methods: Two orthopedic departments in different towns in Norway participated in the study. A comprehensive, multifactorial fall prevention program was implemented in one of the departments, the other one was used for control. The changes in the outcomes in the two departments from before to after the intervention were compared. All patients above 64 years of age admitted to the two departments in a 1-year period before and after the intervention were included. All employees at the two departments were invited to participate in surveys measuring the patient safety culture, and a selection of the patients reported patient-perceived safety. The primary outcome was the rate of fallers. Secondary outcomes were the employees’ perceived patient safety culture (measured with the Safety Attitudes Questionnaire) and patient-perceived safety (measured with Norwegian Patient Experience Questionnaire).
Results: Falls were registered in 114 out of 3,143 patients (3.6%) with 17,006 days in the hospital. Ten patients had two falls, giving a fall rate of 7.3 falls/1,000 days in the hospital. The number of fallers before and after the intervention in the intervention department were 37/734 (5.04%) and 31/735 (4.22%), P=0.46, and in the control department, 25/811 (3.08%) and 21/863 (2.43%), P=0.46. The difference between the changes in the two departments was not statistically significant; 0.17% (95% CI: -2.49 to 2.84; P=0.90). There were also no significant differences in the changes in patient safety culture and patient-perceived safety.
Conclusion: The fall prevention program revealed no significant effect on the rate of fallers, the patient safety culture, or patient-perceived safety.
Keywords: accidental falls, accident prevention, adverse effects, patient safety, safety culture
Introduction
The report “To Err is Human,” published in 1999, estimated adverse events in hospitals to cause 44–98,000 deaths in the USA every year.1 The report draws attention to an important health care-related concern and has resulted in a significant increase in patient safety efforts, such as system-based interventions, practical clinical initiatives, and research. In 2004, the WHO established the network World Alliance for Patient Safety, which aims to coordinate, disseminate, and accelerate improvements in patient safety worldwide.2 Systems for reporting adverse events are in use internationally for quality assurance and patient safety.3–5
Worldwide, falls are one of the most commonly reported adverse events in hospitals with prevalence rates in the order of 10 per 1,000 patient days or 5%–15% of the patients and are associated with both minor and major injuries.6–8 Preventive measures have been taken with conflicting results. Overall, fall prevention exercise interventions have shown no effect, while vitamin D supplement has reduced the rate of falls but not the risk of falls in elderly in nursing homes.9,10 Multifactorial interventions in hospitals have shown a reduction in the rate of falls and an inconclusive trend for the risk of falling according to a Cochrane review.10 In large, fall prevention measures in hospitals have been disappointing.10–13
Norway has since 1994 had a national system for reporting adverse events in hospitals.14 The database has been used to plan and implement prevention activities related to frequent and serious adverse events. Eleven percent of all reports from the specialized health services were incidents related to falls.14
In January 2011, the Norwegian health minister launched a national patient safety campaign called “In Safe hands.”15 The campaign had three aims: 1) reduce patient-related adverse events, 2) build sustainable systems and structures for patient safety, and 3) improve the patient safety culture. Hospitals and primary care units were invited to participate in 16 specific and measurable areas for improvement; one of the areas was fall prevention. One out of four orthopedic departments at different sites in Møre og Romsdal Hospital Trust, Norway, participated actively in the national multifactorial fall prevention program.
This pragmatic observational study aimed to compare the differences in the changes from before to after the fall prevention intervention in the rate of fallers, the employees’ perceived patient safety culture, and the patient experienced safety between the department with the intervention and the department without the intervention in the same hospital trust. The hypothesis was that the fall intervention program would reduce the rate of fallers in the intervention department (ID) compared with the department without the intervention. A secondary aim was to study predictors of fallers.
Materials and methods
Study design
The study was performed in two orthopedic departments in Møre og Romsdal Hospital Trust, located in different cities. The hospital trust serves a population of 265,000 inhabitants. The ID served a population of 62,000 inhabitants and had ~1,400 admissions each year. The corresponding numbers for the control department (CD) were 95,000 inhabitants and 2,000 admissions. From November 2012 to September 2013, the fall prevention measures were implemented in one of the orthopedic departments hereafter referred to as the ID. The intervention was performed as proposed by the national patient safety campaign “In safe hands.”15 The department that did not participate in the safety campaign was used for comparison and will be referred to as the CD. Comparisons were made between two departments in the same hospital trust with approximately the same size and organizational culture, the same expectations and challenges from the director and the board, and well-matched patients from the same region.
In both departments, all falls were registered in a 12-month period before (from November 2011 to October 2012) and after (from November 2013 to October 2014) the intervention. Before (in April 2012) and after (in April 2014) the intervention, all employees in both departments were invited to participate in a survey, measuring patient safety culture. The survey was a part of the national patient safety campaign and performed anonymously.
Similarly, two cross-sectional studies conducted by The Norwegian Institute of Public Health were performed among a selection of patients admitted to the orthopedic department in 2012 and 2014 (before and after the intervention). They were invited to participate in a survey measuring patient-perceived safety. Figure 1 shows the timeline for data used in different analyses.
 | Figure 1 The study design. |
Participants
The fall registration included all patients above 64 years of age admitted to the ID and CD during the two registration periods and with a stay of at least 24 hours’ duration.
All employees at the two departments were invited to participate in surveys measuring the patient safety culture. The exact number of employees in the two departments asked to participate was unknown. Since the surveys were performed anonymously, no information was available on the subjects’ characteristics, and therefore no matching was possible.
Randomly selected patients from the two orthopedic departments were invited to participate in surveys measuring patient-experienced safety. The surveys were part of national surveys, and the number and characteristics of patients asked to participate are unknown.
Variables
Participants
The following data were registered for all patients admitted to the hospital during the two registration periods: age (years), gender, operation (yes/no), fall (yes/no; if yes, number of falls, point of time related to the admission, operation, and time of fall; daytime/evening/night), fall as the cause of admission (yes/no), fall causing fracture (yes/no), fall formally reported in the hospital’s systems for adverse events (yes/no), fall screening performed (yes/no), and the duration of the stay (days).
Fall
Fall was defined according to WHO as “an event which results in a person coming to rest inadvertently on the ground or floor or other lower level.”16
Falls were registered retrospectively. Four individuals shared the reviewing of all the medical records written by doctors, nurses, and physiotherapists during the registration periods. They read parts of the medical records and searched the records with appropriate keywords to retrieve and find information about all falls. Also, the hospital’s formal registry of adverse events was searched and the findings compared with the medical records.
Fall prevention interventions
Two doctors and three nurses from the ID participated in the Patient Safety Campaign’s national workgroup for prevention of falls. The group had meetings and published national guidelines that proposed tools, training programs, and improved procedures to prevent falls. The interventions were implemented in the ID.
The fall prevention program, not unlike the 6-PACK programme,13 was described in detail (in Norwegian).17 It consisted of 1) seven examples of risk factors which might cause falls (diseases and medications, movement, cognitive behavior, vision, continence, nutrition, and the room and surroundings), 2) methods to detect the risk factors, and 3) measures to avoid falls or protect the patient in case of a fall. The interventions were multifaceted and included short- and long-term activities to prevent falls. To detect risk factors, a fall screening was performed with the Norwegian version of the risk assessment tool for falls in elderly “STRATIFY” (score 0–5).18 Patients were scored on five risk factors, each of them is one point: falls last 3 months, reduced vision, uneasy patient, frequent visits to the toilet, and reduced walking/movement ability. Standard measures for all patients were a review of the medication and information about the room and the surroundings. There were individually tailored measures such as to lock the wheels of the bed and the tables, make sure that the patients can reach the alarm and their personal belongings, lower the bed to the lowest level, adjust day and night lightening, and remove furniture and equipment that may cause falls. In patients with a score of 2 or more, a comprehensive individual plan for fall prevention was worked out, documented in the medical records, and communicated to the staff responsible for the patient. The plan included practical initiatives like adjusting the beds, proper illumination, instructions not to leave the bed unaided, and the use of appropriate shoes. There were also long-term measures like the treatment of underlying diseases, changes in medication associated with the risk of fall, physical training, and healthier dietary habits. During the intervention, reports about the process (number of patients screened, etc) and the results (number of falls, etc) were regularly sent to the authorities. The governmental intervention was designed for use in hospitals, care facilities, and patients living at home. Most of the proposed activities aimed at preventing falls in a long time perspective. The fall intervention was added to the routine preventive measures, which were performed in the CD at the employees’ discretion. The patients were offered suitable, often low, beds with bed staffs, special surveillance if they were confused or dizzy, and were urged to ask for help if they wanted to get out of the bed.
Patient safety culture
Patient safety culture was measured with the validated Norwegian version of the Safety Attitudes Questionnaire (SAQ).19,20 The national campaign used only two factors (teamwork climate and safety climate) out of the six factors in the questionnaire. According to the scoring algorithm, some answers were recoded and the results transformed into a scale 0–100; high values indicate a good culture.
Patient-perceived safety
The Norwegian Patient Experience Questionnaire (PEQ) has been used regularly in Norwegian hospitals since 1996.21 This study used ten out of 52 questions that measure the patient-experienced patient safety.22 The answers were transformed according to the scoring algorithm into a scale 0–100; high values indicate high patient-perceived safety.
Statistics
The results have been reported as mean (SD), median (range), and number (with proportion in brackets). Comparisons between groups were analyzed with Fisher’s exact test, Student’s t-test, and Mann–Whitney U-test depending on the type of data and distribution, and logistic regression analyses for the study of predictors of falls. For continuous variables, the comparisons of changes from before to after the intervention were performed with linear regression with the point of time, department, and their interaction as covariates. For dichotomous variables, the risk difference was calculated with a semirobust generalized linear model for a binary outcome. In each analysis, we included all the cases with data on the relevant variables (“available case analysis”). P-values <0.05 were judged as statistically significant. The analyses were performed with IBM SPSS Statistics for Windows, version 23.0 (IBM Corporation, Armonk, NY, USA), except for the risk difference for dichotomous variables that were analyzed with STATA Release 13 (StataCorp LP, College Station, TX, USA).
Ethics approval
The project was approved by the Regional Committees for Medical and Health Research Ethics (REK) in Norway (approval number REK 2015/2469). A waiver of consent was granted in this study as the project was deemed not to be a medical or health research project according to the Health Research Act. By virtue of regulations of February 7, 2009, #989 REK is delegated authority to grant exemption from the duty of confidentiality pursuant to the Health Personnel Act, §29 first paragraph and the Act of First Amendment, §13 first paragraph, and a waiver of consent is given to obtain the data mentioned in the application (see registration variables under participants) as the project is of genuine interest to society and the data collection does not significantly interfere with the welfare and integrity of the patients. The data were anonymized after registration. The Norwegian Data Inspectorate represented by the Privacy Ombudsman for research at Møre og Romsdal Hospital Trust approved the responses to the questionnaires SAQ and PEQ for research after anonymization. The study was registered in ClinicalTrials.gov NCT03354468; date of registration: November 24, 2017; “Retrospectively registered.”
Results
In all, 3,143 patients with 17,006 days in the hospital were included in the study. Falls were noted in 114 patients, ten patients had two falls, which gave an overall fall rate of 3.6% of the patients or 7.3 falls/1,000 days in the hospital. Table 1 shows the patients’ characteristics and the results separately for the ID and CD with comparisons between the departments.
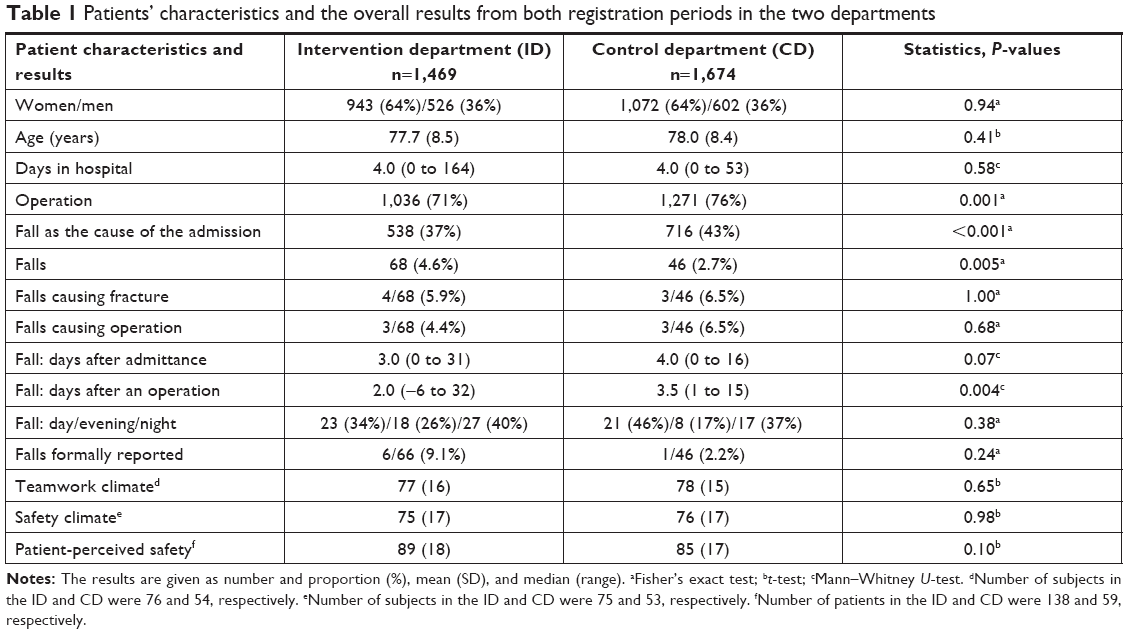 | Table 1 Patients’ characteristics and the overall results from both registration periods in the two departments |
The overall prevalence rates of fallers in both the registration periods in the ID and CD were 68/1,469 (4.6%) and 46/1,674 (2.7%), respectively (P=0.005), and the prevalence rates of fallers before and after the intervention were 62/1,545 (4.0%) and 52/1,598 (3.3%), respectively (P=0.30). Patients with falls had a longer stay in hospital compared with those who did not fall; the median lengths were 7 days (range 1–164) and 4 days (range 0–56), respectively (P<0.001). The prevalence rate of fallers in patients with and without an operation were 91/2,274 (4.0%) and 22/824 (2.7%), respectively (P=0.08). In the ID, the fall risk evaluation was performed in 327/727 (45%) of the patients after the intervention. The number of fallers in patients evaluated and not evaluated for fall risk were 17/327 (5.2%) and 14/400 (3.5%) (P=0.27), respectively, and the number of fallers formally registered in the hospital registry of adverse events before and after the intervention were 2/37 (5.4%) and 4/31 (12.9%) (P=0.40), respectively. Table 2 shows unadjusted and adjusted predictors of fallers.
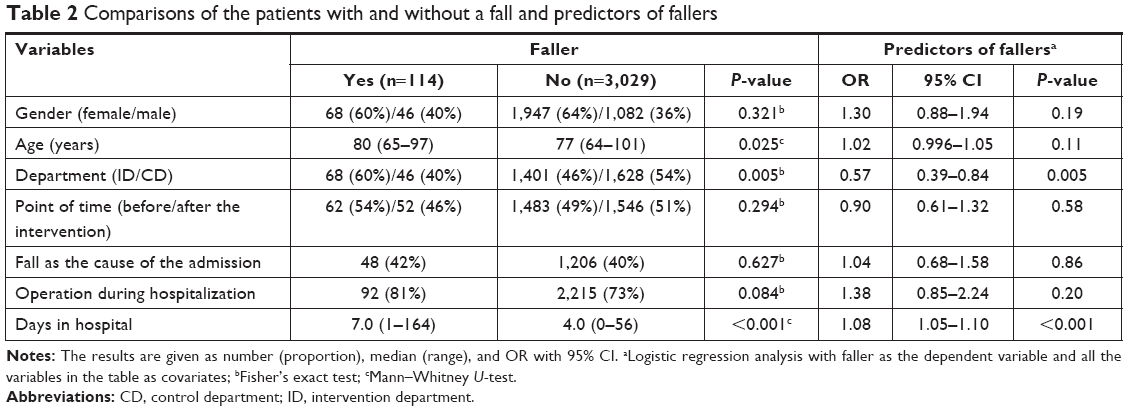 | Table 2 Comparisons of the patients with and without a fall and predictors of fallers |
In the ID and CD, the changes in the faller rates from before to after the intervention were 0.82% and 0.65%, respectively, the difference was not statistically significant (P=0.90). Table 3 shows the details and Figure 2A visualizes the main results.
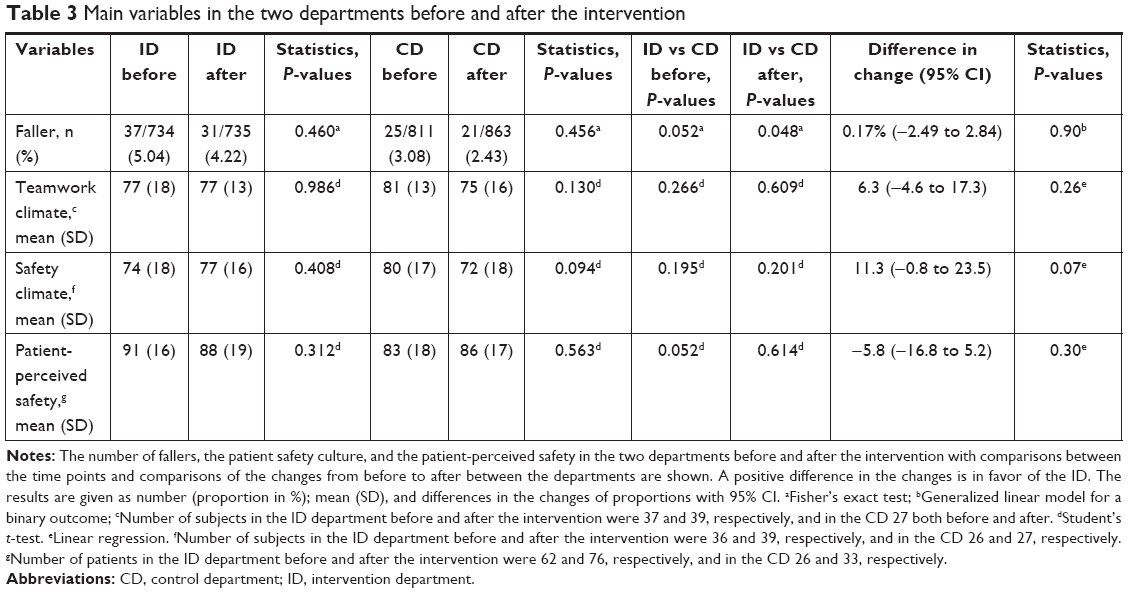 | Table 3 Main variables in the two departments before and after the intervention |
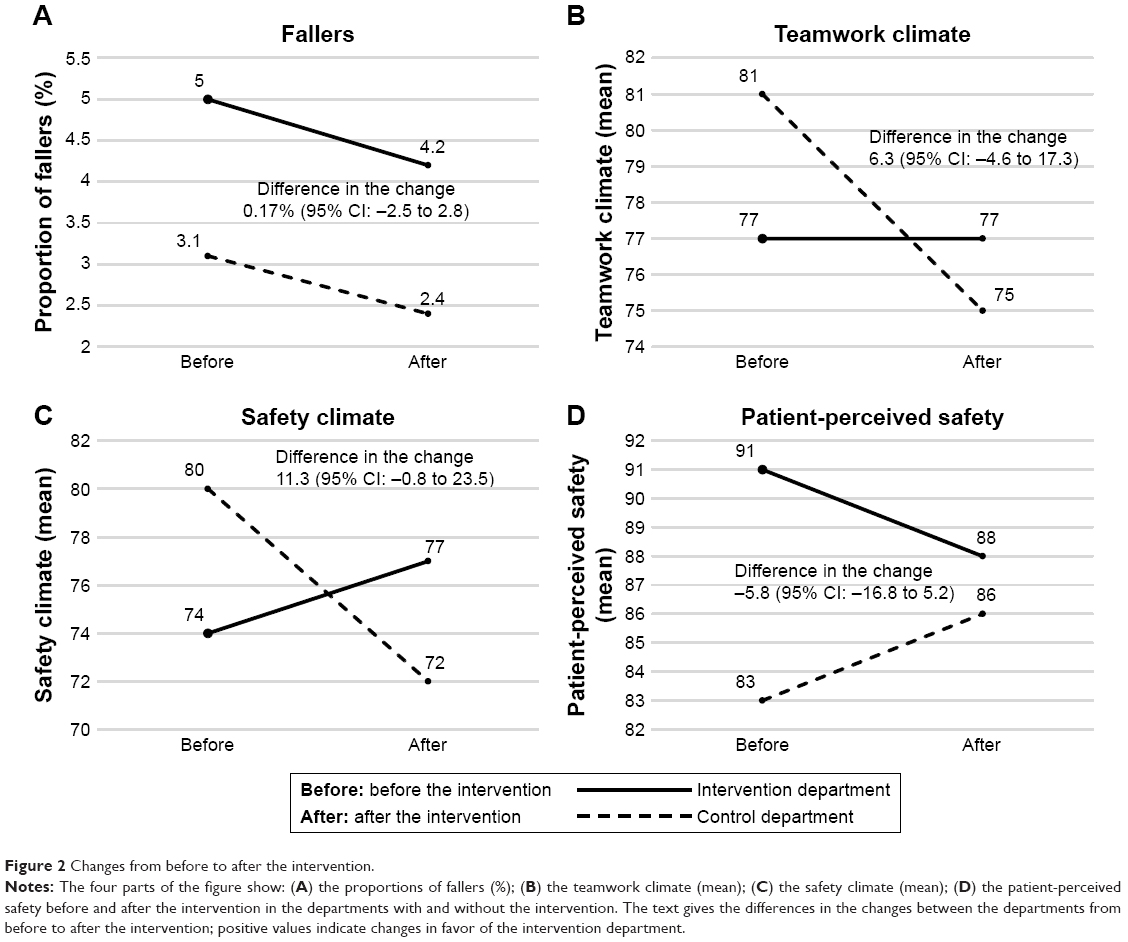 | Figure 2 Changes from before to after the intervention. |
In all, 130 and 128 employees had satisfactorily filled in the teamwork and safety culture parts of the SAQ, respectively. The patient safety culture did not differ significantly between the two departments. Table 1 shows the overall results in the two departments, and Table 3 shows the culture in the two departments before and after the intervention with comparisons between the departments and the time of registration. The changes in the teamwork and safety climate from the first to the second registration did not differ significantly between the departments.
Before and after the intervention, 62 and 76 patients in the ID and 26 and 33 patients in the CD, respectively, answered the patient-perceived safety questionnaire. The patient-perceived safety scores did not differ significantly between the departments and were not significantly influenced by the intervention. Table 1 shows the overall results, and Table 3 shows the results in the two departments before and after the intervention with comparisons between the departments and time of registration.
The main outcomes of the study were the comparisons of the changes in the faller rates, patient safety culture, and patient-perceived safety from before to after the intervention between the departments. There was no significant effect of the intervention in either of the variables (Table 3 – the column “Difference in change”). Figure 2A–D shows the results with the differences in changes between the departments from before to after the intervention.
Discussion
We observed no differences in the changes in the faller rates, patient safety culture, or patient-perceived safety from before to after the intervention between the two departments and conclude that the fall intervention had no clinically significant effect at the time of observation. An initial temporary effect during the implementation period might have been missed due to the long period between the two registrations (1 year).
The fall rate in this study (7.3 falls per 1,000 patient days in hospital) was in accordance with other studies on elderly patients.6,8 A more conscientious registration of falls in the medical records in the ID is the most likely explanation of the higher faller rate in this department compared with the CD. Patients with falls were older and had more days in the hospital, but only days in hospital was an independent predictor of fall. It is unknown if the fall caused prolongation of the stay in the hospital or if frail patients have more extended stays and more falls. Independent of the causation, patients with long stays should receive extra preventive interventions and surveillance. Both older age and length of stay, independent of injury caused by the fall, have been associated with fall in other studies.23,24 Risk factors associated with falls in other studies, but not in this one, are previous falls and gender.24,25 Information about falls over a longer period before the admission was not available. This information and not only fall as the cause of admittance could have been a predictor of falls.
The lack of effect on the faller rate could indicate that the intervention has added little to the routine fall prevention practice or that the observation period during the stay in the hospital was too short. Most of the interventions had a longer perspective (such as training of balance and strength, nutritional advice, and change of medication) and might have reduced the faller rate after discharge from the hospital. The intervention might have increased the attention to risk factors for falls but added little to the normal activities to prevent falls during a short stay in a busy hospital unit. Barker et al13 have questioned the time spent to fall risk screening and interventions in acute care hospitals, which was an essential part of the intervention in the current study, since they are often ineffective. Identifying new methods to reduce harm from falls and improve the observation of patients, such as environmental adaptations, intelligent sensor systems with alarms, videos, and icons might be better preventive measures.26 Reports from multifactorial and knowledge-based interventions made to decrease falls in hospitals are contradictory. Some have concluded that the interventions were ineffective.12,13 In a review of 17 trials from hospitals, Cameron et al10 concluded that multifactorial interventions reduced falls in hospitals, but the evidence for risk of falling was not conclusive. Individualized patient education programs combined with training and feedback to the staff might be a better way to reduce falls in older patients than fall intervention programs intended for staff only.27 This view has been supported by more recent studies.28,29 A systems-based fall prevention program has been shown to reduce the fall rate from 4.34 to 2.53 per 1,000 patient days.30
The faller rate declined in both departments from before to after the intervention. The report from the Norwegian Institute of Public Health in 2016 showed that the incidence of reported harm due to falls decreased after the national campaign in 2013 and 2014 but increased again in 2015.31 The overall reduction during the study period could, therefore, be related to the national campaign and not the specific intervention.
The duration of the stay in the hospital was, in addition to the department, the most important predictor of being a faller. It is unknown whether the long stay was caused by the fall or if frail elderly need longer stays and have a higher risk of falling. The reason for the differences between the departments remains unexplained.
The mean scores for teamwork climate and safety climate in this study were in the upper part of the measures from other hospitals using SAQ.20,32 An improvement in the patient safety culture from before to after the intervention was expected in the ID due to the focus on safety, but the culture was in large unchanged. The fall in the patient safety culture in the CD was likely due to local turbulence related to plans to reorganize the department, reduce the number of beds and employees, and new management. The nonsignificant difference in the change in the patient safety culture in favor of the ID during the study was due to the unfavorable effect in the CD and not a favorable effect in the ID.
The patient safety culture is assumed to reflect real patient safety. In this study, the local turbulence and deteriorated patient safety culture in the CD did not affect the faller rate. The association between patient safety culture and true patient safety, and the validity and reliability of the tools used for measuring patient safety culture and adverse events have been questioned.33,34 Reviews indicate an association between patient safety culture and patient outcomes, but the documentation has been questioned.34,35
The patient-perceived safety was of the same order as reported on the national level; the mean national score in 2014 was 86. The study did not show any effect of the intervention on patient-perceived safety. The tendency to a better patient-perceived safety in the ID than in the CD before the intervention might have occurred by chance. In a study with other instruments, patient satisfaction was higher in hospitals where the employees had a high score for patient safety culture.36
Strengths and limitations
Strengths
The departments were chosen because they were fairly similar except for participation in the campaign.
The intervention was multifactorial, which is assumed to be the most effective method, well planned on the national and local level, implemented after education and training of the staff, and strongly supported by the director.
The current study registered not only fallers but also the employees’ perceived patient safety culture and patient-perceived safety with validated questionnaires. We are not aware of other studies evaluating the effect of an intervention on all three variables. Measuring quality in different ways provides a qualified basis for assessing the effect of an intervention and the need for improvement.
The design with measurement of all the main variables before and after the intervention in the same hospital made comparisons of changes from before to after the intervention valid because other factors than the intervention influencing on the changes were in large the same.
Limitations
Registration of fallers and falls were performed retrospectively in the medical records and the hospital’s registry for adverse events. Since it is likely that some falls without medical consequences have been omitted in the medical records, a prospective registration would have been to prefer. The accuracy of the review of the medical records has also been crucial for the quality of the study. In all, the registration of falls might have been suboptimal. Monitoring of the falls in real time with, for example, wearable sensors might have improved the fall registration.37 The reviewers were not blinded. It is, however, no reason to believe that registration of falls differed between the departments or from before to after the intervention since the staff was unaware of the planning of the study and all reviewers of the medical records reviewed records from both departments and both points of time.
The response rates to the SAQ and PEQ questionnaires were unknown because the number of employees and patients receiving the questionnaires was not known. On the national level, the response rate to PAQ has been in the order of 60%.
The surveys used only parts of the questionnaires. SAQ used two out of six dimensions, and PEQ used ten out of 52 questions. The use of parts of questionnaires is not optimal, although the patient-experienced patient safety part of PEQ has been validated.22
It was disappointing that compliance with the fall screening intervention was only 45% in the ID after the intervention despite the use of plenty of resources. The low compliance shows the challenge of implementing new routines in the busy daily activity. Because the prevalence rate of fallers was low in this study and the study size was limited, the lack of effect could be a type II error.
The results of studies like this one are highly dependent on the fall intervention program, the implementation of the program, the compliance with the program, and the local routines. Also, the study design with only one ID and one CD opens for confounding. The low response rates among both the employees and the patients might have induced a selection bias. The validity is therefore questionable. Nevertheless, the study shows that quality improvement is difficult, resource demanding, and requires meticulous planning, which are generalizable knowledge.
Conclusion
The fall prevention program performed as a part of a national safety campaign revealed no effect on the rate of fallers, the patient safety culture, or the patient-perceived safety during a short stay in an orthopedic department. Since the recommended interventions included several long-term activities to prevent falls, a long-term follow-up will be of interest.
Acknowledgments
The authors thank the research coordinators Synnøve Herje and Elisabeth Tennøy Bjerkan, Clinical Research Unit, and research assistant Veronika Dybvik, Orthopedic department, Møre og Romsdal Hospital Trust for collecting the data from the medical records. They also thank Møre og Romsdal Hospital Trust for the funding.
Author contributions
BR has planned the study, has been responsible for the practical work including collecting of the data, has prepared the data files for the analyses, and has drafted the manuscript. BAT-P has supervised the local activities and taken part in all parts of the project including the analyses and preparation of the manuscript. SL has together with PGF been responsible for the statistical analyses. PGF has been the administrator of the project after the data were collected and processed further for the analyses, has performed most of the analyses, and has finalized the manuscript for publication. All authors have given valuable comments on the manuscript and approved the last version. All authors contributed to data analysis, drafting or revising the article, gave final approval of the version to be published, and agree to be accountable for all aspects of the work.
Disclosure
The authors report no conflicts of interest in this work.
Availability of data
Data from the medical records were transferred manually to an Excel file and anonymized. Anonymous data from the questioners SAQ and PEQ were received as Excel files. The data files were converted to the statistical programs SPSS and STATA for the analyses and are stored by Innlandet Hospital Trust, Brumunddal, Norway, on a server dedicated to research and with security according to the rules given by The Norwegian Data Protection Authority, Oslo, Norway. The data are available on request to the authors. The study was registered in ClinicalTrials.gov with ID number NCT03354468, date of registration: November 24, 2017; “Retrospectively registered.”
References
Institute of Medicine Committee on Quality of Health Care in America. In: Kohn LT, Corrigan JM, Donaldson MS, editors. To Err is Human: Building a Safer Health System. Washington (DC): National Academies Press (US); 2000. | ||
World Alliance for Patient Safety. 2004. Available from: http://www.who.int/patientsafety/worldalliance/en/. Accessed November 29, 2018. | ||
Tuttle D, Panzer RJ, Baird T. Using administrative data to improve compliance with mandatory state event reporting. Jt Comm J Qual Improv. 2002;28(6):349–358. | ||
Runciman WB, Williamson JA, Deakin A, Benveniste KA, Bannon K, Hibbert PD. An integrated framework for safety, quality and risk management: an information and incident management system based on a universal patient safety classification. Qual Saf Health Care. 2006;15(Suppl 1):i82–i90. | ||
National Reporting and Learning System. Available from: https://improvement.nhs.uk/resources/monthly-data-patient-safety-incident-reports/. Accessed November 29, 2018. | ||
Schwendimann R, Bühler H, De Geest S, Milisen K. Characteristics of hospital inpatient falls across clinical departments. Gerontology. 2008;54(6):342–348. | ||
Vassallo M, Vignaraja R, Sharma JC, Briggs R, Allen S. The relationship of falls to injury among hospital in-patients. Int J Clin Pract. 2005;59(1):17–20. | ||
Sahota O, Drummond A, Kendrick D, et al. REFINE (REducing Falls in In-patieNt Elderly) using bed and bedside chair pressure sensors linked to radio-pagers in acute hospital care: a randomised controlled trial. Age Ageing. 2014;43(2):247–253. | ||
El-Khoury F, Cassou B, Charles MA, Dargent-Molina P. The effect of fall prevention exercise programmes on fall induced injuries in community dwelling older adults: systematic review and meta-analysis of randomised controlled trials. BMJ. 2013;347:f6234. | ||
Cameron ID, Dyer SM, Panagoda CE, et al. Interventions for preventing falls in older people in care facilities and hospitals. Cochrane Database Syst Rev. 2018;9:CD005465. | ||
Morris R, O’Riordan S. Prevention of falls in hospital. Clin Med (Lond). 2017;17(4):360–362. | ||
Healey F. Preventing falls in hospitals. BMJ. 2016;532:i251. | ||
Barker AL, Morello RT, Wolfe R, et al. 6-PACK programme to decrease fall injuries in acute hospitals: cluster randomised controlled trial. BMJ. 2016;352:h6781. | ||
Report 2008–2011 for MedEvent: Reporting System for Adverse Events in Specialized Health Services. 2012. Available from: https://www.helsetilsynet.no/no/Norwegian-Board-of-Health-Supervision/Publications/Report-of-the-Norwegian-Board-of-Health-Supervision---2012/Report-2008-2011-for-MedEvent/. Accessed November 29, 2018. | ||
In safe hands. 2011. Available from: http://www.pasientsikkerhetsprogrammet.no/om-oss/english/the-norwegian-patient-safety-programme-in-safe-hands. Accessed November 29, 2018. | ||
Falls; 2017. Available from: http://www.who.int/mediacentre/factsheets/fs344/en/. Accessed November 29, 2018. | ||
The fall prevention program. 2014. Available from: http://www.pasientsikkerhetsprogrammet.no/om-oss/innsatsomr%C3%A5der/_attachment/3175?_download=false&_ts=14bdb0ce8bf (In Norwegian). Accessed November 29, 2018. | ||
Oliver D, Britton M, Seed P, Martin FC, Hopper AH. Development and evaluation of evidence based risk assessment tool (STRATIFY) to predict which elderly inpatients will fall: case-control and cohort studies. BMJ. 1997;315(7115):1049–1053. | ||
Deilkås ET, Hofoss D. Psychometric properties of the Norwegian version of the Safety Attitudes Questionnaire (SAQ), Generic version (Short Form 2006). BMC Health Serv Res. 2008;8:191. | ||
Sexton JB, Helmreich RL, Neilands TB, et al. The Safety Attitudes Questionnaire: psychometric properties, benchmarking data, and emerging research. BMC Health Serv Res. 2006;6:44. | ||
Pettersen KI, Veenstra M, Guldvog B, Kolstad A. The Patient Experiences Questionnaire: development, validity and reliability. Int J Qual Health Care. 2004;16(6):453–463. | ||
Bjertnaes O, Skudal KE, Iversen HH, Lindahl AK. The Patient-Reported Incident in Hospital Instrument (PRIH-I): assessments of data quality, test-retest reliability and hospital-level reliability. BMJ Qual Saf. 2013;22(9):743–751. | ||
Ackerman DB, Trousdale RT, Bieber P, Henely J, Pagnano MW, Berry DJ. Postoperative patient falls on an orthopedic inpatient unit. J Arthroplasty. 2010;25(1):10–14. | ||
Halfon P, Eggli Y, Van Melle G, Vagnair A. Risk of falls for hospitalized patients: a predictive model based on routinely available data. J Clin Epidemiol. 2001;54(12):1258–1266. | ||
Oliver D, Daly F, Martin FC, McMurdo ME. Risk factors and risk assessment tools for falls in hospital in-patients: a systematic review. Age Ageing. 2004;33(2):122–130. | ||
Cuttler SJ, Barr-Walker J, Cuttler L. Reducing medical-surgical inpatient falls and injuries with videos, icons and alarms. BMJ Open Qual. 2017;6(2):e000119. | ||
Hill AM, McPhail SM, Waldron N, et al. Fall rates in hospital rehabilitation units after individualised patient and staff education programmes: a pragmatic, stepped-wedge, cluster-randomised controlled trial. Lancet. 2015;385(9987):2592–2599. | ||
Melin CM. Reducing falls in the inpatient hospital setting. Int J Evid Based Healthc. 2018;16(1):25–31. | ||
France D, Slayton J, Moore S, et al. A multicomponent fall prevention strategy reduces falls at an academic medical center. Jt Comm J Qual Patient Saf. 2017;43(9):460–470. | ||
Lohse GR, Leopold SS, Theiler S, Sayre C, Cizik A, Lee MJ. Systems-based safety intervention: reducing falls with injury and total falls on an orthopaedic ward. J Bone Joint Surg Am. 2012;94(13):1217–1222. | ||
In safe hands. Available from: http://www.pasientsikkerhetsprogrammet.no/resultater/rapporter/_attachment/3763?_ts=1574e8142ea, page 24 (In Norwegian). Accessed November 29, 2018. | ||
Nguyen G, Gambashidze N, Ilyas SA, Pascu D. Validation of the safety attitudes questionnaire (short form 2006) in Italian in hospitals in the northeast of Italy. BMC Health Serv Res. 2015;15:284. | ||
Farup PG. Are measurements of patient safety culture and adverse events valid and reliable? Results from a cross sectional study. BMC Health Serv Res. 2015;15:186. | ||
DiCuccio MH. The relationship between patient safety culture and patient outcomes: a systematic review. J Patient Saf. 2015;11(3):135–142. | ||
Braithwaite J, Herkes J, Ludlow K, Testa L, Lamprell G. Association between organisational and workplace cultures, and patient outcomes: systematic review. BMJ Open. 2017;7(11):e017708. | ||
Mazurenko O, Richter J, Kazley AS, Ford E. Examination of the relationship between management and clinician perception of patient safety climate and patient satisfaction. Health Care Manage Rev. 2019:44(1):79–89. | ||
Rucco R, Sorriso A, Liparoti M, et al. Type and location of wearable sensors for monitoring falls during static and dynamic tasks in healthy elderly: a review. Sensors (Basel). 2018;18(5):E1613. |
 © 2019 The Author(s). This work is published and licensed by Dove Medical Press Limited. The
full terms of this license are available at https://www.dovepress.com/terms
and incorporate the Creative Commons Attribution
- Non Commercial (unported, 3.0) License.
By accessing the work you hereby accept the Terms. Non-commercial uses of the work are permitted
without any further permission from Dove Medical Press Limited, provided the work is properly
attributed. For permission for commercial use of this work, please see paragraphs 4.2 and 5 of our Terms.
© 2019 The Author(s). This work is published and licensed by Dove Medical Press Limited. The
full terms of this license are available at https://www.dovepress.com/terms
and incorporate the Creative Commons Attribution
- Non Commercial (unported, 3.0) License.
By accessing the work you hereby accept the Terms. Non-commercial uses of the work are permitted
without any further permission from Dove Medical Press Limited, provided the work is properly
attributed. For permission for commercial use of this work, please see paragraphs 4.2 and 5 of our Terms.