Back to Journals » Clinical Ophthalmology » Volume 9
Effect of hemodialysis on visual acuity, intraocular pressure, and macular thickness in patients with chronic kidney disease
Authors Chelala E, Dirani A ![]() , Fadlallah A, Slim E, Abdelmassih Y
, Fadlallah A, Slim E, Abdelmassih Y ![]() , Fakhoury H, Baz P, Bejjani R
, Fakhoury H, Baz P, Bejjani R
Received 17 September 2014
Accepted for publication 13 November 2014
Published 9 January 2015 Volume 2015:9 Pages 109—114
DOI https://doi.org/10.2147/OPTH.S74481
Checked for plagiarism Yes
Review by Single anonymous peer review
Peer reviewer comments 2
Editor who approved publication: Dr Scott Fraser
Elias Chelala,1,2,* Ali Dirani,1,2,* Ali Fadlallah,1,2 Elise Slim,1,2 Youssef Abdelmassih,1,2 Henry Fakhoury,3 Patrick Baz,1,2 Riad Bejjani1,2
1Faculty of Medicine, Saint-Joseph University, 2Hôtel-Dieu de France Hospital, Saint-Joseph University, 3Eye and Ear Hospital, Beirut, Lebanon
*These two authors contributed equally to this work
Background: The aim of this study was to evaluate the effects of hemodialysis (HD) on visual acuity, intraocular pressure (IOP), and central foveal thickness (CFT) in patients with chronic kidney disease.
Materials and methods: Forty-nine eyes from 49 chronic kidney-disease patients were analyzed. Causes of chronic kidney disease included diabetes mellitus (n=9 patients), hypertensive nephrosclerosis (n=15 patients), and other causes (n=25 patients). All patients underwent HD in the Dialysis Unit of Hôtel-Dieu de France Hospital. Best-corrected visual acuity, CFT, and IOP were evaluated before and after HD. CFT was measured with spectral domain optical coherence tomography, and IOP was measured with Goldmann applanation tonometry.
Results: Neither decimal best-corrected visual acuity (pre-HD 0.71±0.32, post-HD 0.72±0.31; P=0.877) nor CFT (pre-HD 251.39±39.29, post-HD 253.09±39.26; P=0.272) significantly changed after HD. However, mean IOP significantly decreased from 13.99±2.48 before HD to 12.65±2.41 mmHg after HD (P=0.001). IOP change was significantly correlated with serum albumin levels (P=0.008) and weight changes (P=0.047).
Conclusion: HD can affect various ocular parameters. This is particularly true of IOP, which decreases significantly following HD.
Keywords: chronic kidney disease, hemodialysis, visual acuity, central macular thickness, intraocular pressure
Background
Patients with chronic kidney disease (CKD) are generally treated using a blood-filtration mechanism, such as hemodialysis (HD). During HD, numerous metabolic parameters can change, including blood urea, sodium, potassium, and glucose levels. These fluctuations result in osmotic changes in blood, aqueous and vitreous humor, and other extracellular fluids. Visual acuity, intraocular pressure (IOP), and retinal thickness can also be affected.
The effects of HD on the eyes of CKD patients can vary widely. These include changes in visual acuity, IOP, retinal thickness, and refraction.1 Changes in the ocular surface have also been observed. In addition, pathologies of the cornea, conjunctiva, lens, and/or retina can develop during an HD-treatment period. Disturbances in the retrobulbar circulation have also been documented following HD.2–6 In contrast, some studies have reported no changes in ocular parameters following HD, a difference that could have resulted from examining different CKD subgroups. Unfortunately, few reports have compared ocular parameter changes with HD between different CKD subtypes.
This study examined the short-term changes in ophthalmologic findings, including best-corrected visual acuity (BCVA), IOP, and central foveal thickness (CFT) before and after a single HD session. The relationships between these changes and systemic hemodynamic parameters (eg, body weight and systolic and diastolic arterial blood pressure after HD) were evaluated. Finally, the effects of HD on the eye were evaluated and compared between cases of kidney diseases caused by diabetes mellitus (DM), hypertension, and other causes.
Materials and methods
Subjects
This prospective study was conducted in 2012, and included 49 CKD patients (27 male and 22 female patients) who were undergoing HD in the Dialysis Unit of Hôtel-Dieu de France Hospital (Beirut, Lebanon). Informed consent was obtained from all subjects, and study conduct adhered to the Declaration of Helsinki. Institutional review board approval was also obtained from the Hôtel-Dieu de France Hospital. Subjects included in the study generally underwent two or three 3- to 4-hour-long HD sessions each week. The characteristics of the HD session were as follows: conventional HD, consisting of a schedule of two or three HD sessions per week using a Hospal Integra monitor, using a dialyzer with a 2 m2 polyarylethersulfone membrane (kUF 27.1 mL/h/mmHg, Qd 500 mL/min with a composition of sodium 140, calcium 3 mg 0.75, and K 1.5 mEq/L).
Patients were included in the study if they had a BCVA better than 20/200 and were willing and able to undergo a complete ophthalmologic examination. Exclusion criteria included the presence of an ocular disease that would interfere with retinal examination and/or IOP measurement and prior ocular surgery, laser therapy, or intraocular injection within 3 months of enrollment.
Study examinations
A detailed ophthalmologic examination was performed on each subject, which included measurements of BCVA, IOP, and macular thickness. Each measurement was made on every subject within an hour before beginning and within an hour after completing a single HD session. BCVA was assessed using a Snellen scale, and is reported as decimal BCVA. IOP was measured using a slit-lamp mounted Goldmann applanation tonometer, and central macular thickness (CMT) was measured using spectral domain optical coherence tomography (SD-OCT) macular mapping (Optovue, Fremont, CA, USA) to obtain a macular thickness map. The central foveal subfield-thickness measurement was used in analyses. Additionally, pre- and post-HD venous blood samples were collected through standard venipuncture techniques to measure serum albumin, sodium, and urea levels. Body weight and blood pressure were also measured before and after HD.
Statistical analyses
Ophthalmologic data were collected from the right eyes of all subjects. A Wilcoxon signed-rank test was used to compare BCVA, IOP, and CMT before and after HD sessions. A Pearson correlation test was used to examine possible relationships between changes in ophthalmologic parameters and other measured parameters. Statistical software (SPSS version 17.0; SPSS, Chicago, IL, USA) was used to perform all statistical analyses, with statistical significance defined as a P-value <0.05.
Results
Demographic characteristics
A total of 49 patients (27 male and 22 female patients) were enrolled in this study. Average patient age was 68.0±12.7 years, and subjects had been undergoing dialysis for a mean period of 5.2±4.1 years. Causes of CKD are summarized in Table 1, and included DM (group 1, nine patients), hypertensive nephrosclerosis (group 2, 15 patients), and other causes (group 3, 25 patients).
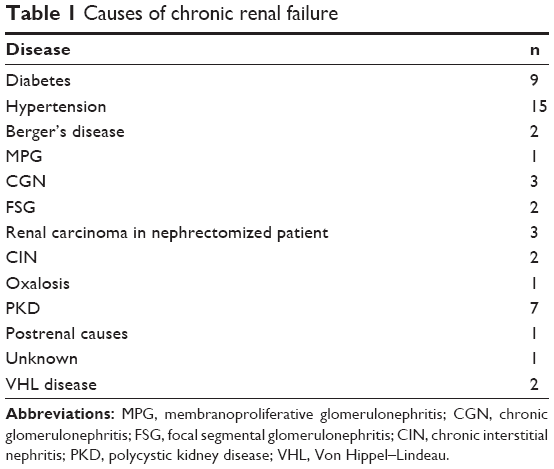 | Table 1 Causes of chronic renal failure |
Effects of HD
A statistically significant change from pre-HD values in body weight, systolic blood pressure, diastolic blood pressure, and sodium level were observed following an HD session (P<0.001), as summarized in Table 2. Mean changes in body weight, systolic blood pressure, diastolic blood pressure, and serum sodium concentration were 2.4±0.9 kg, 21.7±22.5 mmHg, 8.1±17.3 mmHg, and 3.0±3.2 mmol/L, respectively. The urea-reduction ratio (URR) was 0.73±0.06.
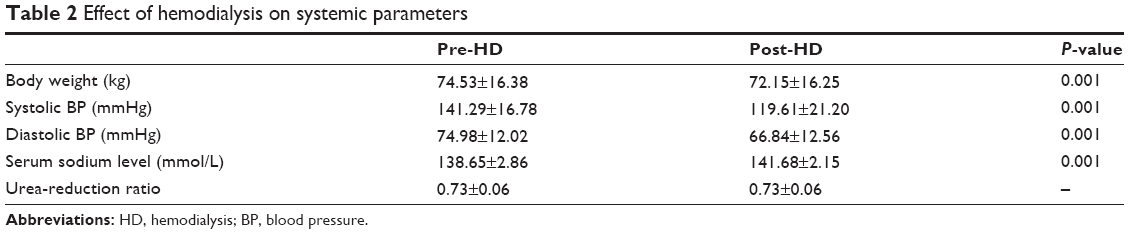 | Table 2 Effect of hemodialysis on systemic parameters |
BCVA (pre-HD 0.71±0.32, post-HD 0.72±0.31; P=0.877) and CMT (pre-HD 251.39±39.29 μm, post-HD 253.09±39.26; P=0.272) did not significantly change in a single HD session, but mean IOP was significantly reduced from 13.99±2.48 mmHg before HD to 12.65±2.41 mmHg after HD (P=0.001). Additionally, HD did not affect the eyes of patients with different CKD subtypes differently, as summarized in Tables 3 and 4. Within each group, BCVA and CMT were not affected by one HD session, but IOP was significantly decreased (Tables 3 and 4).
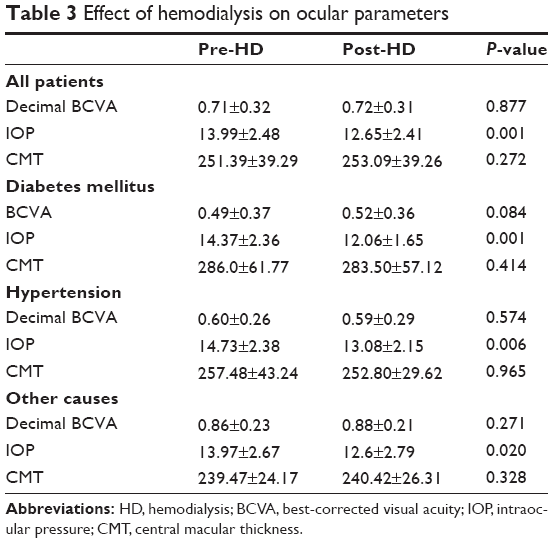 | Table 3 Effect of hemodialysis on ocular parameters |
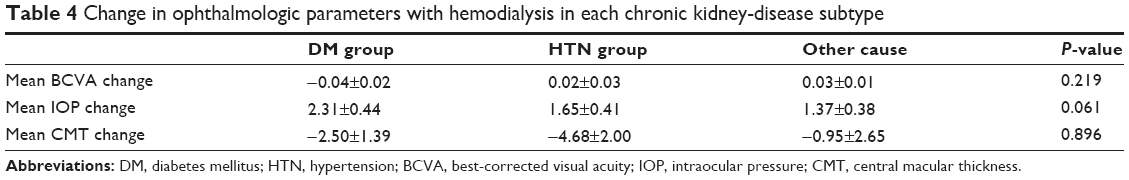 | Table 4 Change in ophthalmologic parameters with hemodialysis in each chronic kidney-disease subtype |
An analysis was performed to determine if HD-induced changes in IOP were correlated with baseline serum albumin levels, sodium levels, systolic blood pressure, diastolic blood pressure, and weight. HD-induced changes in these parameters were also examined, along with URRs and ultrafiltration rates (Table 5). Changes in IOP were significantly correlated with baseline albumin levels (P=0.008) and weight changes (P=0.047).
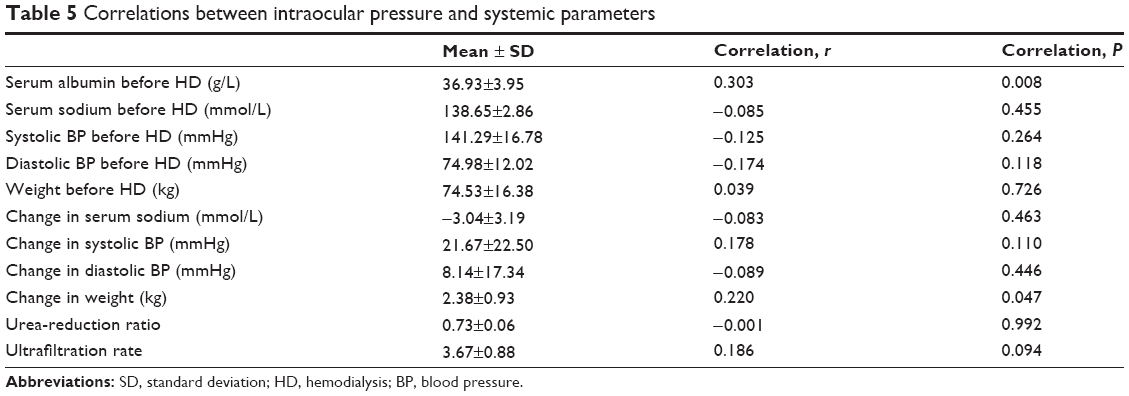 | Table 5 Correlations between intraocular pressure and systemic parameters |
Diabetic chronic kidney disease subjects
Two patients with CKD from DM were diagnosed with diabetic retinopathy: one patient with nonproliferative diabetic retinopathy, and one patient with proliferative diabetic retinopathy. The patient with proliferative diabetic retinopathy had undergone a previous panretinal photocoagulation laser treatment. Additionally, four patients had diabetic macular edema at the time of enrollment. These patients had previously undergone focal and grid laser therapy or intravitreal injection for diabetic macular edema. All laser and injection therapies had been performed more than 3 months before study enrollment. In this subgroup of patients, BCVA was not changed by a single HD session (pre-HD 0.36±0.26, post-HD 0.29±0.32; P=0.837). CMT was slightly decreased (pre-HD 393.5±42.5 μm, post-HD 385.3±49.0 μm), but this small change was not statistically significant (P=0.317).
Discussion
During HD, numerous metabolic parameters change, including blood urea, sodium, potassium, and glucose levels, which also induce osmotic changes in blood and extracellular fluids. This includes the aqueous and vitreous humor, changes in which can result in visual acuity, IOP, and retinal thickness changes. In our study, BCVA did not significantly change following a single HD session, but IOP significantly decreased from 13.99±2.48 mmHg before HD to 12.65±2.41 mmHg after HD. This IOP change was significantly correlated with pre-HD serum albumin levels and weight change. CMT, as measured on SD-OCT, was not significantly affected by HD.
Many conflicting results have been published on the effects of HD on IOP. This remains controversial, but many theories have been proposed to explain these varying results. Rever et al7 concluded that IOP did not significantly change during HD, whether acetate or bicarbonate was used in the dialysate.
Our study demonstrated a slight but significant decrease in IOP with HD that was independent of end-stage renal disease cause. Our findings also revealed that changes in IOP were significantly correlated with pre-HD albumin levels and weight change during HD. However, IOP changes were not correlated with HD-induced changes in serum sodium, blood pressure, URR, ultrafiltration rate, or blood pressure changes.
Other studies have shown similar results, with reductions in IOP varying between 0.8 and 1.3 mmHg. Unfortunately, few of these reports proposed a mechanism by which this IOP reduction occurred.7–9 Tokuyama et al10 related IOP reduction to ultrafiltration rate by the mean of albumin level. Ultrafiltration leads to a gradual reduction of extracellular fluid. Oncotic pressure increases due to ultrafiltration because large proteins, such as albumin and globulin, cannot cross the membranes, so there will be a colloid gradient between plasma and interstitial fluid and water moves from the interstitial and aqueous humor to plasma fluid. These changes in oncotic pressure and ultrafiltration lead to a decline in IOP at the end of dialysis. IOP change is greater with a higher plasma albumin level and degree of ultrafiltration (greater weight change).10
Underestimating IOP values after HD sessions can happen because of decreases in central corneal thickness induced by fluid loss.7 Jung et al11 showed a significant decrease in central corneal thickness during HD (mean change of approximately 7 μm), and that CMT and IOP changes were positively correlated. Broekema et al12 suggested that despite a decrease in blood osmolality, other regulatory forces prevent significant fluctuations in IOP during HD. In that study, the IOP decrease was more pronounced in nondiabetic patients than in diabetic patients, possibly due to fluctuations in blood glucose levels. Other studies have shown significant correlations between serum osmolarity and IOP fluctuations during HD. These reports proposed that a difference in ocular fluid and plasma osmolarity can result in IOP fluctuations.12,13 This IOP increase was also more pronounced in patients with obstructed aqueous outflow pathways.14
Tovbin et al15 implied that postdialysis urea rebound (PDUR) changes are related to IOP changes during HD. During the HD procedure, urea removal from the cellular compartment lags behind its removal from the extracellular compartment, creating a gap between cellular and serum urea levels. This gap is reversed as urea moves from cells to the extracellular fluid after dialysis, as reflected in PDUR. This gap may induce water movement from extracellular fluid to intracellular spaces during dialysis. In the report, it was suggested that PDUR is strongly correlated with intradialytic changes in IOP, and that these changes can predict IOP elevations in the presence of lower hemoconcentrations during dialysis.15,16 In our study, we did not observe a significant relationship between IOP changes and URR.
In eyes with glaucoma, narrow angles, or impaired aqueous outflow, acute rises in IOP during HD could occur much more frequently than in normal patients. Lower plasma osmolarity, compared to aqueous humor osmolarity, and a relative increase in aqueous humor-urea concentration may contribute to increases in IOP.16 Observed differences in IOP fluctuations may also have resulted from differences in dialysis technique and duration.16
HD patients often complain of both acute and chronic vision changes. Acute changes could be secondary to changes in parameters during HD, but chronic changes most often result from eye disease secondary to the primary cause of renal insufficiency (eg, diabetes mellitus, hypertension). In the current study, BCVA was not significantly different before and after a single HD session, but the largest changes were observed in patients with diabetes-related renal failure. Interestingly, diabetic patients tended to show improvements in BCVA with HD, but these changes were not significant. Furthermore, diabetic patients tended to begin dialysis with a lower BCVA than nondiabetic patients. In agreement with our results, other studies have demonstrated a positive correlation between BCVA and blood glucose, as well as an association with a history of diabetic retinopathy.17
Tomazzoli et al18 showed that a change in refraction was noted in 64% of eyes in HD patients, and that this change was always toward hyperopia. We did not examine refractive properties of the eye in our study. It has also been shown that older diabetic patients have more severe visual impairment than their younger counterparts, and that this impairment is generally less amenable to correction.19
Overall, visual acuity depends on the health of the cornea, lens, and retina, as well as the axial length, all of which are prone to change during HD and with blood glucose fluctuations.11,20 Our study demonstrated a significant decrease in IOP during an HD session, which can affect visual acuity from resulting changes in corneal thickness and corneal refractive power. Additionally, it has been shown that blood glucose fluctuations, which affect plasma osmolarity, can alter IOP, zonular tension, anterior-chamber depth, and lens thickness, all of which can affect visual acuity.21
Giusti22 demonstrated that hyperglycemia affects visual acuity by causing a hyperopic shift. Hyperopic changes were positively correlated with blood glucose levels and were reversed with correction of hyperglycemia. The most accepted explanation for these refractive changes stems from lens-osmolarity and sorbitol-production changes, which result from excess hydration of the lens. This directly results in alterations of lens shape and refractive power.22
Other studies have related changes in vision with HD to changes in the retina, particularly macular thickness. This would help explain vision changes in patients who do not have fluctuations in blood glucose levels during HD.23,24 Another line of thinking suggests that HD-induced visual acuity changes result from ocular surface changes. Both tear-breakup time and basal tear secretion (as measured by Schirmer’s test) have been shown to decrease during HD, with a concomitant increase in keratoepitheliopathy score.11
Finally, several studies have shown that HD affects retinal thickness. Macular thickness improvements have been observed with HD.25,26 These studies had different follow-up periods. Additionally, they examined retinal thickness using fluorescein angiography and ophthalmoscopy. In contrast, we found no significant effect of HD on CMT, as measured with SD-OCT. This is in agreement with the results of more recent studies, which used OCT to measure both retinal and foveal thickness. Pahor et al27 demonstrated a significant decrease in retinal thickness, but not subfoveal thickness, in all retinal quadrants following HD. Ulaş et al28 found no change in foveal, temporal, or nasal retinal thickness, but did observe a significant reduction in choroidal thickness in all four quadrants of 21 patients. Yang et al20 found similar results, along with a correlation between choroidal thinning and body-weight reductions. Auyanet et al24 found that some HD parameters could affect macular thickness, especially bath temperature and conductivity. Lastly, Jung et al11 recently demonstrated a significant decrease in central subfoveal thickness of approximately 7 μm, but this decrease was not correlated with any systemic parameter. We also found no significant decrease in CMT with dialysis. It may be that thickness is affected by how far into HD measurements are made. The first studies to show that HD improved macular edema were done using fluorescein angiography in patients who had recently begun HD, but more recent OCT studies were done on chronic HD patients. The cause of renal failure and the extent of diabetic retinopathy could also affect how CMT changes with dialysis.
In conclusion, all causes of CKD can directly affect the eyes, but ocular changes can also result from HD itself. Decreases in IOP and changes in vision have been shown to occur after HD, especially in diabetic patients. However, changes in vision were not statistically significant in our study. Additionally, HD did not change CMT, as measured with OCT.
Disclosure
The authors report no conflicts of interest in this work.
References
Vrabec R, Vatavuk Z, Pavlović D, et al. Ocular findings in patients with chronic renal failure undergoing haemodialysis. Coll Antropol. 2005; 29 Suppl 1:95–98. | ||
Diaz-Couchoud P, Bordas FD, Garcia JR, Camps EM, Carceller A. Corneal disease in patients with chronic renal insufficiency undergoing hemodialysis. Cornea. 2001;20(7):695–702. | ||
Charlton JF, Schwab IR, Stuchell R. Tear hyperosmolarity in renal dialysis patients asymptomatic for dry eye. Cornea. 1996;15(4):335–339. | ||
Niutta A, Spicci D, Barcaroli I. Fluoroangiographic findings in hemodialyzed patients. Ann Ophthalmol. 1993;25(10):375–380. | ||
Tosun O, Davutluoglu B, Arda K, et al. Determination of the effect of a single hemodialysis session on retrobulbar blood hemodynamics by color Doppler ultrasonography. Acta Radiol. 2007;48(7):763–767. | ||
Mullaem G, Rosner MH. Ocular problems in the patient with end-stage renal disease. Semin Dial. 2012;25(4):403–407. | ||
Rever B, Fox L, Bar-Khayim Y, Nissenson A. Adverse ocular effects of acetate hemodialysis. Kidney Int. 1981;19(1):157. | ||
Dinc UA, Ozdek S, Aktas Z, Guz G, Onol M. Changes in intraocular pressure, and corneal and retinal nerve fiber layer thickness during hemodialysis. Int Ophthalmol. 2010;30(4):337–340. | ||
Afshar R, Ghasemi H, Shabpiray H, et al. Monitoring of intraocular pressure and its correlation with systemic parameters before and after hemodialysis. Iran J Kidney Dis. 2013;7(1):53–59. | ||
Tokuyama T, Ikeda T, Ishikawa H, Sato K. Marked decrease in intraocular pressure in a neovascular glaucoma patient during hemodialysis. Jpn J Ophthalmol. 1997;41(2):101–103. | ||
Jung JW, Yoon MH, Lee SW, Chin HS. Effect of hemodialysis (HD) on intraocular pressure, ocular surface, and macular change in patients with chronic renal failure. Effect of hemodialysis on the ophthalmologic findings. Graefes Arch Clin Exp Ophthalmol. 2013;251(1):153–162. | ||
Broekema N, van Bijsterveld OP, de Bos Kuil RJ. Intraocular pressure during hemodialysis. Ophthalmologica. 1988;197(2):60–64. | ||
Leiba H, Oliver M, Shimshoni M, Bar-Khayim Y. Intraocular pressure fluctuations during regular hemodialysis and ultrafiltration. Acta Ophthalmol (Copenh). 1990;68(3):320–322. | ||
Dujić M, Marković P, Jovanović D, Dragićević P, Radovanović L. [Changes in intraocular pressure during dialysis]. Srp Arh Celok Lek. 1997;125(9–10):257–260. Serbian. | ||
Tovbin D, Belfair N, Shapira S, et al. High postdialysis urea rebound can predict intradialytic increase in intraocular pressure in dialysis patients with lowered intradialytic hemoconcentration. Nephron. 2002;90(2):181–187. | ||
Levy J, Tovbin D, Lifshitz T, Zlotnik M, Tessler Z. Intraocular pressure during haemodialysis: a review. Eye (Lond). 2005;19(12):1249–1256. | ||
Ghasemi H, Afshar R, Zerafatjou N, et al. Impact of hemodialysis on visual parameters in patients with end-stage renal disease. Iran J Kidney Dis. 2012;6(6):457–463. | ||
Tomazzoli L, De Natale R, Lupo A, Parolini B. Visual acuity disturbances in chronic renal failure. Ophthalmologica. 2000;214(6):403–405. | ||
Bloomgarden ZT. Screening for and managing diabetic retinopathy: current approaches. Am J Health Syst Pharm. 2007;64(17 Suppl 12): S8–S14. | ||
Yang SJ, Han YH, Song GI, Lee CH, Sohn SW. Changes of choroidal thickness, intraocular pressure and other optical coherence tomographic parameters after haemodialysis. Clin Exp Optom. 2013;96(5):494–499. | ||
Furushima M, Imaizumi M, Nakatsuka K. Changes in refraction caused by induction of acute hyperglycemia in healthy volunteers. Jpn J Ophthalmol. 1999;43(5):398–403. | ||
Giusti C. Transient hyperopic refractive changes in newly diagnosed juvenile diabetes. Swiss Med Wkly. 2003;133(13–14):200–205. | ||
Theodossiadis PG, Theodoropoulou S, Neamonitou G, et al. Hemodialysis-induced alterations in macular thickness measured by optical coherence tomography in diabetic patients with end-stage renal disease. Ophthalmologica. 2012;227(2):90–94. | ||
Auyanet I, Rodríguez LJ, Bosch E, et al. Measurement of foveal thickness by optical coherence tomography in adult haemodialysis patients with diabetic nephropathy. Nefrologia. 2011;31(1):66–69. | ||
Bresnick GH, Mukamel DB, Dickinson JC, Cole DR. A screening approach to the surveillance of patients with diabetes for the presence of vision-threatening retinopathy. Ophthalmology. 2000;107(1):19–24. | ||
Perkovich BT, Meyers SM. Systemic factors affecting diabetic macular edema. Am J Ophthalmol. 1988;105(2):211–212. | ||
Pahor D, Gracner B, Gracner T, Hojs R. [Optical coherence tomography findings in hemodialysis patients]. Klin Monbl Augenheilkd. 2008;225(8):713–717. German. | ||
Ulaş F, Doğan Ü, Keleş A, Ertilav M, Tekçe H, Celebi S. Evaluation of choroidal and retinal thickness measurements using optical coherence tomography in non-diabetic haemodialysis patients. Int Ophthalmol. 2013;33(5):533–539. |
 © 2015 The Author(s). This work is published and licensed by Dove Medical Press Limited. The
full terms of this license are available at https://www.dovepress.com/terms
and incorporate the Creative Commons Attribution
- Non Commercial (unported, 3.0) License.
By accessing the work you hereby accept the Terms. Non-commercial uses of the work are permitted
without any further permission from Dove Medical Press Limited, provided the work is properly
attributed. For permission for commercial use of this work, please see paragraphs 4.2 and 5 of our Terms.
© 2015 The Author(s). This work is published and licensed by Dove Medical Press Limited. The
full terms of this license are available at https://www.dovepress.com/terms
and incorporate the Creative Commons Attribution
- Non Commercial (unported, 3.0) License.
By accessing the work you hereby accept the Terms. Non-commercial uses of the work are permitted
without any further permission from Dove Medical Press Limited, provided the work is properly
attributed. For permission for commercial use of this work, please see paragraphs 4.2 and 5 of our Terms.