Back to Journals » Therapeutics and Clinical Risk Management » Volume 12
Effect of biological factors on successful measurements with skeletal-muscle 1H-MRS
Authors Isobe T, Okamoto Y, Hirano Y, Ando H, Takada K, Sato E, Shinoda K, Tadano K, Takei H, Kamizawa S, Mori Y, Suzuki H
Received 11 March 2015
Accepted for publication 7 February 2016
Published 20 July 2016 Volume 2016:12 Pages 1133—1137
DOI https://doi.org/10.2147/TCRM.S84371
Checked for plagiarism Yes
Review by Single anonymous peer review
Peer reviewer comments 3
Editor who approved publication: Professor Garry Walsh
Tomonori Isobe,1 Yoshikazu Okamoto,1 Yuji Hirano,2 Hiroki Ando,3 Kenta Takada,1 Eisuke Sato,4 Kazuya Shinoda,5 Kiichi Tadano,4 Hideyuki Takei,2 Satoshi Kamizawa,1 Yutaro Mori,3 Hiroaki Suzuki1
1Faculty of Medicine, University of Tsukuba, Ibaraki, Japan; 2Department of Radiology, University of Tsukuba Hospital, Ibaraki, Japan; 3Graduate School of Comprehensive Human Sciences, University of Tsukuba, Ibaraki, Japan; 4Department of Medical Radiological Technology, Faculty of Health Sciences, Kyorin University, Tokyo, Japan; 5Department of Radiology, Tsukuba Medical Center Hospital, Ibaraki, Japan
Background: Our purpose in this study was to clarify whether differences in subject group attributes could affect data acquisition in proton magnetic resonance spectroscopy (1H-MRS).
Methods: Subjects without diabetes mellitus (DM) were divided into two groups (group A, in their 20s; group B, 30–60 years old). Subjects with DM formed group C (30–60 years old). The numbers of subjects were 19, 27, and 22 for group A, B, and C respectively. For all subjects, 1H-MRS measurements were taken of the soleus muscle (SOL) and the anterior tibial muscle (AT). We defined the success of the measurements by the detection of intramyocellular lipids. Moreover, we also measured the full width at half maximum of the water peaks for all subjects.
Results: The success rate was significantly higher for the AT (100%) than for the SOL (81.6%) (P<0.01). For the SOL, the success rate was 100% in group A, 85.2% in group B, and 77.3% in group C. There was a significant difference (P<0.05) between groups A and B, as well as between groups A and C. In all subjects, there was a significant difference (P<0.01) in the full width at half maximum (Hz) of the water peak between the AT and SOL measurements.
Conclusion: We conclude that differences in the age and DM history of subjects could affect the probability of successful 1H-MRS data acquisition.
Keywords: MRS, skeletal muscle, IMCL, EMCL, biological factor, FWHM
Introduction
Magnetic resonance spectroscopy (MRS) is a very useful tool for noninvasively acquiring important in vivo biochemical information.
Several kinds of atomic nuclei are used in MRS. Protons (1H) exist in numerous body parts; therefore, the proton magnetic resonance spectroscopy (1H-MRS) method of detecting chemical shifts of 1H can be very useful for applications in clinical settings because 1H-MRS produces a strong MR signal, resulting in a higher signal-to-noise ratio. The usefulness extends to in vivo study of human metabolism, studies of different disease states and effects of interventions.
Conventionally, 1H-MRS has been used only in the field of neuroradiology.1–3 However, it was not common for studies of skeletal muscle due to a difficulty in shimming. Recently, it has also been applied in studies of skeletal muscle, and has recently gained popularity for the measurement of fat metabolism.4
As for MRS of skeletal muscle, 31P and 13C have been studied in addition to 1H. 31P and 13C have been used mainly for assessment of the metabolisms of phosphate compounds5,6 and glycogen.7,8
Boesch et al reported that skeletal muscle 1H-MRS could differentiate intramyocellular lipids (IMCL), which exist as droplets near the mitochondria of skeletal muscle cells, from extramyocellular lipids (EMCL), which exist in the stroma.9 Skeletal muscle 1H-MRS can detect the spectra of water and lipid peaks in skeletal muscle. Additionally, 1H-MRS might suppress the signal from water content, and it might successfully differentiate between IMCL and EMCL. Many studies have been conducted on IMCL because it is considered a key factor in clarifying the pathogenesis of lifestyle-related diseases, including diabetes mellitus (DM), and 1H-MRS might be used for quantitative and noninvasive measurement for these lipids. It has also been applied in the field of sports medicine. Interestingly, marathon runners have high IMCL content, and this is thought to enable the efficient use of lipids during exercise.4,10,11 Thus, 1H-MRS has recently been applied to several fields of scientific study.
We started to study in vivo metabolic fat assessments and muscle conditioning in sports athletes. Initially, we attempted to optimize the scanning parameters by referencing several past studies reporting adequate data acquisition for lipid metabolism in skeletal muscle. However, we were unable to differentiate between the lipid content peaks of IMCL and EMCL in some cases. We acquired data from all subjects by using the same scanning parameters. However, there have apparently been both successful and unsuccessful cases.
We hypothesize that the cause of this difference is related not only to the optimization of scanning parameters and the quality of the MR system, but it might also reflect different attributes among subjects that could affect successful data acquisition.
The purpose of this study was to clarify whether differences in the attributes of the subject groups affect the probability of successful data acquisition; namely, differences in age, health status, and the target muscle.
Materials and methods
Subjects and measurement method
The subjects included a total of 68 participants, including 22 participants with diabetes. Diabetes was type II for all the cases. The subjects without diabetes were divided into group A (19 individuals in their 20s; average age, 25.9±2.1 years; average body mass index [BMI], 22.95±2.21 kg/m2) and group B (27 individuals aged 30–60 years; average age, 41.58±7.38 years; average BMI, 23.95±2.74 kg/m2); subjects with diabetes formed group C (22 individuals aged 30–60 years; average age, 50.9±14 years; BMI, 26.91±5.24 kg/m2). For all subjects, 1H-MRS measurements were taken from muscles in the lower thigh (soleus muscle [SOL] and anterior tibial muscle [AT]). AT has a simple structure as it consists of linear combination of the muscle fibers. On the other hand, a structure of SOL is complicated, as the muscle fibers cross. Dependence on the muscle of the signal difference between IMCL and EMCL was considered to be evaluated by AT and SOL comparison. There was no difference in BMI among the three groups.
We used a 3-T MR device (Achieva; Philips Medical Systems, Best, the Netherlands) and a six-channel Torso coil. Data were acquired by using the point resolved spectroscopy (PRESS) sequence. The PRESS sequence parameters used in this study were as follows: a repetition time of 3,000 ms, an echo time of 40 ms, a bandwidth of 2,000 Hz, 1,024 sampling points, and 96 repetitions. The volume of interest (VOI) was single voxel of 15×15×30 mm size. The regional saturation technique distribution followed the shape of the measured region. Shimming was performed through automatic processing. The data obtained were analyzed with LCModel (LCMODEL Inc., Oakville, ON, Canada).12
Examinations of measurement success rates
Because our goal in this 1H-MRS analysis of skeletal muscle was to obtain information about IMCL and EMCL, the sharpness of the separation between the two peaks was graded and taken as an indicator of measurement success. In the analysis results, we regarded cases with an error of 0 and with a standard deviation of ≥20 as failures (0 points), and the remaining cases were regarded as successes (1 point). We compared the measurement success rate for the SOL and AT in groups A, B, and C, and examined the influence of differences between the skeletal muscles. We used Wilcoxon rank-sum test to check for statistically significant differences. Next, we examined the influence of age and the presence or absence of DM on the measurement success rate of the SOL in the three groups. The Steel–Dwass method was used to check for statistically significant differences.
Examinations based on the full width at half maximum of the water peak
For the SOL and AT measurements in all subjects, we measured the full width at half maximum (FWHM [Hz]) of the water peak, which is a shimming indicator, and Student’s t-test was used to check for statistically significant differences between the SOL and AT. The Steel–Dwass method was used for checking for statistically significant differences in the FWHM of the water peak depending on age and the presence or absence of DM.
This study was approved by the University of Tsukuba Hospital Ethics Committee (H21-414, University of Tsukuba), and all the procedures were performed after providing a thorough explanation of the purpose of the study to the subjects. In addition, we explained to the subjects that the results would be published, and obtained their written informed consent.
Results
Spectrum
Figure 1 shows one of the 1H-MRS spectra of AT. IMCL and EMCL were differentiated in all the cases of AT. Figure 2 shows one of the 1H-MRS spectra of SOL. IMCL, and EMCL were not differentiated in some cases of SOL.
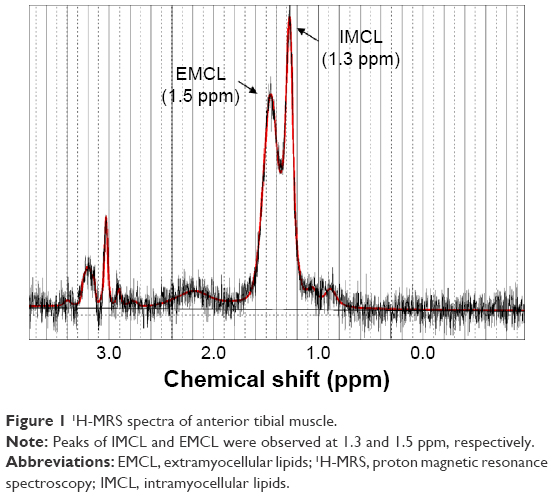 | Figure 1 1H-MRS spectra of anterior tibial muscle. |
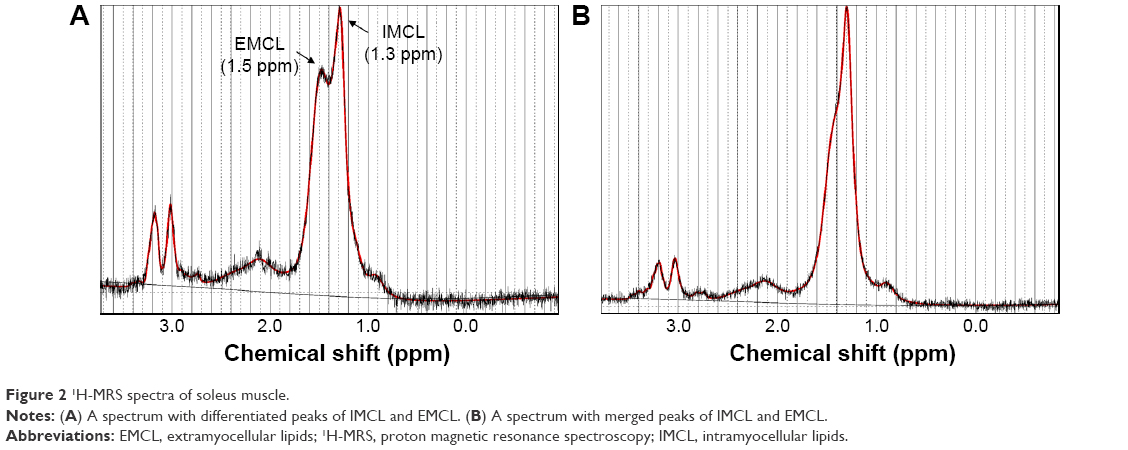 | Figure 2 1H-MRS spectra of soleus muscle. |
Measurement success rate
The results for the AT and SOL measurement success rates are shown in Table 1.
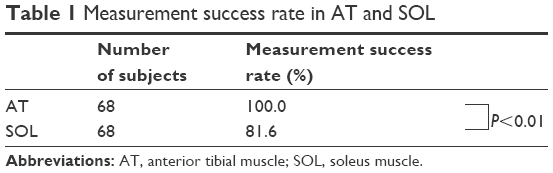 | Table 1 Measurement success rate in AT and SOL |
The success rate was significantly higher for the AT than for the SOL (P<0.01); the rates were 81.6% for the SOL and 100% for the AT. The measurement success rates according to age and the presence or absence of DM are shown in Table 2. Although the measurement success rate was 100% for group A, it was 85.2% for group B, and 77.3% for group C. The measurement success rate was significantly different (P<0.05) in the older groups. Specifically, there was a significant difference between groups A and B, as well as between groups A and C.
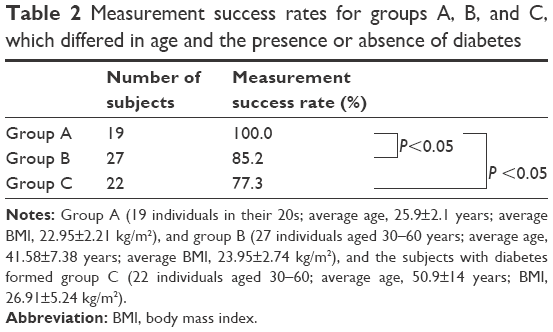 | Table 2 Measurement success rates for groups A, B, and C, which differed in age and the presence or absence of diabetes |
A significant difference (P<0.05) in the measurement success rate was found between groups A and C, where DM was a factor. The measurement success rate was found to be lower for group C than for group B, but when we considered only DM as a factor, there was no significant difference.
FWHM of the water peak
All subjects demonstrated a significant difference (P<0.01) in the FWHM of the water peak between the AT (FWHM: 12.54±1.38 Hz) and the SOL (FWHM: 14.72±1.54 Hz) (Table 3).
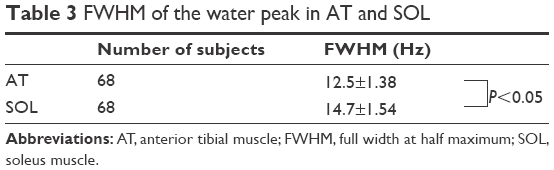 | Table 3 FWHM of the water peak in AT and SOL |
Discussion
Our results suggest that the success rate of AT measurement is apparently higher than that of the SOL in 1H-MRS, regardless of age and disease status (DM). We hypothesized that this difference is strongly related to anatomical differences.
Skeletal muscle is divided according to gross anatomy characteristics (eg, the pinnate muscle versus the fusiform muscle). The pennation angle is a key factor in this differentiation. The pennation angle is defined as the angle between the aponeurosis and the skeletal muscle fiber. The SOL has been shown to have a large and variable pennation angle in several ultrasonography and magnetic resonance imaging (MRI) studies.13–15 On the contrary, the AT has been shown to be almost straight in its craniocaudal pennation angle, which means that the AT has a lower pennation angle than the other calf muscles. Additionally, the pennation angle variation is very small. The AT has anatomic structural regularity, whereas the SOL presents structural irregularity.
In a VOI, the regularity of a structure (eg, the AT) allows less opportunity to measure the irregularly distributed stromal components such as the gross fatty or vascular components. On the contrary, the SOL has a higher potential for measurement of fatty or vascular components, with its mingled skeletal muscle fibers. These structural differences might result in differences in the success rate.
We have evidence to support our hypothesis. We measured shimming conditions in all subjects. The index of shimming conditions is the FWHM. When observing the FWHM, the water peak is significantly sharper in the AT than in the SOL. However, shimming comparisons between the young and old and between healthy and DM patients showed no significant differences. Therefore, anatomical differences apparently affected the shimming conditions. An increase in the FWHM of water induced a worse shimming condition, which could also be the cause of the spectrum baseline distortion and decrease in the accuracy in the spectrum divisions. This decrease in accuracy in the spectrum divisions might affect the division of the IMCL and EMCL, because the IMCL chemical shift is 1.3 ppm, whereas that of the EMCL is 1.5 ppm, which are very close.
There have been several studies that support our hypothesis. Studies of diffusion tensor tractography (DTT) showed apparent correlations between the pennation angle and DTT visualization. Concretely, the AT is very easy to be depicted by DTT, but the SOL is not. DTT is a method of tracking more highly anisotropic structures.15–18 Thus, the AT, which could have a regular structure at the macroscopic level, also showed excellent DTT, which represents phenomena at the microscopic level, and the SOL could produce the opposite. This means that differences in the microscopic anatomical structure, such as water molecule diffusion (eg, at the micrometer level), might also affect the MRI signal.
Factors of aging and DM also decrease the rate of successful data acquisition. These factors tend to induce sarcopenia. Additionally, the above factors are related to decreases in the metabolic rate. Previous papers suggest that healthy adults gain 0.454 kg of fat and lose 0.227 kg of muscle per year from their thirties to their sixties every year.19–21 This increase in fatty components might also be a cause of erroneous measurements.
Sarcopenia and increases in fat might also cause irregularities in muscle fiber direction. One report suggests that aging causes an elevation in fractional anisotropy.22 A decrease in fractional anisotropy represents a decrease in the anisotropy of water molecules in the skeletal muscle. Anisotropy also represents the irregularity of muscle fibers at the microscopic level. This also increases the excess components in the VOI in the measurements made by 1H-MRS, with decreases in the shimming level.
We hypothesize that the decrease in erroneous measurements were related to factors of aging, and DM might be induced for these reasons.
One limitation of this study is that the correlation between differences in the microscopic structure of skeletal muscles in the present subjects and the success or failure of 1H-MRS was not investigated. However, because this was a retrospective study, it was physically difficult to perform comparisons with the diffusion tensor imaging results.
Conclusion
The successfulness of the differentiation of IMCL and EMCL was evaluated in this study. It is shown that IMCL cannot be differentiated from EMCL not only by the factors on the equipment such as shimming and data acquisition parameters, but also the biological factors. The 1H-MRS measurement success rates of IMCL and EMCL in skeletal muscle are affected by age, the presence or absence of DM, and the anatomic structures of different skeletal muscle types.
Acknowledgment
Financial support for this study was provided by Grant-in-Aid for Scientific Research (C) (26350882) and Grant-in-Aid for Challenging Exploratory Research (25560364) from Japan Society for the Promotion of Science.
Disclosure
The authors report no conflicts of interest in this work.
References
Demaerel P, Johannik K, Van Hecke P, et al. Localized 1H NMR spectroscopy in fifty cases of newly diagnosed intracranial tumors. J Comput Assist Tomogr. 1991;15(1):67–76. | ||
Shimizu H, Kumabe T, Tominaga T, et al. Noninvasive evaluation of malignancy of brain tumors with proton MR spectroscopy. ANJR Am J Neuroradiol. 1996;17(4):737–747. | ||
Michaelis T, Merboldt KD, Bruhn H, Hänicke W, Frahm J. Absolute concentrations of metabolites in the adult human brain in vivo: quantification of localized proton MR spectra. Radiology. 1993;187(1):219–227. | ||
Schrauwen-Hinderling VB, Hesselink MK, Schrauwen P, Kooi ME. Intramyocellular lipid content in human skeletal muscle. Obesity (Silver Spring). 2006;14(3):357–367. | ||
Mäurer J, Konstanczak P, Söllner O, et al. Muscle metabolism of professional athletes using 31P-spectroscopy. Acta Radiol. 1999;40(1):73–77. | ||
Walker PM, Brunotte F, Rouhier-Marcer I, et al. Nuclear magnetic resonance evidence of different muscular adaptations after resistance training. Arch Phys Med Rehabil. 1998;79(11):1391–1398. | ||
van der Graaf M, de Haan JH, Smits P, Mulder AH, Heerschap A, Tack CJ. The effect of acute exercise on glycogen synthesis rate in obese subjects studied by 13C MRS. Eur J Appl Physiol. 2011;111(2):275–283. | ||
Rico-Sanz J, Zehnder M, Buchli R, Kühne G, Boutellier U. Creatine feeding does not enhance intramyocellular glycogen concentration during carbohydrate loading: an in vivo study by 31P- and 13C-MRS. J Physiol Biochem. 2008;64(3):189–196. | ||
Boesch C, Slotboom J, Hoppeler H, Kreis R. In vivo determination of intra-myocellular lipids in human muscle by means of localized 1H-MR-spectroscopy. Magn Reson Med. 1997;37(4):484–493. | ||
Krssak M, Falk Petersen K, Dresner A, et al. Intramyocellular lipid concentrations are correlated with insulin sensitivity in humans: a 1HNMR spectroscopy study. Diabetologia. 1999;42(3):113–116. | ||
Jacob S, Machann J, Rett K, et al. Association of increased intramyocellular lipid content with insulin resistance in lean nondiabetic offspring of type 2 diabetic subjects. Diabetes. 1999;48(5):1113–1119. | ||
Provencher SW. Automatic quantitation of localized in vivo 1H spectra with LCModel. NMR Biomed. 2001;14(4):260–264. | ||
Chow RS, Medri MK, Martin DC, Leekam RN, Agur AM, McKee NH. Sonographic studies of human soleus and gastrocnemius muscle architecture: gender variability. Eur J Appl Physiol. 2000;82(3):236–244. | ||
Morse CI, Thom JM, Birch KM, Narici MV. Changes in triceps surae muscle architecture with sarcopenia. Acta Physiol Scand. 2005;183(3):291–298. | ||
Okamoto Y, Okamoto T, Yuka K, Hirano Y, Isobe T, Minami M. The correlation between pennation angle and the image quality of skeletal muscle fibre tractography using the deterministic diffusion tensor imaging. J Med Imaging Radiat Oncol. 2012;56(6):622–627. | ||
Damon BM, Ding Z, Anderson AW, Freyer AS, Gore JC. Validation of diffusion tensor MRI-based muscle fiber tracking. Magn Reson Med. 2002;48(1):97–104. | ||
Okamoto Y, Kunimatsu A, Kono T, Kujiraoka Y, Sonobe J, Minami M. Gender differences in MR muscle tractography. Magn Reson Med Sci. 2010;9(3):111–118. | ||
Van Donkelaar CC, Kretzers LJ, Bovendeerd PH, et al. Diffusion tensor imaging in biomechanical studies of skeletal muscle function. J Anat. 1999;194(Pt 1):79–88. | ||
Baumgartner RN, Stauber PM, McHugh D, Koehler KM, Garry PJ. Cross-sectional age differences in body composition in persons 60+ years of age. J Gerontol A Biol Sci Med Sci. 1995;50(6):M307–M316. | ||
Forbes GB. Longitudinal changes in adult fat-free mass: influence of body weight. Am J Clin Nutr. 1999;70(6):1025–1031. | ||
Gallagher D, Visser M, De Meersman RE, et al. Appendicular skeletal muscle mass: effects of age, gender, and ethnicity. J Appl Physiol. 1997;83(1):229–239. | ||
Galbán CJ, Maderwald S, Stock F, Ladd ME. Age-related changes in skeletal muscle as detected by diffusion tensor magnetic resonance imaging. J Gerontol A Biol Sci Med Sci. 2007;62(4):453–458. |
 © 2016 The Author(s). This work is published and licensed by Dove Medical Press Limited. The
full terms of this license are available at https://www.dovepress.com/terms
and incorporate the Creative Commons Attribution
- Non Commercial (unported, 3.0) License.
By accessing the work you hereby accept the Terms. Non-commercial uses of the work are permitted
without any further permission from Dove Medical Press Limited, provided the work is properly
attributed. For permission for commercial use of this work, please see paragraphs 4.2 and 5 of our Terms.
© 2016 The Author(s). This work is published and licensed by Dove Medical Press Limited. The
full terms of this license are available at https://www.dovepress.com/terms
and incorporate the Creative Commons Attribution
- Non Commercial (unported, 3.0) License.
By accessing the work you hereby accept the Terms. Non-commercial uses of the work are permitted
without any further permission from Dove Medical Press Limited, provided the work is properly
attributed. For permission for commercial use of this work, please see paragraphs 4.2 and 5 of our Terms.