Back to Journals » Neuropsychiatric Disease and Treatment » Volume 12
Early visual processing for low spatial frequency fearful face is correlated with cortical volume in patients with schizophrenia
Authors Lee JS, Park G, Song MJ, Choi K, Lee S ![]()
Received 25 September 2015
Accepted for publication 25 November 2015
Published 22 December 2015 Volume 2016:12 Pages 1—14
DOI https://doi.org/10.2147/NDT.S97089
Checked for plagiarism Yes
Review by Single anonymous peer review
Peer reviewer comments 2
Editor who approved publication: Professor Wai Kwong Tang
Jung Suk Lee,1 Gewnhi Park,2 Myeong Ju Song,3 Kee-Hong Choi,4 Seung-Hwan Lee5,6
1Department of Psychiatry, National Health Insurance Service Ilsan Hospital, Goyang, Republic of Korea; 2Department of Psychology, Azusa Pacific University, Azusa, CA, USA; 3Department of Neuropsychiatry, Seoul National University Hospital, 4Department of Psychology, Korea University, Seoul, Republic of Korea; 5Clinical Emotion and Cognition Research Laboratory, Goyang, Republic of Korea; 6Department of Psychiatry, Inje University, Ilsan-Paik Hospital, Goyang, Republic of Korea
Abstract: Patients with schizophrenia present with dysfunction of the magnocellular pathway, which might impair their early visual processing. We explored the relationship between functional abnormality of early visual processing and brain volumetric changes in schizophrenia. Eighteen patients and 16 healthy controls underwent electroencephalographic recordings and high-resolution magnetic resonance imaging. During electroencephalographic recordings, participants passively viewed neutral or fearful faces with broad, high, or low spatial frequency characteristics. Voxel-based morphometry was performed to investigate brain volume correlates of visual processing deficits. Event related potential analysis suggested that patients with schizophrenia had relatively impaired P100 processing of low spatial frequency fearful face stimuli compared with healthy controls; patients’ gray-matter volumes in the dorsolateral and medial prefrontal cortices positively correlated with this amplitude. In addition, patients’ gray-matter volume in the right cuneus positively correlated with the P100 amplitude in the left hemisphere for the high spatial frequency neutral face condition and that in the left dorsolateral prefrontal cortex negatively correlated with the negative score of the Positive and Negative Syndrome Scale. No significant correlations were observed in healthy controls. This study suggests that the cuneus and prefrontal cortex are significantly involved with the early visual processing of magnocellular input in patients with schizophrenia.
Keywords: event-related potential, visual processing, magnocellular, voxel-based morphometry, schizophrenia
Introduction
Patients with schizophrenia have severe deficits not only in top-down but also in bottom-up processing including early visual processing.1–3 The visual system can be divided into the magnocellular and parvocellular pathways. The magnocellular pathway responds rapidly and is biased toward responding to low spatial frequency (LSF) information, while the parvocellular pathway responds more slowly and is biased toward responding to high spatial frequency (HSF) information.4 However, there is no complete segregation of visual pathway function according to these stimuli properties. Previous studies have reported magnocellular dysfunction, with some deficits in parvocellular functions, in patients with schizophrenia.5 Visual processing deficits in schizophrenia may contribute to dysregulation of higher cortical function and functional outcomes.6 In addition, patients with schizophrenia show abnormal emotional processing for fearful facial stimuli,7–10 which might be largely dependent on the fast-processing (ie, LSF-dependent) pathway, compared to happy facial stimuli,11 suggesting that abnormalities in emotional processing of fearful faces might be due to deficits in early visual processing in schizophrenia.
Event related potentials (ERP) of facial stimuli have been extensively studied, and are an excellent tool to examine early-stage visual processing and spatial-frequency-dependent pathology in patients with schizophrenia. ERP components such as P100, N170, N250, and P300 have been evaluated in paradigms using facial stimuli in patients with schizophrenia,7,8,12 and abnormalities in these ERP components have been repeatedly reported.7,13 In addition, many studies revealed that patients with schizophrenia showed major abnormalities in the ERP components to the LSF relative to HSF stimuli.14–17 The P100 reflects the successful categorization of stimuli as well as luminance and contrast.3 The N170 is a human-face-specific ERP component.18,19 The N250 is sensitive to the emotional content of a face, and to familiar faces.20 The P300 reflects the affect encoding stage in the processing of emotions.21
In addition, previous voxel-based morphometry (VBM) studies found that deficits in brain volume in patients with schizophrenia are widespread throughout the brain, particularly in the frontal and temporal regions.22 With respect to regions of visual processing, gray-matter (GM) volumes of the primary visual cortex and visual association areas were decreased in patients with schizophrenia compared to healthy controls.23,24 Although there is independent evidence indicating both ERP and brain volume abnormalities in patients with schizophrenia, few studies have tested the relation between these factors to date.5,25–27
When studying visual processing of facial affect, several brain structures are of particular interest. First, the cuneus contains both magnocellular and parvocellular pathways, and processes basic visual information.11 Second, the fusiform gyrus is involved in visual object processing and recognition,28 and receives inputs from both the magnocellular and parvocellular visual pathways.29 Moreover, the fusiform face area, which is specialized for the perception of faces, is located within the fusiform gyrus.30 Third, the prefrontal cortex is known to be involved in top-down facilitation of object recognition during visual processing.31,32 Among the prefrontal regions, the medial and dorsolateral prefrontal cortex (DLPFC) were found to be preferentially activated during processing of LSF stimuli in a recent functional magnetic resonance imaging (fMRI) study.33 The GM volume of these structures in patients with schizophrenia has been reported to be decreased compared to healthy controls.24,34–36
We hypothesized that early visual processing of LSF fearful facial stimuli would be impaired in patients with schizophrenia and that these impairments would be reflected in various ERP components. In addition, we predicted that abnormalities in ERP amplitudes in response to LSF fearful faces would relate to volume reductions in brain regions implicated in visual processing. To test these hypotheses, we used VBM to estimate GM volumes in predefined brain regions, including the cuneus, fusiform gyrus, and dorsolateral and medial prefrontal cortices, and then correlated the brain volumes with ERP amplitudes for LSF facial affective stimuli.
Methods
Subjects
Eighteen patients with schizophrenia (nine males) and 16 healthy controls (eight males) participated in this study. The schizophrenia patients were recruited from the Psychiatry Department of Inje University Ilsan Paik Hospital, South Korea. All patients met the criteria for schizophrenia based on the Structured Clinical Interview for DSM-IV (Diagnostic and Statistical Manual of Mental Disorders, Fourth Edition) Axis I Disorders.37 The exclusion criteria were any other Axis I disorder except schizophrenia, central nervous system disease (eg, epilepsy or cerebrovascular accident), alcohol or drug abuse, having undergone electroconvulsive therapy, mental retardation, head injury with loss of consciousness, or a history of arrest for violent behavior. Normal controls were recruited through posters displayed in the hospital and advertisements in local newspapers. An initial screening interview excluded subjects if they had any identifiable neurological disorder or head injury, a first-degree relative with schizophrenia, any personal history of psychiatric disease, a family history of psychiatric illness, or a history of arrest for violent behavior. After initial screening, potential normal control subjects were interviewed with the Structured Clinical Interview for DSM-IV Axis II Disorders,38 and were excluded if they had any of these disorders. The patient and control groups showed no significant difference in sex and age and the mean years of education.
All patients were taking atypical antipsychotic medication, the dosages of which were unchanged for at least 2 weeks before starting the tests. They did not take any mood stabilizers or typical antipsychotics combined. Clinical symptoms were rated by a skilled psychiatrist using the Positive and Negative Syndrome Scale (PANSS).39 Demographic data and symptom rating are presented in Table 1.
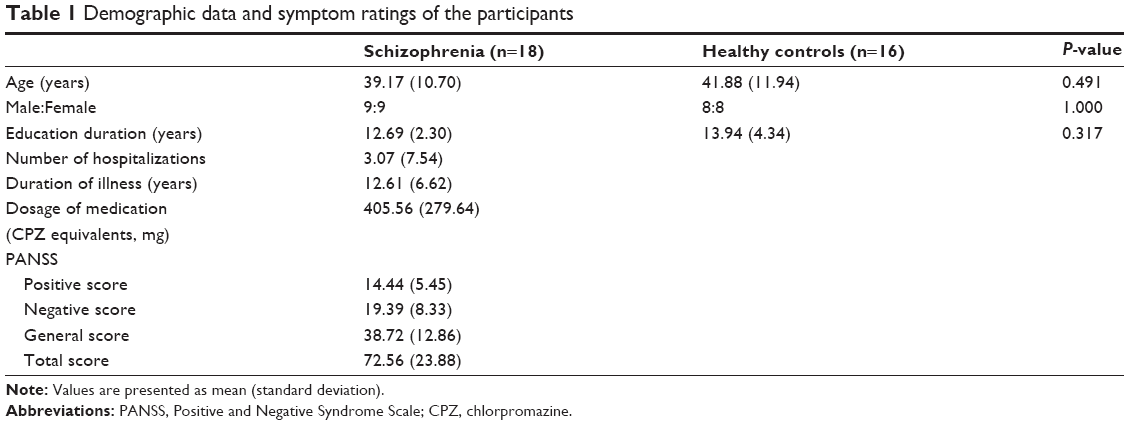 | Table 1 Demographic data and symptom ratings of the participants |
All subjects had normal or corrected-to-normal vision and were right-handed, as determined by asking about the hand used for writing and other precise motor skills. All subjects provided written informed consent to participate; this study and informed consent form were approved by the Institutional Review Board of Inje University Ilsan Paik Hospital.
Procedures
We selected 104 faces (52 with fearful and 52 with neutral facial expressions; 26 females and 26 males with each expression) from the Korea University Facial Expression Collection.40 All faces were converted to gray-scale images. Contrast and brightness were adjusted to maintain consistency across the different faces. In order to produce the HSF and LSF stimuli, the original broad spatial frequency (BSF) pictures were filtered through a high-pass cut off of >24 cycles/image (>4.66 cycles/visual angle) for the HSF stimuli and a low-pass cut off of <8 cycles/image (<1.55 cycles/visual angle) for the LSF stimuli. The average gray-scale values for the BSF, HSF, and LSF fearful face stimuli were 130, 125, and 124, respectively; the average gray-scale values for the BSF, HSF, and LSF neutral face stimuli were 128, 126, and 128, respectively (256 gray-level scale). These average gray-scale values did not differ significantly between spatial frequencies (F[2,309]=3.15, P=0.55), or emotional expression (F[1,310]=1.96, P=0.17). Each stimulus measured 5.14° horizontally and 5.14° vertically and was presented on a light gray background at a viewing distance of 100 cm on a 19-inch cathode ray tube monitor with a resolution of 1,024 by 768 pixels.
Stimuli were presented in three separate blocks of different spatial frequencies (BSF, HSF, and LSF). In each block, participants were presented with 12 practice trials, followed by 300 experimental trials of fearful and neutral face stimuli presented in random order. After each block, participants were allowed a short break. Therefore, each face was randomly presented three times at different SF ranges. Each trial began with a fixation point for 200 ms, followed by a blank screen for 500 ms. The display with the face picture was presented for 500 ms with an inter-stimulus interval that varied randomly between 950 and 1,050 ms. Participants were told that their task was to detect a chair picture (16.7%) interspersed among the face pictures (83.3%) by pressing the “1” key with their dominant hand.
Electroencephalography (EEG) recording and analysis
Stimulus presentation and data synchronization with EEG were accomplished using E-Prime (Psychology Software Tools, Pittsburgh, PA, USA). The EEG was synchronized to the onset of face stimulus presentation. EEG activity was recorded and amplified using a Neuroscan Synamps amplifier (Compumedics USA, El Paso, TX, USA) with 64 Ag–AgCl electrodes mounted in a Quick Cap using an extended 10–20 electrode system. The vertical electrooculogram (EOG) was recorded using two electrodes, one located above and one below the right eye. The horizontal EOG was recorded at the outer canthi of each eye. EEG data were recorded with a 0.1–100 Hz band-pass filter and a 1,000 Hz sampling rate. The ground electrode was placed on the forehead and the reference was located at electrode Cz.
EEG data were initially processed using Scan 4.3 and re-referenced offline to an average reference. Eye blinks were removed from the data using preinstalled software of Scan 4.3 which subtracted the average EOG response from the EEG channels.41 Trials were rejected if they included significant physiological artifacts (amplitude exceeding ±70 μV) at all 64 electrode sites. After artifact removal, baseline correction was conducted by subtracting the mean of 200 ms of pre-stimulus data from the post-stimulus data for each trial. Data were band-pass filtered at 1–30 Hz and then epoched to 200 ms pre-stimulus and 900 ms post-stimulus. The four ERP components were identified as follows: P100, the largest positive peak at O1 and O2 in the post-stimulus window from 50 to 150 ms; N170, the largest negative peak at P7/PO7 and P8/PO8 from 120 to 220 ms; N250, the largest negative peak at F1/FC1/FC3 and F2/FC2/FC4 from 150 to 350 ms; and P300, the largest positive peak at F1/FC1 and F2/FC2 from 300 to 450 ms. The ranges of largest peaks were determined according to our previous work,7 where the maximum electrical potentials were detected via a visual inspection of the topographic map.
ERP data were averaged for each participant separately for neutral and fearful facial expressions. The numbers of epoch were as follows (mean [standard deviation]): BSF fearful 41.83 (9.46), BSF neutral 42.33 (10.02), HSF fearful 41.05 (11.20), HSF neutral 41.55 (10.55), LSF fearful 42.55 (9.36), and LSF neutral 42.27 (11.22) in schizophrenia patients, and BSF fearful 45.68 (4.48), BSF neutral 45.18 (6.89), HSF fearful 45.00 (5.65), HSF neutral 44.56 (5.56), LSF fearful 43.75 (6.97), and LSF neutral 44.12 (7.41) in healthy controls. The number of epochs used for analysis did not differ statistically for SF (F[2,64]=0.470, P=0.627) or emotion (F[1,32]=0.008, P=0.931).
MRI acquisition and VBM
MRI was performed using a 1.5 T scanner (Magneton Avanto, Siemens, Erlangen, Germany). Head motion was minimized with restraining foam pads provided by the manufacturer. A high-resolution T1-weighted MRI volume data set was acquired with the acquisition parameters of a 384×227 acquisition matrix, a 177×250 field-of-view, a TE of 3.42 ms, a TR of 1,900 ms, 1.2 mm slice thickness, and a flip angle of 15°.
All images were inspected visually for motion or other artifacts before and after preprocessing. VBM analysis was conducted by VBM8 toolbox (http://dbm.neuro.uni-jena.de/vbm) implemented in SPM8 (Wellcome Department of Cognitive Neurology, London, UK). T1-weighted images were segmented into GM, white matter, and cerebrospinal fluid compartments using partial volume estimation and de-noising with a non-local means filter. Images were subsequently normalized using linear and non-linear transformations. Segmented images were modulated or scaled by the amount of warping to maintain the total amount of GM volume, modifying the signal intensity of a voxel to represent relative volume of a brain region. Modulated GM images were then smoothed with an 8 mm isotropic Gaussian kernel and were selected for further statistical analyses.
Statistical analysis
The amplitude of each ERP component was compared using repeated measures analysis of variance, with within subject factors of laterality (left and right), frequency (BSF, HSF, and LSF), and emotion (neutral and fear) and group (patients with schizophrenia and healthy controls) as the between subjects factor. Green-Geisser correction was used to correct for non-sphericity. For any significant effect, we performed a post hoc analysis adjusting the P-values using Bonferroni correction for multiple comparisons.
Correlations between GM volumes and amplitude of ERP components were assessed using SPM8. The dosage of antipsychotics was referred to as a nuisance variable in order to control for the potential effect of medication. A region of interest (ROI) analysis was then performed in the predefined brain regions. These ROIs included the bilateral cuneus, bilateral fusiform gyrus, left medial prefrontal cortex (MPFC), and left DLPFC. The cuneus and fusiform gyrus ROIs were defined using the Anatomical Automatic Labeling templates of the Wake Forest University PickAtlas.42 The left and right parts of the cuneus and fusiform gyrus ROIs were defined separately. The left MPFC and left DLPFC ROIs were 10 mm radius spherical ROIs centered on a coordinate reported in a previous neuroimaging study.33 The statistical threshold was set at a family-wise-error-corrected P<0.05.
In addition, the regional GM volumes for the entire clusters of significant results from the ROI analysis were calculated using individual GM volume maps in patients with schizophrenia. To further elucidate the clinical significance of the findings, we calculated Pearson’s correlations between regional GM volumes and PANSS positive and negative scores. Because the correlational analyses focused on only a few planned comparisons,43 no adjustments were made for multiple comparisons in order to avoid possible type II error.
Results
ERP analysis
Amplitudes of each ERP component are presented in Table 2. The P100 amplitude showed a significant interaction of SF × emotion × group (F[2,31]=7.027, P=0.002). Post hoc analysis revealed significant amplitude differences between LSF and HSF when neutral face stimuli were presented to patients with schizophrenia (LSF vs HSF =4.38[0.65] μV vs 2.80[0.67] μV, P=0.004), and fearful face stimuli were presented to healthy controls (LSF vs HSF =4.80[0.74] μV vs 3.15[0.54] μV, P=0.003). The P100 waves are presented in Figure 1.
 | Table 2 Mean amplitude of P100, N170, N250, and P300 and the standard error of each spatial frequency and emotion (fear and neutral) |
 | Figure 1 Averaged P100 waves at O1 and O2 electrodes in patients with schizophrenia and healthy controls. The arrows indicate ERP waves showing significant differences between schizophrenia patients and healthy controls. |
The N170 amplitude showed a significant interaction of laterality × SF × group (F[2,31]=4.393, P=0.016). However, post hoc analysis revealed no significant between-group differences. N250 did not show any significant group related effect in amplitude. The P300 amplitude showed a significant interaction of laterality × group (F[1,32]=5.004, P=0.032). Post hoc analysis revealed a significant difference in laterality in healthy controls (left vs right =0.40[0.52] μV vs 0.83[0.55] μV, P=0.035). The 170, N250, and P300 waves were presented in Figures S1–S3, respectively.
VBM
There were no significant group differences of GM volume in predefined brain regions. As shown in Table 3, the ROI analysis showed that in patients with schizophrenia, GM volume in the right cuneus was positively correlated with the P100 amplitude in the left hemisphere for the HSF neutral face condition. In addition, GM volume in the left DLPFC was positively correlated with the P100 amplitude in the left hemisphere for the LSF fearful face condition and that in the left DLPFC and MPFC were also positively correlated with the P100 amplitude in the right hemisphere for the LSF fearful face condition. In healthy controls, none of the selected brain regions showed significant correlations with ERP amplitudes.
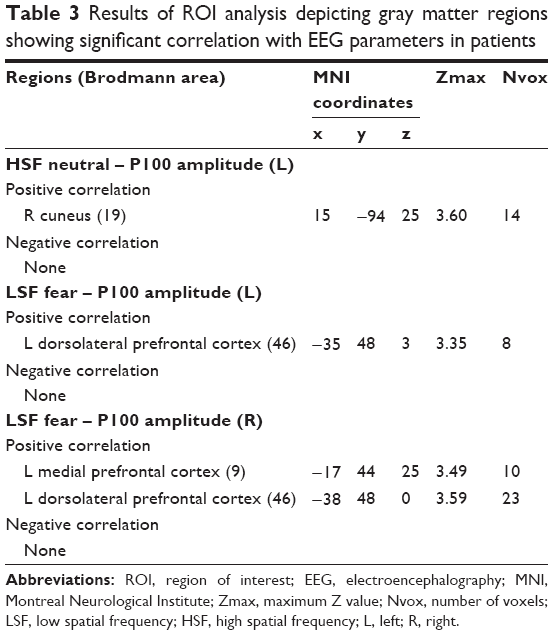 | Table 3 Results of ROI analysis depicting gray matter regions showing significant correlation with EEG parameters in patients |
Among the significant clusters from the ROI analysis, the GM volume in the left DLPFC, which showed a positive correlation with the P100 amplitude in the left hemisphere for the LSF fearful face, was negatively correlated with the PANSS negative score (r=−0.51, P=0.03) in patients with schizophrenia (Figure 2). GM volumes in other clusters did not show any significant correlations with the PANSS. The illness duration may have influenced the results of this study;44,45 however, it was not significantly correlated to GM volume or EEG parameter in this study. So, it was not treated as nuisance factors.
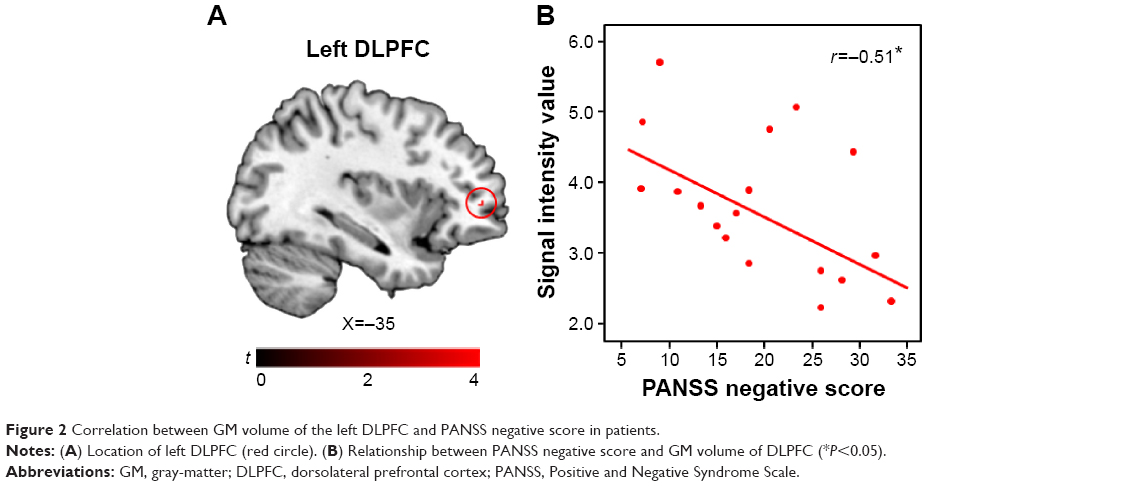 | Figure 2 Correlation between GM volume of the left DLPFC and PANSS negative score in patients. |
Discussion
In this study, we examined the correlation between ERP amplitudes and cortical GM volume in patients with schizophrenia when presented with SF-dependent facial emotional stimuli. Our study revealed the P100 amplitude, in response to LSF fearful faces, in both the left and right hemispheres, correlated with prefrontal GM volume in patients with schizophrenia. Specifically, in the left hemisphere, P100 amplitude was correlated with the left DLPFC, and in the right, with the left DLFPC and left MPFC.
The current study confirmed that GM volumes of visual-processing-related regions were correlated with P100 amplitude for LSF fearful faces, while they were not correlated with other ERP components. Previous ERP studies found deficits in both early and late ERP components in patients with schizophrenia, such as P100,13 N170,7 N250,46 and P300,47 and our results support these findings by suggesting that structural deficits in the visual processing regions may be related to early-stage visual processing problems in patients with schizophrenia.
The correlation between P100 amplitude for LSF fearful faces and GM volumes of DLPFC and MPFC partly supports the idea that LSF information of visual stimuli is represented preferentially in the prefrontal cortex.48,49 This is in line with a previous fMRI study33 that suggested that the DLPFC and MPFC might be critical regions for visual processing of LSF information. The prefrontal cortex has been known to be involved in top-down control processing, but this finding suggests that the prefrontal cortex may also be involved in bottom-up processing (ie, early visual processing). Pathological alterations in the circuitry of the DLPFC are thought to play an important role in cognitive impairment,31 which is considered to be a core and disabling feature of schizophrenia. Decreased volume of the DLPFC has been found to be related to cognitive deficits50 and functional outcome51 in schizophrenia. Our result indicates that DLPFC volume deficits might also be involved in abnormalities of early visual processing in the magnocellular pathway. In addition, we found that GM volume in the DLPFC was negatively correlated with the PANSS negative score in patients with schizophrenia. This finding supports previous studies, which demonstrated that deficient visual processing is associated with more severe negative symptoms in schizophrenia.6 The MPFC is involved not only in cognitive functions such as action monitoring and attention, but also in social cognition including mentalizing, theory of mind, and social perception.52,53 Reduced GM volume in the MPFC in patients with schizophrenia has been related to diminished cognitive function such as attention and abstraction54 and impaired social cognition such as theory of mind.55 In addition, Chaumon et al49 showed that only LSF information that could match preexisting memory increased activity in the medial orbitofrontal cortex, known for its function in affective responses. Our findings suggest that the MPFC is important for early visual processing as well as social cognition. Since previous studies demonstrated that early visual processing is related to social perception in patients with schizophrenia,56,57 the MPFC may be a common neural correlate for early visual processing and social perception.
GM volume of the cuneus (BA 17) was correlated with P100 amplitude for HSF neutral faces in patients with schizophrenia. The cuneus is known for its involvement in basic visual processing and receives visual information from the contralateral superior retina, which is then projected to extrastriate cortices (BA 18, 19).58 Since the P100 is known to have a neural generator within extrastriate cortices,59 the strong connections between the cuneus and extrastriate cortex could explain the involvement of the cuneus in P100 amplitude. The finding that decreased GM volume in the cuneus was related to the P100 amplitude for HSF but not for LSF or BSF faces suggests that the cuneus is responsible for the early visual processing deficit for HSF stimuli in patients with schizophrenia. However, this finding disagrees with a previous fMRI study which demonstrated that patients showed decreased activation to LSF but not to HSF stimuli in multiple regions of the occipital lobe.16 Thus, further studies are needed to clarify the relationship between the cuneus and early visual processing deficits in patients with schizophrenia.
Contrary to our expectations, GM volume in the fusiform gyrus did not show any correlation with ERP amplitudes. A previous study found that right posterior fusiform gyrus volume correlated with the N170 amplitude at the right posterior temporal electrode in response to faces in patients with schizophrenia.19 The biggest difference between that study and ours is that we did not use the N170 amplitude at the right posterior temporal site, but averaged N170 amplitudes in each hemisphere for statistical analyses. In addition, although not clarified in the previous study, patients’ demographic and clinical characteristics, such as age and duration of illness, could explain the absence of findings in the fusiform gyrus.
Our results showed no significant correlation between brain area and ERP amplitude in healthy controls, suggesting that brain volume is not a major factor influencing information processing in healthy individuals. However, the subtle reduction of brain volume in patients with schizophrenia is well known.60,61 Although no correlation between brain volume and ERP amplitude (brain functioning) was observed in healthy controls, our results suggest that the brain function of patients with schizophrenia is influenced by the reduction of brain volume.
Our study has some limitations. First, all the patients in this study were taking antipsychotic medication. Previous meta-analyses of longitudinal studies found that decrease in GM volume was related to higher cumulative antipsychotic intake in patients with schizophrenia.62,63 Although doses of antipsychotics were controlled in our analyses, the duration of antipsychotic treatment was not included in the statistical analyses. Therefore, future studies should include the duration of antipsychotic treatment as well as drug-naïve patients.64 Second, the small sample size in the current study limits the ability to generalize our findings.
In conclusion, the present study suggests that the cuneus and prefrontal cortex may be the neural basis for the early visual processing impairment of magnocellular input in patients with schizophrenia. Additionally, our findings support prior studies showing the relationship between deficient visual processing and negative symptoms in patients with schizophrenia, further highlighting the importance of visual processing deficits for understanding the pathophysiology of schizophrenia.
Acknowledgments
This work was supported by a grant from the Korea Science and Engineering Foundation (KOSEF), funded by the Korean government (NRF-2015R1A2A2A01003564). The authors thank JC who supported all procedures in this study.
Author contributions
Seung-Hwan Lee designed the study and wrote the protocol. Myeong Ju Song and Kee-Hong Choi managed the literature searches, and undertook the statistical analysis. Jung Suk Lee wrote the first draft of the manuscript. All authors contributed to and have approved the final paper. All authors contributed toward data analysis, drafting and critically revising the paper and agree to be accountable for all aspects of the work.
Disclosure
The authors have no conflicts of interest to disclose in this work.
References
Butler PD, Schechter I, Zemon V, et al. Dysfunction of early-stage visual processing in schizophrenia. Am J Psychiatry. 2001;158(7):1126–1133. | ||
Kim D, Zemon V, Saperstein A, Butler PD, Javitt DC. Dysfunction of early-stage visual processing in schizophrenia: harmonic analysis. Schizophr Res. 2005;76(1):55–65. | ||
Campanella S, Montedoro C, Streel E, Verbanck P, Rosier V. Early visual components (P100, N170) are disrupted in chronic schizophrenic patients: an event-related potentials study. Neurophysiol Clin. 2006;36(2):71–78. | ||
Merigan WH, Maunsell JH. How parallel are the primate visual pathways? Annu Rev Neurosci. 1993;16:369–402. | ||
Butler PD, Javitt DC. Early-stage visual processing deficits in schizophrenia. Curr Opin Psychiatry. 2005;18(2):151–157. | ||
Green MF, Lee J, Wynn JK, Mathis KI. Visual masking in schizophrenia: overview and theoretical implications. Schizophr Bull. 2011;37(4):700–708. | ||
Lee SH, Kim EY, Kim S, Bae SM. Event-related potential patterns and gender effects underlying facial affect processing in schizophrenia patients. Neurosci Res. 2010;67(2):172–180. | ||
Jung HT, Kim DW, Kim S, Im CH, Lee SH. Reduced source activity of event-related potentials for affective facial pictures in schizophrenia patients. Schizophr Res. 2012;136(1–3):150–159. | ||
Morris RW, Weickert CS, Loughland CM. Emotional face processing in schizophrenia. Curr Opin Psychiatry. 2009;22(2):140–146. | ||
Bediou B, Krolak-Salmon P, Saoud M, et al. Facial expression and sex recognition in schizophrenia and depression. Can J Psychiatry. 2005; 50(9):525–533. | ||
Holmes A, Winston JS, Eimer M. The role of spatial frequency information for ERP components sensitive to faces and emotional facial expression. Brain Res Cogn Brain Res. 2005;25(2):508–520. | ||
McCleery A, Lee J, Joshi A, Wynn JK, Hellemann GS, Green MF. Meta-analysis of face processing event-related potentials in schizophrenia. Biol Psychiatry. 2015;77(2):116–126. | ||
Wölwer W, Brinkmeyer J, Stroth S, et al. Neurophysiological correlates of impaired facial affect recognition in individuals at risk for schizophrenia. Schizophr Bull. 2012;38(5):1021–1029. | ||
Butler PD, Martinez A, Foxe JJ, et al. Subcortical visual dysfunction in schizophrenia drives secondary cortical impairments. Brain. 2007; 130(Pt 2):417–430. | ||
Friedman T, Sehatpour P, Dias E, Perrin M, Javitt DC. Differential relationships of mismatch negativity and visual p1 deficits to premorbid characteristics and functional outcome in schizophrenia. Biol Psychiatry. 2012;71(6):521–529. | ||
Martinez A, Hillyard SA, Bickel S, Dias EC, Butler PD, Javitt DC. Consequences of magnocellular dysfunction on processing attended information in schizophrenia. Cerebral cortex. 2012;22(6):1282–1293. | ||
Kim DW, Shim M, Song MJ, Im CH, Lee SH. Early visual processing deficits in patients with schizophrenia during spatial frequency-dependent facial affect processing. Schizophr Res. 2015;161(2–3):314–321. | ||
Herrmann MJ, Ellgring H, Fallgatter AJ. Early-stage face processing dysfunction in patients with schizophrenia. Am J Psychiatry. 2004;161(5):915–917. | ||
Onitsuka T, Niznikiewicz MA, Spencer KM, et al. Functional and structural deficits in brain regions subserving face perception in schizophrenia. Am J Psychiatry. 2006;163(3):455–462. | ||
Tanaka JW, Curran T, Porterfield AL, Collins D. Activation of preexisting and acquired face representations: the N250 event-related potential as an index of face familiarity. J Cogn Neurosci. 2006;18(9):1488–1497. | ||
Johnston VS, Miller DR, Burleson MH. Multiple P3s to emotional stimuli and their theoretical significance. Psychophysiology. 1986;23(6):684–694. | ||
Honea R, Crow TJ, Passingham D, Mackay CE. Regional deficits in brain volume in schizophrenia: a meta-analysis of voxel-based morphometry studies. Am J Psychiatry. 2005;162(12):2233–2245. | ||
Onitsuka T, McCarley RW, Kuroki N, et al. Occipital lobe gray matter volume in male patients with chronic schizophrenia: A quantitative MRI study. Schizophr Res. 2007;92(1):197–206. | ||
Ananth H, Popescu I, Critchley HD, Good CD, Frackowiak RS, Dolan RJ. Cortical and subcortical gray matter abnormalities in schizophrenia determined through structural magnetic resonance imaging with optimized volumetric voxel-based morphometry. Am J Psychiatry. 2002;159(9):1497–1505. | ||
McCarley RW, Nakamura M, Shenton ME, Salisbury DF. Combining ERP and structural MRI information in first episode schizophrenia and bipolar disorder. Clin EEG Neurosci. 2008;39(2):57–60. | ||
Meisenzahl EM, Koutsouleris N, Bottlender R, et al. Structural brain alterations at different stages of schizophrenia: a voxel-based morphometric study. Schizophr Res. 2008;104(1–3):44–60. | ||
O’Donnell BF, Shenton ME, McCarley RW, et al. The auditory N2 component in schizophrenia: relationship to MRI temporal lobe gray matter and to other ERP abnormalities. Biol Psychiatry. 1993;34(1–2):26–40. | ||
Vogels R, Biederman I, Bar M, Lorincz A. Inferior temporal neurons show greater sensitivity to nonaccidental than to metric shape differences. J Cogn Neurosci. 2001;13(4):444–453. | ||
Kaplan E, Shapley RM. The primate retina contains two types of ganglion cells, with high and low contrast sensitivity. Proc Natl Acad Sci U S A. 1986;83(8):2755–2757. | ||
Kanwisher N, Yovel G. The fusiform face area: a cortical region specialized for the perception of faces. Philos Trans R Soc Lond B Biol Sci. 2006;361(1476):2109–2128. | ||
Barch DM, Ceaser A. Cognition in schizophrenia: core psychological and neural mechanisms. Trends Cogn Sci. 2012;16(1):27–34. | ||
Kveraga K, Boshyan J, Bar M. Magnocellular projections as the trigger of top-down facilitation in recognition. J Neurosci. 2007;27(48):13232–13240. | ||
Calderone DJ, Hoptman MJ, Martínez A, et al. Contributions of low and high spatial frequency processing to impaired object recognition circuitry in schizophrenia. Cerebral Cortex. 2013;23(8):1849–1858. | ||
Hulshoff Pol HE, Schnack HG, Mandl RC, et al. Focal gray matter density changes in schizophrenia. Arch Gen Psychiatry. 2001;58(12):1118–1125. | ||
Salgado-Pineda P, Junque C, Vendrell P, et al. Decreased cerebral activation during CPT performance: structural and functional deficits in schizophrenic patients. Neuroimage. 2004;21(3):840–847. | ||
Molina V, Galindo G, Cortes B, et al. Different gray matter patterns in chronic schizophrenia and chronic bipolar disorder patients identified using voxel-based morphometry. Eur Arch Psychiatry Clin Neurosci. 2011;261(5):313–322. | ||
First MB, Gibbon M, Spitzer RL, Williams JB. Structured Clinical Interview for DSM-IV Axis I Disorders. New York: New York State Psychiatric Institute Biometric Research; 1996. | ||
First MB, Gibbon M, Spitzer RL, Williams JB. Structure Clinical Interview for DSM-IV Axis II Personality Disorders. New York: New York State Psychiatric Institute Biometric Research; 1996. | ||
Kay SR, Fiszbein A, Opler LA. The positive and negative syndrome scale (PANSS) for schizophrenia. Schizophr Bull. 1987;13(2):261–276. | ||
Lee T, Lee K, Lee K, Choi J, Kim H. The Korea University facial expression collection: KUFEC. Lab. Seoul, Korea: Lab. of Behavioral Neuroscience, Dept. of Psychology. 2006. Available from: http://www.academia.edu/5829384/Korea_University_Facial_Expression_Collection_KUFEC | ||
Semlitsch HV, Anderer P, Schuster P, Presslich O. A solution for reliable and valid reduction of ocular artifacts, applied to the P300 ERP. Psychophysiology. 1986;23(6):695–703. | ||
Maldjian JA, Laurienti PJ, Kraft RA, Burdette JH. An automated method for neuroanatomic and cytoarchitectonic atlas-based interrogation of fMRI data sets. Neuroimage. 2003;19(3):1233–1239. | ||
Rothman KJ. No adjustments are needed for multiple comparisons. Epidemiology. 1990;1(1):43–46. | ||
Burke L, Androutsos C, Jogia J, Byrne P, Frangou S. The Maudsley Early Onset Schizophrenia Study: the effect of age of onset and illness duration on fronto-parietal gray matter. Eur Psychiatry. 2008;23(4):233–236. | ||
Di Lorenzo G, Daverio A, Ferrentino F, et al. Altered resting-state EEG source functional connectivity in schizophrenia: the effect of illness duration. Front Hum Neurosci. 2015;9:234. | ||
Wynn JK, Lee J, Horan WP, Green MF. Using event related potentials to explore stages of facial affect recognition deficits in schizophrenia. Schizophrenia Bull. 2008;34(4):679–687. | ||
Turetsky BI, Kohler CG, Indersmitten T, Bhati MT, Charbonnier D, Gur RC. Facial emotion recognition in schizophrenia: when and why does it go awry? Schizophr Res. 2007;94(1):253–263. | ||
Sehatpour P, Dias EC, Butler PD, et al. Impaired visual object processing across an occipital-frontal-hippocampal brain network in schizophrenia: an integrated neuroimaging study. Arch Gen Psychiatry. 2010;67(8):772–782. | ||
Chaumon M, Kveraga K, Barrett LF, Bar M. Visual predictions in the orbitofrontal cortex rely on associative content. Cereb Cortex. 2014;24(11):2899–2907. | ||
Minatogawa-Chang TM, Schaufelberger MS, Ayres AM, et al. Cognitive performance is related to cortical grey matter volumes in early stages of schizophrenia: a population-based study of first-episode psychosis. Schizophr Res. 2009;113(2):200–209. | ||
Prasad KM, Sahni SD, Rohm BR, Keshavan MS. Dorsolateral prefrontal cortex morphology and short-term outcome in first-episode schizophrenia. Psychiatry Res. 2005;140(2):147–155. | ||
Amodio DM, Frith CD. Meeting of minds: the medial frontal cortex and social cognition. Nat Rev Neurosci. 2006;7(4):268–277. | ||
Frith CD. The social brain? Philos Trans R Soc Lond B Biol Sci. 2007;362(1480):671–678. | ||
Gur RE, Cowell PE, Latshaw A, et al. Reduced dorsal and orbital prefrontal gray matter volumes in schizophrenia. Arch Gen Psychiatry. 2000;57(8):761–768. | ||
Koelkebeck K, Hirao K, Miyata J, et al. Impact of gray matter reductions on theory of mind abilities in patients with schizophrenia. Soc Neurosci. 2013;8(6):631–639. | ||
Sergi MJ, Rassovsky Y, Nuechterlein KH, Green MF. Social perception as a mediator of the influence of early visual processing on functional status in schizophrenia. Am J Psychiatry. 2006;163(3):448–454. | ||
Rassovsky Y, Horan WP, Lee J, Sergi MJ, Green MF. Pathways between early visual processing and functional outcome in schizophrenia. Psychol Med. 2011;41(3):487–497. | ||
Stenbacka L. Functional imaging of peripheral vision and dorsal stream function in the human cerebral cortex [dissertation]. University of Helsinki; 2010. | ||
Di Russo F, Martínez A, Sereno MI, Pitzalis S, Hillyard SA. Cortical sources of the early components of the visual evoked potential. Hum Brain Mapp. 2002;15(2):95–111. | ||
Mathalon DH, Sullivan EV, Lim KO, Pfefferbaum A. Progressive brain volume changes and the clinical course of schizophrenia in men: a longitudinal magnetic resonance imaging study. Arch Gen Psychiatry. 2001;58(2):148–157. | ||
Steen RG, Mull C, McClure R, Hamer RM, Lieberman JA. Brain volume in first-episode schizophrenia: systematic review and meta-analysis of magnetic resonance imaging studies. Br J Psychiatry. 2006;188:510–518. | ||
Smieskova R, Fusar-Poli P, Allen P, et al. The effects of antipsychotics on the brain: what have we learnt from structural imaging of schizophrenia? –a systematic review. Curr Pharm Des. 2009;15(22):2535–2549. | ||
Fusar-Poli P, Smieskova R, Kempton MJ, Ho BC, Andreasen NC, Borgwardt S. Progressive brain changes in schizophrenia related to antipsychotic treatment? A meta-analysis of longitudinal MRI studies. Neurosci Biobehav Rev. 2013;37(8):1680–1691. | ||
Mane A, Falcon C, Mateos JJ, et al. Progressive gray matter changes in first episode schizophrenia: a 4-year longitudinal magnetic resonance study using VBM. Schizophr Res. 2009;114(1–3):136–143. |
Supplementary materials
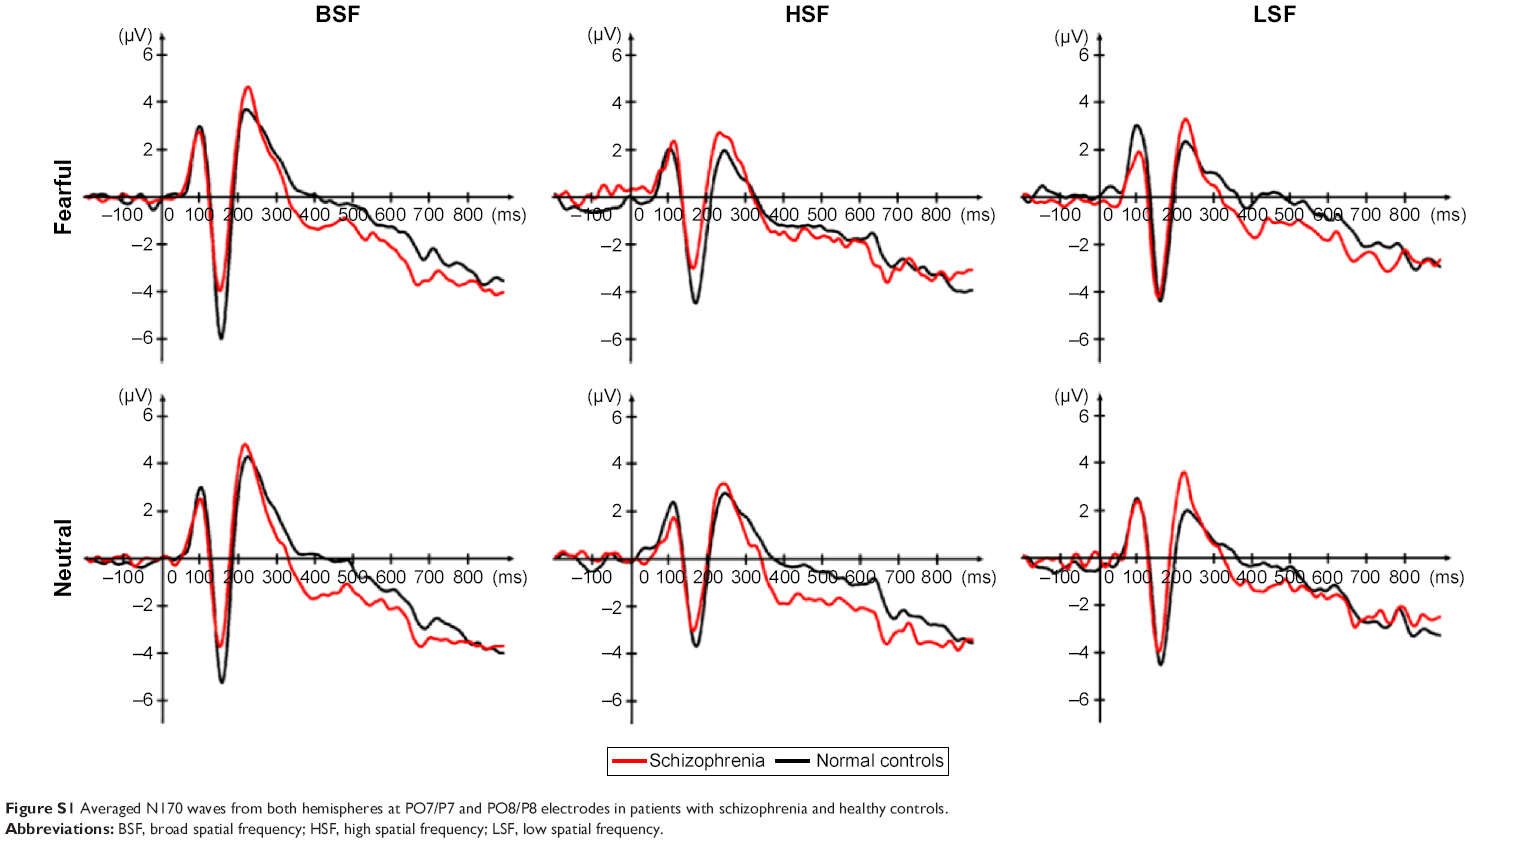 | Figure S1 Averaged N170 waves from both hemispheres at PO7/P7 and PO8/P8 electrodes in patients with schizophrenia and healthy controls. |
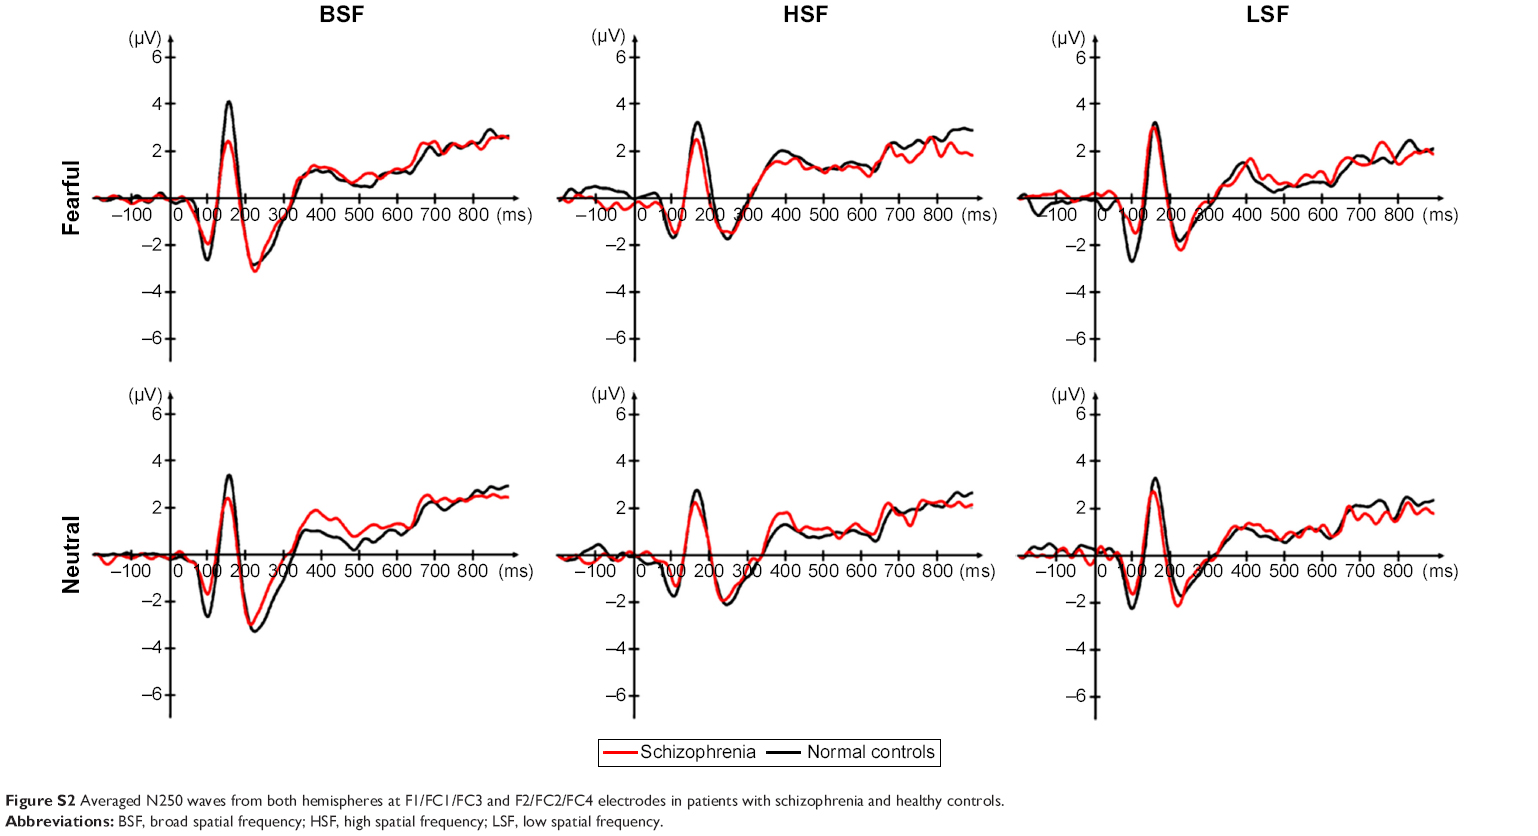 | Figure S2 Averaged N250 waves from both hemispheres at F1/FC1/FC3 and F2/FC2/FC4 electrodes in patients with schizophrenia and healthy controls. |
 | Figure S3 Averaged P300 waves from both hemispheres at F1/FC1 and F2/FC2 electrodes in patients with schizophrenia and healthy controls. |
 © 2015 The Author(s). This work is published and licensed by Dove Medical Press Limited. The
full terms of this license are available at https://www.dovepress.com/terms
and incorporate the Creative Commons Attribution
- Non Commercial (unported, 3.0) License.
By accessing the work you hereby accept the Terms. Non-commercial uses of the work are permitted
without any further permission from Dove Medical Press Limited, provided the work is properly
attributed. For permission for commercial use of this work, please see paragraphs 4.2 and 5 of our Terms.
© 2015 The Author(s). This work is published and licensed by Dove Medical Press Limited. The
full terms of this license are available at https://www.dovepress.com/terms
and incorporate the Creative Commons Attribution
- Non Commercial (unported, 3.0) License.
By accessing the work you hereby accept the Terms. Non-commercial uses of the work are permitted
without any further permission from Dove Medical Press Limited, provided the work is properly
attributed. For permission for commercial use of this work, please see paragraphs 4.2 and 5 of our Terms.