Back to Journals » Clinical Ophthalmology » Volume 14
Dry Eye Disease Association with Computer Exposure Time Among Subjects with Computer Vision Syndrome
Authors Sánchez-Valerio MR ![]() , Mohamed-Noriega K
, Mohamed-Noriega K ![]() , Zamora-Ginez I
, Zamora-Ginez I ![]() , Baez Duarte BG
, Baez Duarte BG ![]() , Vallejo-Ruiz V
, Vallejo-Ruiz V ![]()
Received 7 March 2020
Accepted for publication 1 July 2020
Published 8 December 2020 Volume 2020:14 Pages 4311—4317
DOI https://doi.org/10.2147/OPTH.S252889
Checked for plagiarism Yes
Review by Single anonymous peer review
Peer reviewer comments 2
Editor who approved publication: Dr Scott Fraser
María del Rosario Sánchez-Valerio,1 Karim Mohamed-Noriega,2 Irma Zamora-Ginez,1 Blanca Guadalupe Baez Duarte,1 Verónica Vallejo-Ruiz3
1Faculty of Medicine, Autonomous University of Puebla, Puebla, Puebla, México; 2Autonomous University of Nuevo León (UANL), Faculty of Medicine, University Hospital “José E. Gonzalez, Ophthalmology Department, Monterrey, México; 3Eastern Biomedical Research Center, Mexican Social Security Institute (IMSS), Metepec, Puebla, México
Correspondence: María del Rosario Sánchez-Valerio Tel +52 22 26039032
Email [email protected]
Purpose: To assess the time of exposure to the computer and dry eye disease (DED) in subjects with computer vision syndrome (CVS).
Methods: A cross-sectional study was conducted in office workers, computer users of both sexes, with an age range of 18– 45 years without comorbidities; we included 108 subjects divided into 3 groups according to the time of computer exposure in hours per day (H/D): < 4 (n = 23), 4 − 7.9 (n = 49), > 8 (n = 39). A specific questionnaire was applied to them on the exposure time and the type of visual display terminal (VDT) used, as well as the computer vision symptoms scale (CVSS17). DED was diagnosed with the Ocular Surface Disease Index (OSDI). Ocular surface damage and signs of DED were evaluated with the tear rupture time test (TBUT), the integrity of the ocular surface by ocular surface staining (OSS) and the production of the aqueous basal tear film using the Schirmer test.
Results: Average computer exposure time, measured differently, was positively correlated with DED development. The computer exposure time measured in hours per year and TBUT showed a significant negative correlation (p < 0.001) (rho − 0.463). Years of computer exposure and staining of the ocular surface showed a significant positive correlation (p < 0 0.001; rho 0.404). The accumulated exposure time was negatively correlated with TBUT (p < 0.001; rho − 0.376) and positively with OSS (p < 0.001; rho 0.433). Schirmer test did not correlate with computer exposure time.
Conclusion: The prolonged time of exposure to the computer in subjects with CVS was significantly correlated with the DED tests, in the different ways of measuring it; but not with the Schirmer test.
Keywords: computer vision syndrome, dry eye disease.
Introduction
Computer vision syndrome (CVS) is defined as “The combination of eye problems and vision, associated with prolonged use of computers.”1 This term is used to describe the collection of visual, ocular and musculoskeletal symptoms that result from prolonged computer or visual display terminal (VDT) use. It may develop when a computer is used >3 hours per day or >30 hours per week.1,2 It is characterized by constant symptoms ocular, visual and musculoskeletal as asthenopia, ocular surface alterations, visual and extra-ocular alterations.1–4 It can be diagnosed in a standardized and reliable way with the computer-vision symptom scale questionnaire (CVSS17).5 This questionnaire include encompasses 15 visual and ocular symptoms as well as ocular surface alterations include dry, red, wet or irritated eye related with the development of the dry eye.5 Dry eye disease diagnosis, classification and severity assessment require multiple evaluations; Schirmer test, tear break-up time (TBUT), ocular surface staining (OSS) with sodium fluorescein,6 and the ocular surface disease index (OSDI) questionnaire are among the more frequently used.7 Multiple OSS grading scales are available, Oxford, NEI and Sicca OSS are among the more often used nowadays.8–10 A prevalence of CVS has been reported around 70% among office workers, but varies around the world depending on the type of work performed.11,12 The main alteration observed in CVS is the development of the DED with a prevalence of 60%.13–15 CVS and DED reduce the quality of life and job performance.16 There is a common risk factor for the development of CVS and DED, this being prolonged computer exposure time. However, the prevalence and severity of DED in computer workers and its relationship with the magnitude of computer exposure time needs further studies to better understand its association. On this paper on CVS subjects, we report the prevalence, severity and association of DED with the computer exposure time.
Methods
Setting
We carried out a cross-sectional study in office workers who use any type of VDT, belonging to the Autonomous University of Puebla, in collaboration with the Ophthalmology department of the “José Eleuterio González” University Hospital, of the Autonomous University of Nuevo León and the Eastern Biomedical Research Center of the Mexican Institute of Social Security (IMSS).
Patients
This study was approved by the local committee for research and ethics in health research 2102, Mexican Institute of Social Security in Puebla, Mexico; registration number R-2015-2102-89. All patients signed an informed consent for inclusion in this study. The selected patients were office workers of both sexes, with an age range of 18–45 years, without comorbidities. Exclusion criteria were previous diagnosis of dry eye, use of artificial tears, any eye medication, diagnosis of pterygium, conjunctivitis, keratitis, blepharitis, facial nerve disorders, previous eye surgery, contact lens wearers, systemic chronic diseases, medication chronic systemic, pregnancy, menopausal or hormonal replacement therapy.
Evaluations
To assess computer exposure time, we applied a questionnaire to find out the amount of computer exposure time measured in hours per day (H/D), days per week (D/W), days per year (D/Y), also as total years of exposure to the computer with that rate of use (Y/CE). Using that information, we calculated computer exposure time expressed in hours per week (H/W), hours per year (H/Y), and hours accumulated in total years of computer exposure (CH/TY). In addition, we investigated the type of VDT used that included; desktop computer, laptop or iPad. With these data, we formed three groups based on the time of exposure to the computer, measured in hours per day (H/D) to know the results of the questionnaires and the DED tests between the groups. The CVS level of symptoms was obtained with the CVSS17,5 in which a value is assigned to each rated item and the sum of the item values is obtained to obtain a raw rating. This score is compared in an equivalence table to obtain the level of symptoms, which goes in ascending order from level 1 to 6; that is, the higher the level, the more symptoms of CVS.5 Symptomatic DED was diagnosed with the OSDI questionnaire, an OSDI value ≥13 was considered a diagnosis of DED.7 Ocular surface damage and signs of DED were assessed using three criteria. 1) Tear film stability using fluorescein or Tear Break up Time (TBUT). Fluorescein is instilled into the bottom of the lower sac and the tear film is examined with a blue filter; the appearance of the first dry spots on the cornea is observed since the last blink, the average is taken in seconds of three consecutive measurements and a diagnostic value of ≤10 is considered.6 2) the integrity of the corneal and conjunctival epithelium is observed with OSS stained with fluorescein and lissamine green using the Oxford, NEI or Sicca scales. OSS was judged as positive by obtaining a value greater than 1.8–10 3) Production of aqueous basal tear film using the Schirmer I test with anesthesia using topical tetracaine, a value of ≤5 mm was considered dry eye.6
Statistical Analysis
The sample calculation was performed considering our population as finite; since office workers that use computer from the Autonomous University of Puebla were invited to participate; considering a 95% confidence level, a prevalence of DED in computer users of 60% and an accuracy for our study of 5%; we obtained a sample calculation of 168 subjects. Data were captured in Microsoft Excel® 2013 for Windows XP. Statistics were performed in the Statistical Package for the social sciences (SPSS) version 23. Univariate statistical analysis was performed to describe qualitative variables these were reported in absolute frequencies. We used estimation, proportions and confidence intervals 95% (IC95%) to describe said quantitative variables. Measures of central tendency and dispersion was used for statistical inference, Spearman correlation for variables with non-normal distribution. The numeric variables; TBUT, Schirmer and ocular surface evaluation scales preserved their numeric gradient and the time variable, was considered initially numeric, and later was converted into an ordinal scale to groups formation (three exposure groups); reason for which the Spearman correlation for not normal distribution variables was used. We used chi-square to compare the frequency of symptomatic DED between the computer exposure groups and we used Kruskal Wallis’ ANOVA to assess the difference between DED screening tests in these groups.
Results
The study sample consisted of 310 subjects who were invited to participate in the study; of which 196 were excluded because they were carriers of some systemic or ocular disease and the remaining 119 subjects who met the inclusion criteria completed the CVSS17 and OSDI scales; of these, 11 subjects were eliminated for presenting infections or incomplete questionnaires; so the final sample was 108 subjects.
The ratio male: female was 59 (54.6%): 49 (45.4%). The average age ± standard deviation (DE) (min-max.) was 32.1 ± 7.8 (18–45) years. The most used type of computer was laptop (50.9%), desktop (38%) or both (11.1%). In addition, 38% of subjects additionally wore iPad, and only 38.9 wore lenses compared to 61.1% who did not. The mean ± SD (min-max.) Of the computer exposure time measured in H/D was 5.96 ± 2.5 (2–15) and the computer exposure time measured in different ways is summarized in Table 1. The Figure 1 shows that all the subjects had some level of symptoms for CVS; but the highest percentage (32.4%) was grouped at level 4. The proportion of subjects with DED symptoms detected by OSDI is shown in Figure 2. The largest number of subjects with DED was observed in the group of moderate computer exposure time as shown in Figure 3. Out of the 108 subjects examined, 104 (97.4%) presented dry eye in at least one of the evaluations applied, the summary of the altered tests can be seen in Table 2. Damage to the ocular surface and DED screening tests between asymptomatic and symptomatic are shown in Table 3.
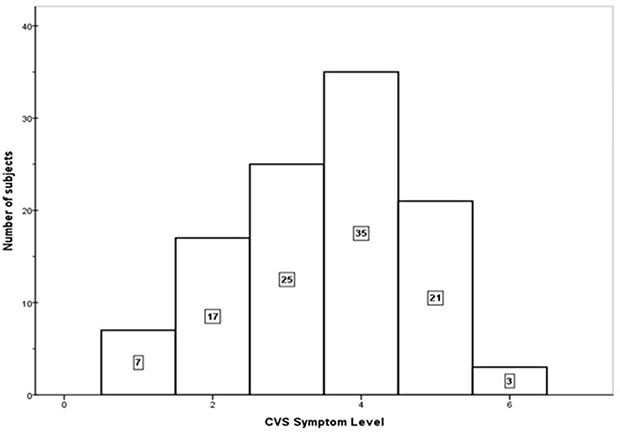 |
Figure 1 Magnitude and symptoms of computer visual syndrome. |
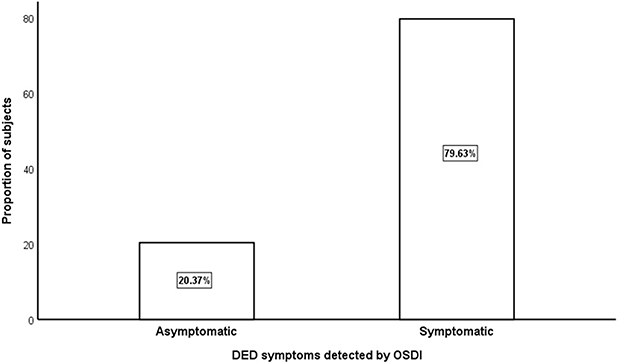 |
Figure 2 Proportion of subjects con DED detected by OSDI. |
 |
Figure 3 DED symptoms (OSDI) by computer exposure time group, measured in hours per day (H/D). |
 |
Table 1 Computer Exposure Time Resume |
 |
Table 2 Percentage of Tests Altered (n = 108) |
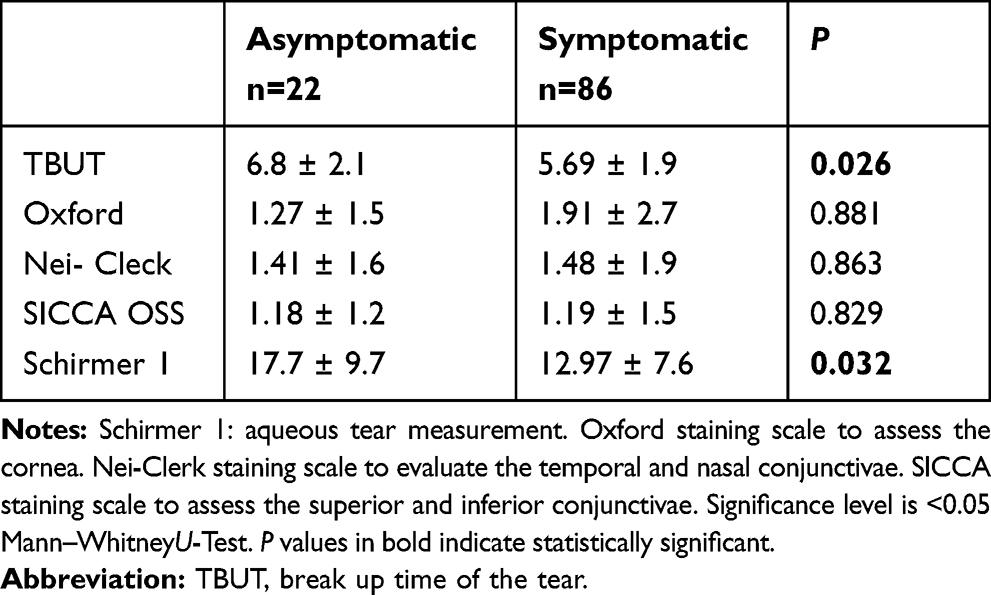 |
Table 3 Damage to the Ocular Surface and DED Screening Tests Between Asymptomatic and Symptomatic |
The detailed results of the correlation analysis between the computer exposure time measured in different ways and the DED screening tests can be found in Table 4. Where it is shown that the ocular surface evaluated by Oxford, Nei and Sicca showed a positive correlation with H/D, D/W, H/W, H/Y and the Schirmer test with none of these. Likewise, we found an important relationship between the time of exposure to the computer measured in hours per year and the TBUT (Rho −0.463) (p <0.000), this relationship is shown in Figure 4. We compared the frequency of symptomatic DED between the computer exposure groups, finding that with an error probability of 1.6% the symptoms of DED are different among the computer exposure groups, these differences are observed in Table 5. The DED screening tests showed differences among the computer exposure groups measured in hours per day, for all tests except for the Schirmer test. The groups showing the greatest difference were between mild and severe, for all tests, but the most relevant was TBUT, this can see in Table 6.
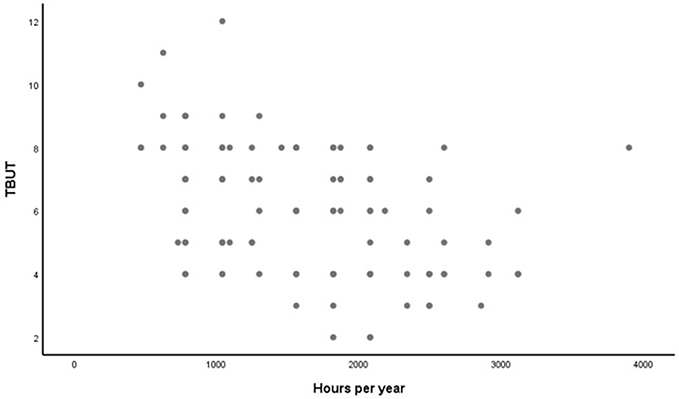 |
Figure 4 Correlation between exposure time and TBUT. |
 |
Table 4 Correlation Analysis Between DED Screening Tests and Computer Exposure Time Measured in Different Ways |
 |
Table 5 Number of Subjects with Symptomatic DED per Group |
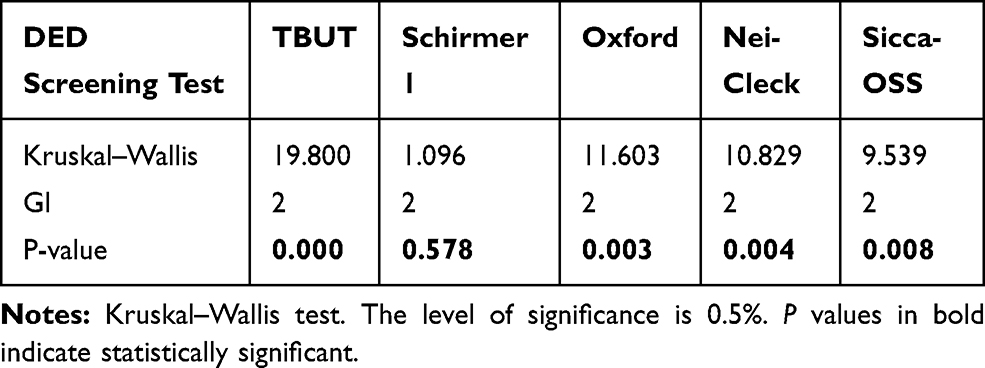 |
Table 6 Comparison the DED Screening Tests Between the Computer Exposure Groups Measured in Hours per Day |
Discussion
In our study, we found that in the subjects the average time of exposure to the computer was 5.96 hours per day; value similar to that published by the Mexican Internet Association (AMIPCI), who reported that Mexican Internet users have a connection time of 5.36 hours per day.17 This time was enough for 100% of users to show some degree of CVS symptoms and 97.4% will show DED in at least one of the tests evaluated; this suggests that CVS is not diagnosed with certainty but that the subjects manifest symptoms,18 which have been evaluated since 1995, by Gunnar who concluded through a survey that the longer the exposure time an individual had, the more severe the symptoms.19 Regarding assessments to diagnose DED, we observed a significant correlation between computer exposure time measured in different ways and tests to diagnose DED; cumulative computer exposure time measured in CM/TYC correlated with TBUT, but not with the Shimmer test, similar to what Nakamura mentions in a study of computer users with ages and conditions similar to ours.13 As for the accumulated exposure time; We analyzed studies in which it was concluded, like us, that a longer exposure time results in greater visual symptoms.20 We were able to measure and evaluate TBUT and damage to the ocular surface and we disagreed with Diaz et al, who mention that electronic devices do not produce organic damage, but rather influence the appearance of fatigue or asthenic symptoms if used in an appropriate manner inadequate;21 for which we emphasize that the mechanism by which the images are observed in the VDT, unintentionally reduces blinking, producing changes in lacrimal dynamics,22,23 decreases the expression of the meibomian gland and prevents an adequate distribution of the lipoid layer, contributing thus to the development of DED, damage to the ocular surface and eyelid disorders.23,24
Conclusions
The findings found in this study indicate that in our population, the computer exposure measured hours per day was 5.96 ± 2.5, slightly higher than those reported by AMIPCI and the average hours per week was 31.69 ± 14.1, minimum time required for the development of the CVS reported in the literature; likewise, 79.6% of the subjects that made up the sample had symptoms of DED, the stability of the lipid tear film was altered in 97.2% of the evaluated subjects; 44.4% of the subjects presented damage to the ocular surface and the aqueous lacrimal secretion was decreased only in 26.9% of the study population.
Weaknesses
The limits of this study are the lack of a control group with which to compare the results obtained in this investigation, in addition to having had limited resources to carry out more precise tests for the detection of DED.
New Knowledge
The present investigation focused on showing that very simple things such as the time that a subject is exposed to the computer and VDT are not innocuous, but that if they are presented repeatedly they can be associated with the development of DED in these subjects; reason why this investigation can contribute to create conscience in the users that the exhibition must be conscious and avoid the abuse to any type of VDT. Another favorable point is that as it is a relatively new line of research in Latin America, it implies a great amount of knowledge to be discovered with future studies and thus continue with precise recommendations on how to avoid CVS and DED caused by exposure to computers and VDT.
Recommendations
The present study showed results that can help prevent CVS and its complications. For now, the most important recommendations for everyday computer users are: decrease computer exposure and VDT below the average values found in this study: 5.96 ± 2.5 H/D or 31.69 ± 14.1 H/W; make computer exposure more efficient by avoiding unnecessary tasks, make flickering conscious when looking at any VDT, avoid taking long readings on small VDT, good limit on working area, suitable distance and position of recommended computer, wear goggles with anti-glare protection, rest by looking away to relax the accommodation system and avoid only near-vision tasks.4,20
Acknowledgment
This project received de following grant from our university: University Autonomous of Nuevo León (UANL), Faculty of Medicine, University Hospital “José E. Gonzalez”, Ophthalmology Department, Monterrey, México and the Eastern Biomedical Research Center, Mexican Social Security Institute (IMSS).
This manuscript was critically reviewed and corrected for language clarity and proficiency by professional English-language editing services and native English-speaking professionals in our institutional research vice-direction.
Disclosure
The authors report no conflicts of interest for this work.
References
1. Blehm C, Vishnu S, Khattak A, Mitra S, Yee RW. Computer vision syndrome: a review. Surv Ophthalmol. 2005;50(3):253–262. doi:10.1016/j.survophthal.2005.02.008
2. Bali J, Neeraj N, Bali R. Computer vision syndrome: a review. J Clin Ophthalmol Res. 2014;2(1):61–68. doi:10.4103/2320-3897.122661
3. Gowrisankaran S, Sheedy J. Computer vision syndrome: a review. Work. 2015;52(2):303–314. doi:10.3233/WOR-152162
4. Loh K. Understanding and preventing computer vision syndrome. Acad Fam Physicians Malays. 2008;128–130.
5. Gonzalez-Pérez M, Susi R, Barrio A, Barrio A, González E. The computer-vision symptom scale (CVSS17): development and initial validation. Invest Ophthalmol Vis Sci. 2014;55(7):4504–4511. doi:10.1167/iovs.13-13818
6. Craig JP, Nelson JD, Azar DT, et al. The TFOS dry eye workshop II: executive summary. Ocul Surf. 2017;15(4):802–812. doi:10.1016/j.jtos.2017.08.003
7. Schiffman R. Reliability and validity of the ocular surface disease index. Arch Ophthalmol. 2000;118(5):615. doi:10.1001/archopht.118.5.615
8. Bron A, Evans V, Smith J. Grading of corneal and conjunctival staining in the context of other dry eye tests. Cornea. 2003;22(7):640–650. doi:10.1097/00003226-200310000-00008
9. Kyung-Chul Yoon MD, Seong-Kyu I, Kim H-G, You I-C. Usefulness of double vital staining with 1% fluorescein and 1% lissamine green in patients with dry eye syndrome. Cornea. 2011;2011(30):972–976. doi:10.1097/ICO.0b013e31820687dd
10. Chun Y, Park I. Reliability of 4 clinical grading systems for corneal staining. Am J Ophthalmol. 2014;157(5):1097–1102. doi:10.1016/j.ajo.2014.02.012
11. Akinbinu TR, Mashalla YJ. Medical practice and review impact of computer technology on health: computer vision syndrome (CVS). Acad J. 2014;5(November):20–30.
12. Al Rashidi SH, Alhumaidan H. Computer vision syndrome prevalence, knowledge and associated factors among Saudi Arabia university students: is it a serious problem? Int J Health Sci. 2017;11(5):17–19.
13. Nakamura S, Kinoshita S, Yokoi N, Ogawa Y. Lachrymal hypofunction as a new mechanism of dry eye in visual display terminal users. PLoS One. 2010;1.
14. Uchino M, Yokoi N, Uchino Y, et al. Prevalence of dry eye disease and its risk factors in visual display terminal users: the osaka study. Am J Ophthalmol. 2013;2013(156):759–766. doi:10.1016/j.ajo.2013.05.040
15. Kawashima M, Yamatsuji M, Yokoi N, et al. Screening of dry eye disease in visual display terminal workers during occupational health examinations: the Moriguchi study. J Occup Health. 2015;57(3):253–258. doi:10.1539/joh.14-0243-OA
16. Miljanovic B, Dana R, Sullivan DA, Schaumberg DA. Impact of dry eye syndrome on vision-related quality of life. Am J Ophthalmol. 2007;143(3):409–415. doi:10.1016/j.ajo.2006.11.060
17. Available from: www.amipci.org.mx.
18. Del Río Martinez J, Gonzalez Videgraray M. Trabajo prolongado con computadoras: Consecuencias sobre la vista y la fatiga cervical. México, D.F: SEMAC; 2007.
19. Aronsson G, Strömberg A. Work content and eye discomfort in VDT work. Int J Occup Saf Ergon. 1995;1995(1):1–13. doi:10.1080/10803548.1995.11076300
20. Tamez-González S, Ortiz-Hernández L. Riesgos y daños a la salud derivados del uso de videoterminal. Salud Publica Mex. 2003;2003(45):171–180.
21. Díaz AA, Reyes NB, Rangel LEC. Efectos de los dispositivos electrónicos sobre el sistema visual. Rev Mex De Oftalmol. 2017;91(2):103–106. doi:10.1016/j.mexoft.2016.03.008
22. Abusharha A. Changes in blink rate and ocular symptoms during different reading tasks. Clin Optom. 2017;9:133–138. doi:10.2147/OPTO.S142718
23. Maj Gen JKS, Jain VK, Chaturvedi P, Kaushik J, Jain G, Parihar AKS. Computer and visual display terminals (VDT) vision syndrome (CVDTS). Med J Armed Forces India. 2016;72(3):270–276. doi:10.1016/j.mjafi.2016.03.016
24. Debra S, Nichols JJ, Papas EB, Tong L, Uchino M, Nichols KK. The international workshop on meibomian gland dysfunction: report of the subcommittee on the epidemiology of, and associated risk factors for MGD. Invest Ophthalmol Vis Sci. 2011;52(4):1994–2005. doi:10.1167/iovs.10-6997e
 © 2020 The Author(s). This work is published and licensed by Dove Medical Press Limited. The
full terms of this license are available at https://www.dovepress.com/terms
and incorporate the Creative Commons Attribution
- Non Commercial (unported, 3.0) License.
By accessing the work you hereby accept the Terms. Non-commercial uses of the work are permitted
without any further permission from Dove Medical Press Limited, provided the work is properly
attributed. For permission for commercial use of this work, please see paragraphs 4.2 and 5 of our Terms.
© 2020 The Author(s). This work is published and licensed by Dove Medical Press Limited. The
full terms of this license are available at https://www.dovepress.com/terms
and incorporate the Creative Commons Attribution
- Non Commercial (unported, 3.0) License.
By accessing the work you hereby accept the Terms. Non-commercial uses of the work are permitted
without any further permission from Dove Medical Press Limited, provided the work is properly
attributed. For permission for commercial use of this work, please see paragraphs 4.2 and 5 of our Terms.