Back to Journals » International Journal of Nanomedicine » Volume 12
Dose and time effect of CdTe quantum dots on antioxidant capacities of the liver and kidneys in mice
Authors Wang J, Sun H, Meng P, Wang M, Tian M, Xiong Y, Zhang X, Huang P ![]()
Received 17 May 2017
Accepted for publication 8 August 2017
Published 1 September 2017 Volume 2017:12 Pages 6425—6435
DOI https://doi.org/10.2147/IJN.S142008
Checked for plagiarism Yes
Review by Single anonymous peer review
Peer reviewer comments 2
Editor who approved publication: Dr Linlin Sun
Jilong Wang,1,2,* Hubo Sun,1,2,* Peijun Meng,1,2 Mengmeng Wang,1,2 Mi Tian,3 Yamin Xiong,1,2 Xueying Zhang,1,2 Peili Huang1,2
1School of Public Health, Capital Medical University, 2Beijing Key Laboratory of Environmental Toxicology, 3Medical Experiment and Test Center, Capital Medical University, Beijing, People’s Republic of China
*These authors contributed equally to this work
Abstract: Although quantum dot (QD)-induced toxicity occurs due to free radicals, generation of oxidative stress mediated by reactive oxygen species (ROS) formation is considered an important mechanism. However, free radical mechanisms are essentially difficult to elucidate at the molecular level because most biologically relevant free radicals are highly reactive and short-lived, making them difficult to directly detect, especially in vivo. Antioxidants play an important role in preventing or, in most cases, limiting the damage caused by ROS. Healthy people and animals possess many endogenous antioxidative substances that scavenge free radicals in vivo to maintain the redox balance and genome integrity. The antioxidant capacity of an organism is highly important but seldom studied. In this study, the dose and time effects of CdTe QDs on the antioxidant capacities of the liver and kidneys were investigated in mice using the electron paramagnetic resonance (EPR) spin-trapping technique. We found that the liver and kidneys of healthy mice contain specific antioxidant capacities that scavenge ·OH and ·O2-. Furthermore, oxidative stress markers (superoxide dismutase [SOD], catalase [CAT], glutathione peroxidase [GPx], glutathione [GSH] and malondialdehyde [MDA]) were examined. In dose course studies, the free radical scavenging efficiencies of the liver and kidneys were found to gradually decrease with increasing concentration of CdTe QD exposure. The activities and levels of SOD, CAT, GPx and MDA were observed to increase in treated groups, whereas those of GSH were reduced. The time course studies revealed that the QD-induced antioxidant efficiency reduction was time dependent with GSH decrease and could recover after a period of time. These experimental results offer new information on QD toxicity in vivo. Specifically, CdTe QDs can deplete GSH to reduce the elimination ability of the liver and kidneys for ·OH and ·O2-, thus inducing oxidative damage to tissues.
Keywords: quantum dot, antioxidative capacity, free radical elimination, hydroxyl radical, superoxide anion radical, spin-trapping
Abbreviations
AFM, atomic force microscopy; ALB, serum albumin; ANOVA, analysis of variance; CAT, catalase; Cd, cadmium; DMPO, 5,5-dimethyl-1-pyrroline N-oxide; ENPs, engineered nanoparticles; EPR, electron paramagnetic resonance; Fe, iron; GPx, glutathione peroxidase; GSH, glutathione; GSSG, glutathione disulfide; H2O2, hydrogen peroxide; HX, xanthine; ICP-MS, inductively coupled plasma mass spectrometry; MDA, malondialdehyde; NBT, nitro-blue-tetrazolium; NIH, National Institute of Health; NPs, nanoparticles; ·OH, hydroxyl radical; ·O2−, superoxide anion radical; QD, quantum dot; ROS, reactive oxygen species; RSD, relative standard deviation; SOD, superoxide dismutase; Te, tellurium; TGA, thioglycolic acid; XOD, xanthine oxidase.
Introduction
QDs are ENPs that emit tunable, discrete fluorescence based on particle diameter. The fields of application for QDs range from medical imaging and new drug delivery technologies to various industrial products. As these applications for QDs expand, studies are needed to determine whether QDs or their degradation products pose risks to organisms. Several published reports indicate that QDs can cause toxicity in vitro and in vivo.1 The cytotoxic effects of Cd-based QDs can be ascribed to the following mechanisms: degradation of the QDs and consequent release of free Cd ions (Cd2+)2–4 and generation of ROS.5–7
ROS are a group of compounds endowed with high reactivity and short half-lives because of their tendency to give or receive electrons to attain stability. The three major types of ROS are H2O2, ·O2− and ·OH. The ·O2− and ·OH are known as oxygen-free radicals. The most vulnerable biological targets for ROS are proteins, membrane lipids and DNA. Although ROS play an important and extensive role, their overproduction can lead to oxidative stress, which induces irreversible damage to cells and tissues. To avoid an excess of ROS, the body’s induced endogenous antioxidant systems (SOD, CAT, GPx, GSH, uric acid and coenzyme Q),8,9 with input from cofactors and by ingestion of exogenous antioxidants (β-carotene, vitamins C, vitamins E and selenium, a trace metal required for proper function of one of the body’s antioxidant enzyme systems), attempt to maintain a production and consumption balance.9–11 These antioxidants are molecules that can safely interact with free radicals and terminate the free radical chain reaction before vital molecules are damaged. Although QD-induced toxicity occurs through free radicals and generation of oxidative stress mediated by ROS formation is considered an important mechanism, free radical mechanisms are essentially difficult to elucidate at the molecular level because most biologically relevant free radicals are highly reactive and short-lived, making them difficult to detect directly, especially in vivo.12
In previous studies of NP-mediated oxidative stress, the antioxidant capacities of an organism have been typically deduced based on selected changes in antioxidant substances, eg, enzyme activities and lipid peroxidation levels. In fact, the individual changes might not accurately reflect the body’s antioxidant capacity because in addition to the abovementioned antioxidant substances, serum proteins such as ALB also possess specific antioxidant functions due to their multiple ligand-binding capacities and free radical-trapping properties.13 Furthermore, it has been recognized that NPs in the biological environment can be absorbed by proteins, thereby forming a “corona” on the surfaces of NPs. Interactions between NPs and proteins also occur (eg, the protein structure of ALB is more vulnerable to disruption in the presence of QDs).14 The interaction between NPs and proteins is of great relevance in nanotoxicology.15–18 Thus, observation of the effects of QDs on the total antioxidant capacity in biological systems aids in building an overall understanding of the biological effects of QDs. EPR spectroscopy is the only direct and obvious method for detection and measurement of free radicals. EPR spectroscopy can be used to directly study free radicals in the blood and tissues19,20 or in vitro antioxidant study of natural antioxidants.21,22
Previously, we reported that the liver and kidneys appear to be the major organs of QD deposition after intravenous administration and that QDs can undergo degradation in vivo.23,24 The liver and kidneys are the most important organs for obtaining an overall assessment of the immune response and antioxidant activity.25 We also studied QD-mediated toxicity across different time points and explored the roles of free Cd ions (Cd2+) and ·OH in the liver and kidney damage. Our results showed that QD-induced histopathological changes were time dependent with elevated Cd2+ and ·OH and could recover after a period of time.26
We consider that the antioxidant capacity of tissues is often associated with their ability to scavenge stable free radicals and that ·OH and ·O2− are two of the most reactive and physiologically harmful free radicals. In the current study, the dose and time effects of CdTe QDs on the ·OH and ·O2− elimination ability of the liver and kidneys were investigated in mice using the EPR spin-trapping technique. Furthermore, oxidative stress markers such as SOD, CAT and GPx and the levels of GSH and MDA were also investigated.
Materials and methods
Characteristics of CdTe QDs
The TGA-stabilized CdTe QDs were prepared by Nanjing University. Prior to use in our experiments, the CdTe QD stock solutions were centrifuged at 650× g for 15 min at room temperature to remove large aggregates. The supernatants were dialyzed for 4 h through a 10 kDa cellulose membrane (Sigma-Aldrich Co., St Louis, MO, USA) against a 0.1% solution of thioglycolate (sodium salt; Sigma-Aldrich Co.) at pH 8.3 to remove any free Cd, Te and other small molecules from the solutions.23 The stock solutions were further dialyzed for 2 h against distilled water (pH 8.3) to remove the unbound thioglycolate. The size distribution and surface characteristics of the CdTe QDs were analyzed using AFM (Nano Scope 3D; Veeco, Plainview, NY, USA). Moreover, the fluorescence spectra, peak wavelengths and fluorescence intensities were measured using a fluorescence spectrometer (RF-5301; Shimadzu, Kyoto, Japan). The concentrations of Cd in the stock solutions were quantitatively measured using ICP-MS (7500ce; Agilent Technologies, Santa Clara, CA, USA). Prior to injection into mice, the CdTe QD solutions were freshly dissolved in normal saline containing PBS (pH 7.4) and sonicated for 5 min to disperse the CdTe QD particles evenly throughout the solutions. The final concentrations of the solutions were adjusted to 5 μmol/mL (calculated based on the molar mass of Cd).23
Animals
Healthy male Institute of Cancer Research mice (6 weeks old) were purchased from Beijing (Military Medical Science Academy of the People’s Liberation Army). The mice were housed in a ventilated, temperature-controlled and standardized sterile animal room with a 12-h day/night cycle at the China Capital Medical University. The mice were allowed to acclimate to the animal room for 7 days prior to experimentation. All animal care and experimentations were approved by the Animal Experiments and Experimental Animal Welfare Committee of Capital Medical University (ethical review number: 2011-X-072) and were in compliance with the NIH guidelines for the Care and Use of Laboratory Animals.
Mice weighing between 32.1 and 33.6× g were administered the CdTe QD solutions via one-time tail vein injections of a single dosage of 0.15, 1.5 and 15 μmol/kg (dose calculated based on the molar mass of Cd). The mice in the control group were injected with an equivalent volume of normal saline. Preliminary observations of food intake, fur, behavior, mental status, urine and feces were conducted daily for each mouse. For the 0.15 and 15 μmol/kg groups at 24 h and for the 1.5 μmol/kg group at the predetermined time points (24 h and 7, 14, and 28 days), six mice from each exposed group were anesthetized using isoflurane. Hematology, blood biochemistry and histopathological alterations were subsequently evaluated (selected experimental results have been previously reported26). Other tissues were rinsed with ice-cold sterile saline to remove any remaining traces of blood, sliced as soon as possible in the ice bath and homogenized with saline the volume of which was nine times the masses of the tissues using FASTPREP-24 at speed setting 6 for 40 s (MP Biomedicals, Santa Ana, CA, USA). The 10% homogenates were centrifuged (4°C, 600× g, 10 min; centrifuge, 5424R Eppendorf Co., Germany), and the supernatants were collected. Some supernatants were used for free radical detection immediately, others were stored in multiple aliquots at −80°C for the oxidative stress marker measurements, which were performed within 2 weeks from collection. Sets of control mice were also sacrificed in strict accordance with the procedures applied for the exposed mice.
Effects of CdTe QDs on the antioxidant capacities of the liver and kidneys
Hydroxyl radical measurements
DMPO was used as a spin trap to monitor the changes in ·OH concentration via EPR spectroscopy. The Fenton reaction was used to generate the necessary ·OH, which was prepared by the reaction of Fe with H2O2. DMPO traps the ·OH and forms a DMPO-OH adduct, and the resultant aminoxyl radical is detectable by EPR. To 40 μL of 0.1 mol/L phosphate buffer (pH 7.4), 10 μL 1% H2O2, 20 μL 0.1 mol/L DMPO (Sigma-Aldrich Co.) and 20 μL saline were added, followed by 10 μL of 10 mmol/L Fe-EDTA solution (10 mmol/L ferrous ammonium sulfate and 20 mmol/L EDTA).27 EPR spectra were recorded on a JES-FA300 spectrometer (Japan Electron Optics Laboratory Company, Tokyo, Japan) operating in X-band at room temperature. Typical spectrometer settings are listed as follows: magnetic field center 336 mT, sweep width 15 mT, microwave frequency 9.43 GHz, microwave power 1 mW, modulation width 0.35 mT, time constant 0.1 s, sweep time 30 s and scan number 3.
Superoxide anion radical measurements
The HX/XOD system was used to generate the necessary ·O2−.28 DMPO traps the ·O2− and forms a DMPO-OOH adduct for EPR detection. To 40 μL of 0.1 mol/L phosphate buffer (pH 7.4), 10 μL 0.5 mol/L HX (Sigma-Aldrich Co.), 20 μL 0.1 mol/L DMPO, 20 μL saline were added, followed by 10 μL of 0.12 U/mL XOD (Sigma-Aldrich Co.). EPR spectra were recorded on a JES-FA300 spectrometer operating in X-band at room temperature. Typical spectrometer settings are listed as follows: magnetic field center 336 mT, sweep width 15 mT, microwave frequency 9.43 GHz, microwave power 5 mW, modulation width 0.05 mT, time constant 0.1 s, sweep time 30 s and scan number 3.
Hydroxyl- and superoxide anion radical elimination ability of the liver and kidneys
An amount of 20 μL of homogenate supernatants of the liver or kidneys of the control group was used instead of saline in the abovementioned solution to detect the antioxidant capacities of the liver and kidneys. The antioxidant capacities of the liver and kidneys were measured as their ·OH and ·O2− elimination ability. The effects of CdTe QDs on the antioxidant capacity were measured in terms of the changes in the ·OH and ·O2− elimination ability of the liver and kidneys in the exposed groups and were expressed in terms of clearance rate. The clearance rate was determined by comparing the results of the exposed and control groups using the following formula: clearance rate (%) = (EPR spectra of DMPO-OH/DMPO-OOH adduct intensity − EPR spectra of DMPO-OH/DMPO-OOH adduct intensity of exposure groups)/(EPR spectra of DMPO-OH/DMPO-OOH adduct intensity − EPR spectra of DMPO-OH/DMPO-OOH adduct intensity of control groups) × 100%. The clearance rate of ·OH and ·O2− of the liver and kidneys in the control mice was assumed to be 100%.
Oxidative stress markers
The activities of SOD, CAT and GPx and GSH and MDA levels in the liver and kidneys were estimated based on the method described by Manjamalai and Berlin Grace.21 SOD activity was determined indirectly by the method of NBT.29 CAT activity was measured by colorimetric assay. The dichromate in acetic acid was reduced to chromic acetate when heated in the presence of H2O2 with the formation of perchromic acid as an unstable intermediate. The chromic acetate thus produced was measured colorimetrically at 590 nm.30 GPx activity was measured at 340 nm by quantifying the rate of oxidation of reduced GSH to oxidized GSH.31 All results are expressed as U/mg protein. The GSH levels were measured at 412 nm using the 5,5′-dithio-bis-[2-nitrobenzoic acid] (DTNB) spectrophotometric method and are expressed as μg/mg protein.32 The thiobarbital method was used to determine MDA concentrations, absorbance was measured at 532 nm to determine absorbance and results are expressed as nmol/mg protein.33
Statistical analysis
All data presented in this paper are shown as relative values ± the RSD. The results were compared using one-way ANOVA. The difference between two groups was assessed using the independent t-test. A value of p<0.05 was considered statistically significant.
Results
Characteristics of CdTe QDs
AFM was used to evaluate the shape, morphology and size of the CdTe QDs used in this study (Figure 1A). AFM imaging suggested that the diameter of the CdTe QDs was approximately 3–4 nm. Evaluation of the fluorescence spectrum indicated that the maximum emission occurred at 620 nm following excitation at 490 nm (Figure 1B). The concentration of the CdTe QDs stock solution was 5 μmol/mL (calculated based on the molar mass of the Cd).
 | Figure 1 Characteristics of CdTe QDs: (A) AFM image; (B) absorption and emission spectra. |
Specific antioxidant capacities of the liver and kidneys
The liver and kidneys are vital metabolic and excretory organs in animals and have special antioxidant function because they can produce a multitude of antioxidant substances such as metallothionein, ALB, SOD and CAT. These antioxidants have been reported as radical scavengers. The EPR spectra for DMPO-OH (Figure 2A) and DMPO-OOH (Figure 2B) adducts and the scavenging spectra of the liver and kidneys in the control mice are shown in Figure 2, showing that the liver and kidneys of healthy mice exhibit specific antioxidant capacities by scavenging ·OH and ·O2−.
 | Figure 2 EPR spectra. |
Dose course study
Antioxidant capacity assay
Figure 3 shows that the ·OH and ·O2− scavenging activities of the liver and kidneys in mice gradually decreased with the increase in the concentration of CdTe QD exposure, The respective clearance rates of ·OH and ·O2− of the liver in mice exposed to 0.15, 1.5 and 15 μmol/kg CdTe QDs were 94.7% (±4.7), 90.7% (±4.7) and 69.7.0% (±4.9) and 90.7% (±4.5), 81.7% (±5.7) and 45.5% (±3.7), and in contrast, the respective clearance rates of ·OH and ·O2− of the kidneys were 97.1% (±3.6), 82.9% (±5.3) and 66.5% (±4.4) and 86.4% (±6.3), 69.5% (±3.8) and 60.7% (±3.5).
 | Figure 3 Clearance rate of ·OH and ·O2− in the liver (A) and kidneys (B) in mice exposed to 0.15, 1.5 and 15 μmol/kg CdTe QDs. |
Oxidative stress marker assay
The effects of CdTe QDs on the activities of SOD, CAT and GPx and the levels of GSH and MDA in the liver and kidneys are shown in Figure 4. Figure 4 demonstrates the same impacts of CdTe QDs on the liver and kidneys in mice. Significant increases in the activities of SOD, CAT and GPx were noted. Compared with the control group, every group showed a significant difference (p<0.05) except for the SOD activities of the 0.15 μmol/kg group. In addition, the levels of MDA increased significantly (p<0.05) and those of GSH decreased significantly (p<0.05).
 | Figure 4 Oxidative stress markers of the liver (A–E) and kidneys (F–J) in mice exposed to 0.15, 1.5 and 15 μmol/kg CdTe QDs. |
Time course study
Antioxidant capacity assay
Figure 5 shows the changes in the ·OH and ·O2− scavenging activities of the liver and kidneys exposed to 1.5 μmol/kg CdTe QDs during the 28-day period. In liver, at 1 day post injection, the ·OH and ·O2− scavenging activities were slightly reduced compared with those in the control mice (90.7%±4.7%, p<0.05; 81.7%±5.7%, p<0.05). At 7 days, the ·OH and ·O2− clearance rate reached the lowest values (84.9%±5.5%, p<0.05; 77.2%±4.5%, p<0.05) and subsequently increased from 14 to 28 days. At 28 days, the ·OH and ·O2− scavenging activities returned to near normal. In the kidneys, at 1 day post injection, the ·OH and ·O2− scavenging activities were significantly reduced compared with those in the control mice (82.9%±5.3%, p<0.05; 69.5%±3.8%, p<0.05). At 7 days, the ·OH and ·O2− clearance rates reached their lowest values (64.3%±6.5%, p<0.05; 55.5%±4.3%, p<0.05) and subsequently increased from 14 to 28 days. At 28 days, the ·OH and ·O2− scavenging activities also returned to near normal. Although the liver and kidneys showed the same trend, the change values in the kidneys were significantly larger than those in the liver at the same time points, which indicates that CdTe QDs have a more significant effect in the kidneys than in the liver on the free radical scavenging activity.
 | Figure 5 Clearance rate of ·OH (A) and ·O2− (B) of the liver and kidneys in mice exposed to 1.5 μmol/kg CdTe QDs for periods of up to 28 days. |
Oxidative stress marker assay
The results of the determination of SOD, CAT, GPx, GSH and MDA in the liver and kidneys of the mice exposed to CdTe QDs are shown in Figure 6. The elevations of the activity of SOD, CAT and GPx in the QD-treated mice persisted during 14 days. Notably, at 1 day, the activities of SOD, CAT and GPx almost reached their peak values in the liver and kidneys, of which a subset was 2–4 times greater than the activity observed in the liver and kidneys of the controls. At 28 days, these levels gradually return to normal. In contrast, GSH levels decreased significantly, which persisted for 28 days. After reaching the lowest values, even if the levels then gradually increased from 7 or 14, to 28 days, the levels still remained lower than the controls. For the kidneys, the values dropped to one-third to one-fifth of the level observed in the controls. The MDA levels in both the liver and kidneys (p<0.05) were significantly elevated compared with those in the control mice at 1 day post injection. At 7 days, the MDA levels reached their peak values. For the liver, the elevation persisted during the 28 days. For the kidneys, the elevation decreased from 14 to 28 days before returning to normal.
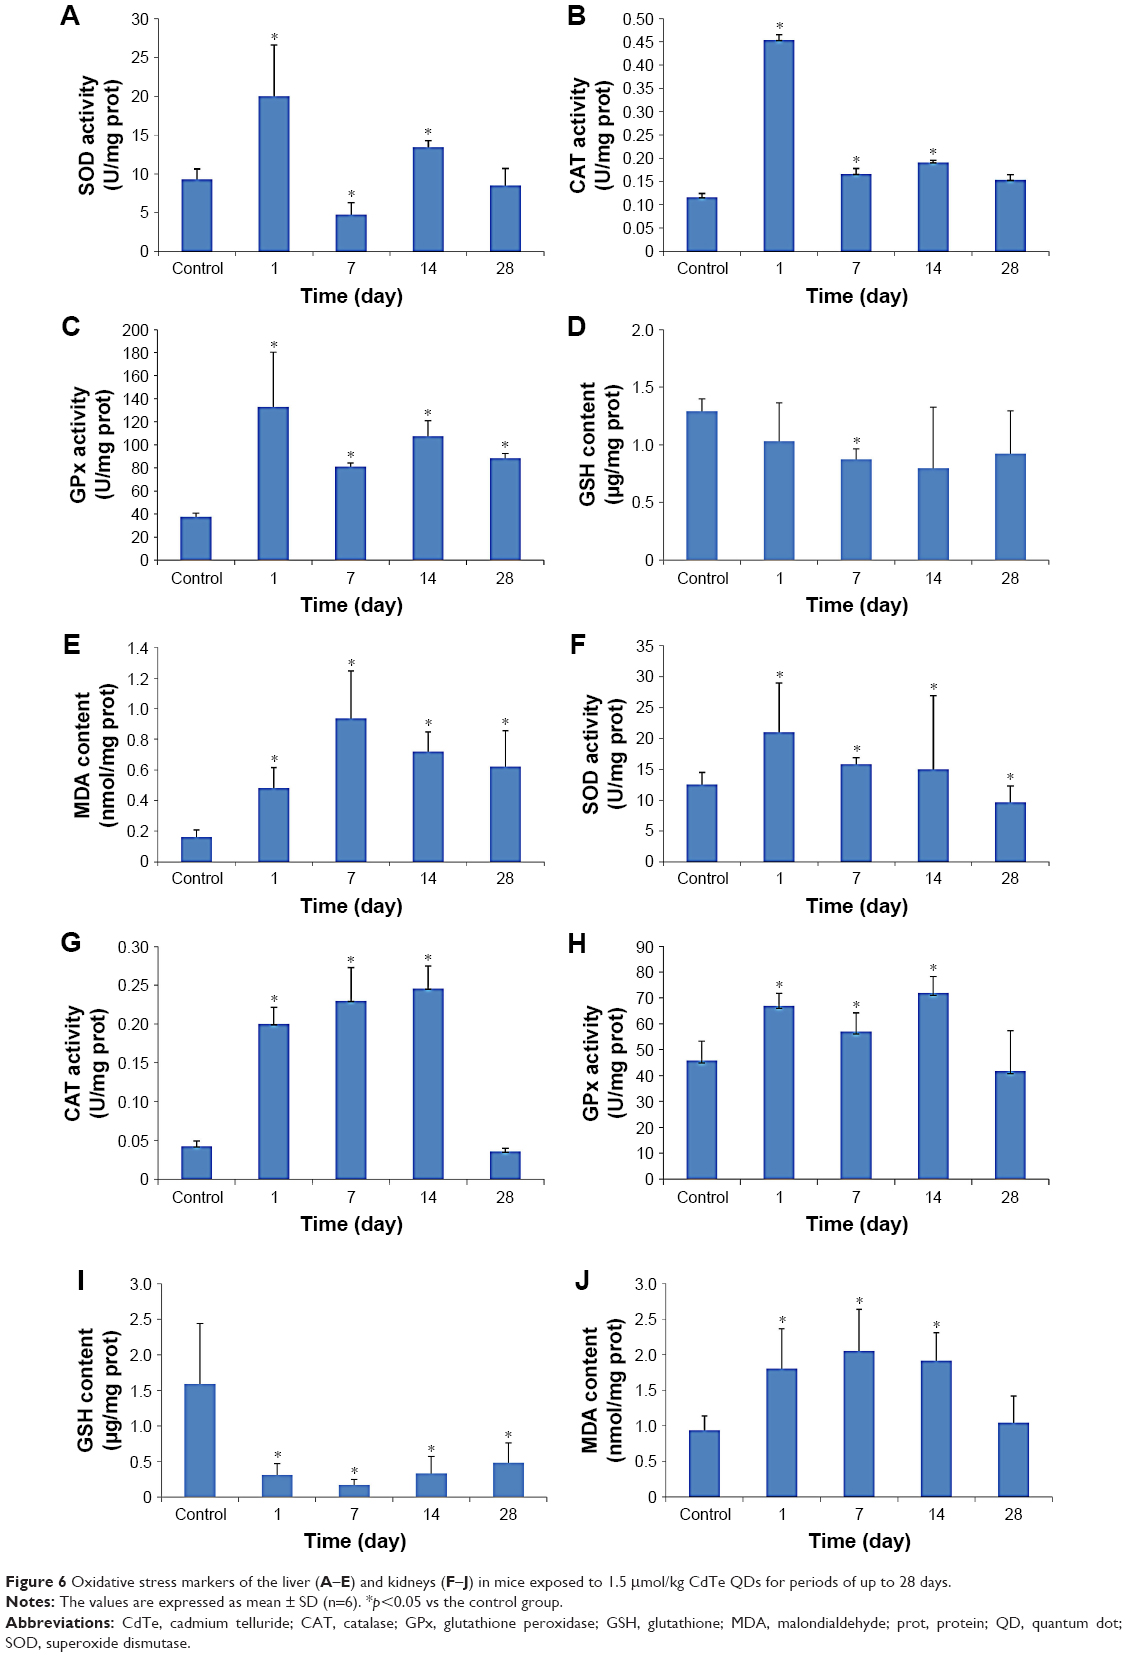 | Figure 6 Oxidative stress markers of the liver (A–E) and kidneys (F–J) in mice exposed to 1.5 μmol/kg CdTe QDs for periods of up to 28 days. |
Discussion
The most convincing evidence shows that ROS are nearly constant in most organs or tissues. Oxidative stress induced by ROS generation is involved in many diseases, and the compounds that inhibit lipid peroxidation or scavenge ROS can prevent pathophysiological changes and promote functional recovery and survival in experimental studies. EPR has been recognized as one of the most powerful techniques for the detection of ROS in the form of free radicals in biological tissues and cells. Furthermore, following their use in investigations in rodent disease models, EPR techniques might be applicable to the assessment of antioxidant properties of drugs or food factors.34 In our previous study, we measured ·OH production in the liver and kidneys of mice exposed to 1.5 μmol/kg CdTe QDs for periods of up to 28 days. Our results revealed that, at 1 day post injection, generation of ·OH in both the liver and kidneys (p<0.05) was significantly elevated compared with the control mice. At 7 days, the ·OH production reached peak values and subsequently significantly decreased from 14 to 28 days. Generation of ·OH in the kidneys was also significantly higher than that in the liver at the same time points.26
Considering that the liver and kidneys contain many antioxidative substances, in our current investigation, we focused our work on examining the changes in the ·OH and ·O2− elimination ability of the liver and kidneys in mice exposed to CdTe QDs to estimate the dose effect and time effect of CdTe QDs on the antioxidant capacity of tissue using the EPR spin-trapping technique. The Fe2+/H2O2 and HX/XOD reaction system was used to generate the necessary ·OH and ·O2−. Because ·OH and ·O2− are highly reactive radical species with a notably short life, DMPO is a popular spin trap that has been used to form DMPO-OH and DMPO-OOH. Our results indicate that the liver and kidneys of healthy mice have specific antioxidant capacities and that CdTe QDs can reduce the antioxidant capacities of the liver and kidneys. The reductions were dose dependent and time dependent. In the time course study of the antioxidant capacity changes, we found that the changes in the antioxidant capacities of the liver and kidneys during the 28-day period are according to our previous studies of ·OH generation.26 At 7 days, the antioxidant capacities of the liver and kidneys reached their lowest values and were contrasted with the ·OH production.
We also analyzed the oxidative stress markers in the liver and kidneys. As oxidative stress markers, SOD, CAT, GPx, GSH and MDA, have often been used to evaluate the oxidative stress status of tissues. In general, SOD catalyzes ·O2− into H2O2 and CAT catalyzes the decomposition of H2O2 to H2O and O2.35 GPx is an enzyme family with peroxidase activity, and its major biological role is to protect the organism from oxidative damage, reduce lipid hydroperoxides to their corresponding alcohols and reduce H2O2 to H2O. In our study, the activities of SOD, CAT and GPx of the liver and kidneys of mice exposed to CdTe QDs were significantly increased in a dose-dependent manner. The time course study showed that the activities of SOD, CAT, and GPx in the liver and kidneys in the exposed groups increased at 1 day and subsequently decreased, and at 28 days, they gradually returned to normal. These results indicate that the tissues might alleviate peroxide stress by increasing the activities of antioxidant enzymes. GSH plays an important role in the endogenous antioxidant system. A high concentration of GSH is found in the liver, and hence it is known to have a key function in the protective process. In contrast to the increase in antioxidant enzyme activities, CdTe QDs decreased the hepatic and renal GSH contents, indicating that the CdTe QD-induced antioxidant capacity reduction in the liver and kidneys is associated with GSH depletion. Furthermore, the consumption of GSH in the kidneys was significantly higher than that in the liver at the same time points, in accordance with our previous report that the generation of ·OH in the kidneys was higher than that in the liver.26 Lipid peroxidation is a well-established mechanism of cellular injury in living organisms and is used as an indicator of oxidative stress in cells and tissues. These lipid peroxides are unstable and decompose to form a complex series of compounds such as reactive carbonyl compounds. Measurement of MDA has been used as an indicator of lipid peroxidation.36 In the current study, the level of MDA in both the liver and kidneys significantly increased in a dose-dependent manner. The time course study showed that the levels of MDA reached their peak values at 7 days, which is in agreement with their lowest values of the free radical clearance rate of the liver and kidneys. These results are also in accordance with our previous reports that ·OH generation reached a peak value at 7 days. This result clearly indicated that CdTe QDs induced tissue oxidative damage by reducing the ability to scavenge free radicals.
Conclusion
Although an important mechanism of QD-induced toxicity is the generation of ROS and oxidative stress, the effects of QDs on the native antioxidant capacity of tissues have not yet been studied. In the current study, we first evaluated the effects of CdTe QDs on the antioxidant capacities of the liver and kidneys. The experimental results offer new information on the toxicity of QDs in vivo. Specifically, CdTe QDs can deplete GSH to reduce the ·OH and ·O2− elimination ability of the liver and kidneys, thus inducing oxidative damage in tissues. Because GSH reductase can catalyze the reduction in GSSG to the sulfhydryl form of GSH, understanding the interactions of QDs with GSH reductase and monitoring the activity of GSH reductase might contribute to exploration of the mechanism of QD-induced toxicity.
Acknowledgments
We thank Hui Wang, Jiayi Li and Yue Hu for their helpful discussions. This work was supported by the National Natural Science Foundation of China (81573201, 81273131), the Beijing Natural Science Foundation Program and the Scientific Research Key Program of Beijing Municipal Commission of Education (KZ201510025027).
Disclosure
The authors report no conflicts of interest in this work.
References
Hardman R. A toxicologic review of quantum dots: toxicity depends on physicochemical and environmental factors. Environ Health Perspect. 2006;114(2):165–172. | ||
Su Y, Hu M, Fan C, et al. The cytotoxicity of CdTe quantum dots and the relative contributions from released cadmium ions and nanoparticle properties. Biomaterials. 2010;31(18):4829–4834. | ||
Kirchner C, Javier AM, Susha AS, et al. Cytotoxicity of nanoparticle-loaded polymer capsules. Talanta. 2005;67(3):486–491. | ||
Kirchner C, Liedl T, Kudera S, et al. Cytotoxicity of colloidal CdSe and CdSe/ZnS nanoparticles. Nano Lett. 2005;5(2):331–338. | ||
Tang S, Cai Q, Chibli H, Allagadda V, Nadeau JL, Mayer GD. Cadmium sulfate and CdTe-quantum dots alter DNA repair in zebrafish (Danio rerio) liver cells. Toxicol Appl Pharmacol. 2013;272(2):443–452. | ||
Katsumiti A, Gilliland D, Arostegui I, Cajaraville MP. Cytotoxicity and cellular mechanisms involved in the toxicity of CdS quantum dots in hemocytes and gill cells of the mussel Mytilus galloprovincialis. Aquat Toxicol. 2014;153:39–52. | ||
Zhao Y, Lin K, Zhang W, Liu L. Quantum dots enhance Cu2+ −induced hepatic L02 cells toxicity. J Environ Sci (China). 2010;22(12):1987–1992. | ||
Halliwell B. Free radicals and antioxidants – quo vadis? Trends Pharmacol Sci. 2011;32(3):125–130. | ||
Wu JQ, Kosten TR, Zhang XY. Free radicals, antioxidant defense systems, and schizophrenia. Prog Neuropsychopharmacol Biol Psychiatry. 2013;46:200–206. | ||
Rahal A, Kumar A, Singh V, et al. Oxidative stress, prooxidants, and antioxidants: the interplay. Biomed Res Int. 2014;2014:761264. | ||
Niki E. Assessment of antioxidant capacity in vitro and in vivo. Free Radic Biol Med. 2010;49(4):503–515. | ||
Fu PP, Xia Q, Hwang HM, Ray PC, Yu H. Mechanisms of nanotoxicity: generation of reactive oxygen species. J Food Drug Anal. 2014;22(1):64–75. | ||
Taverna M, Marie AL, Mira JP, Guidet B. Specific antioxidant properties of human serum albumin. Ann Intensive Care. 2013;3(1):4. | ||
Xiao J, Bai Y, Wang Y, Chen J, Wei X. Systematic investigation of the influence of CdTe QDs size on the toxic interaction with human serum albumin by fluorescence quenching method. Spectrochim Acta A Mol Biomol Spectrosc. 2010;76(1):93–97. | ||
Joshi P, Chakraborty S, Dey S, et al. Binding of chloroquine-conjugated gold nanoparticles with bovine serum albumin. J Colloid Interface Sci. 2011;355(2):402–409. | ||
Meder F, Daberkow T, Treccani L, et al. Protein adsorption on colloidal alumina particles functionalized with amino, carboxyl, sulfonate and phosphate groups. Acta Biomater. 2012;8(3):1221–1229. | ||
Lacerda SH, Park JJ, Meuse C, et al. Interaction of gold nanoparticles with common human blood proteins. ACS Nano. 2010;4(1):365–379. | ||
Lundqvist M, Stigler J, Elia G, Lynch I, Cedervall T, Dawson KA. Nanoparticle size and surface properties determine the protein corona with possible implications for biological impacts. Proc Natl Acad Sci U S A. 2008;105(38):14265–14270. | ||
Sachdev S, Davies KJ. Production, detection, and adaptive responses to free radicals in exercise. Free Radic Biol Med. 2008;44(2):215–223. | ||
Mrakic-Sposta S, Gussoni M, Montorsi M, Porcelli S, Vezzoli A. Assessment of a standardized ROS production profile in humans by electron paramagnetic resonance. Oxid Med Cell Longev. 2012;2012:973927. | ||
Manjamalai A, Berlin Grace VM. Antioxidant activity of essential oils from Wedelia chinensis (Osbeck) in vitro and in vivo lung cancer bearing C57BL/6 mice. Asian Pac J Cancer Prev. 2012;13(7):3065–3071. | ||
Zhang QA, Shen Y, Fan XH, Martin JF, Wang X, Song Y. Free radical generation induced by ultrasound in red wine and model wine: an EPR spin-trapping study. Ultrason Sonochem. 2015;27:96–101. | ||
Liu N, Mu Y, Chen Y, et al. Degradation of aqueous synthesized CdTe/ZnS quantum dots in mice: differential blood kinetics and biodistribution of cadmium and tellurium. Part Fibre Toxicol. 2013;10:37. | ||
Han Y, Xie G, Sun Z, et al. Plasma kinetics and biodistribution of water-soluble CdTe quantum dots in mice: comparison between Cd and Te. J Nanopart Res. 2011;13(10):5373–5380. | ||
Song C, Liu B, Xie J, et al. Comparative proteomic analysis of liver antioxidant mechanisms in Megalobrama amblycephala stimulated with dietary emodin. Sci Rep. 2017;7:40356. | ||
Wang M, Wang J, Sun H, et al. Time-dependent toxicity of cadmium telluride quantum dots on liver and kidneys in mice: histopathological changes with elevated free cadmium ions and hydroxyl radicals. Int J Nanomedicine. 2016;11:2319–2328. | ||
Zhao W, Richardson JS, Mombourquette MJ, Weil JA. An in vitro EPR study of the free-radical scavenging actions of the lazaroid antioxidants U-74500A and U-78517F. Free Radic Biol Med. 1995;19(1):21–30. | ||
Nakajima A, Sakurai Y, Matsuda E, et al. Ability of water-soluble biosubstances to eliminate hydroxyl and superoxide radicals examined by spin-trapping ESR measurements: two-dimensional presentation of antioxidative ability. Biosci Biotechnol Biochem. 2013;77(2):324–331. | ||
McCord JM, Fridovich I. Superoxide dismutase. An enzymic function for erythrocuprein (hemocuprein). J Biol Chem. 1969;244(22):6049–6055. | ||
Sinha AK. Colorimetric assay of catalase. Anal Biochem. 1972;47(2):389–394. | ||
Rotruck JT, Pope AL, Ganther HE, Swanson AB, Hafeman DG, Hoekstra WG. Selenium: biochemical role as a component of glutathione peroxidase. Science. 1973;179(4073):588–590. | ||
Hafeman DG, Sunde RA, Hoekstra WG. Effect of dietary selenium on erythrocyte and liver glutathione peroxidase in the rat. J Nutr. 1974;104(5):580–587. | ||
Ohkawa H, Prosser CL. Electrical activity in myenteric and submucous plexuses of cat intestine. Am J Physiol. 1972;222(6):1412–1419. | ||
Lee MC. Assessment of oxidative stress and antioxidant property using electron spin resonance (ESR) spectroscopy. J Clin Biochem Nutr. 2013;52(1):1–8. | ||
Sumner JB, Dounce AL. Crystalline catalase. Science. 1937;85(2206):366–367. | ||
Rikans LE, Yamano T. Mechanisms of cadmium-mediated acute hepatotoxicity. J Biochem Mol Toxicol. 2000;14(2):110–117. |
 © 2017 The Author(s). This work is published and licensed by Dove Medical Press Limited. The
full terms of this license are available at https://www.dovepress.com/terms
and incorporate the Creative Commons Attribution
- Non Commercial (unported, 3.0) License.
By accessing the work you hereby accept the Terms. Non-commercial uses of the work are permitted
without any further permission from Dove Medical Press Limited, provided the work is properly
attributed. For permission for commercial use of this work, please see paragraphs 4.2 and 5 of our Terms.
© 2017 The Author(s). This work is published and licensed by Dove Medical Press Limited. The
full terms of this license are available at https://www.dovepress.com/terms
and incorporate the Creative Commons Attribution
- Non Commercial (unported, 3.0) License.
By accessing the work you hereby accept the Terms. Non-commercial uses of the work are permitted
without any further permission from Dove Medical Press Limited, provided the work is properly
attributed. For permission for commercial use of this work, please see paragraphs 4.2 and 5 of our Terms.