Back to Journals » Patient Preference and Adherence » Volume 13
Does “hospital loyalty” matter? Factors related to the intention of using a mobile app
Authors Lin YH ![]() , Guo JL
, Guo JL ![]() , Hsu HP, Yang LS, Fu YL
, Hsu HP, Yang LS, Fu YL ![]() , Huang CM
, Huang CM ![]()
Received 4 March 2019
Accepted for publication 21 June 2019
Published 31 July 2019 Volume 2019:13 Pages 1283—1294
DOI https://doi.org/10.2147/PPA.S207031
Checked for plagiarism Yes
Review by Single anonymous peer review
Peer reviewer comments 2
Editor who approved publication: Dr Johnny Chen
Yun-Hsuan Lin,1,2 Jong-Long Guo,3 Hsiao-Pei Hsu,2 Li-Shu Yang,4 Ya-Lin Fu,2,4 Chiu-Mieh Huang5
1Department of Nursing, Ching Kuo Institute of Management and Health, Keelung, Taiwan; 2Department of Nursing, School of Nursing, National Yang-Ming University, Taipei, Taiwan; 3Department of Health Promotion and Health Education, College of Education, National Taiwan Normal University, Taipei, Taiwan; 4Department of Nursing, Mackay Junior College of Medicine, Nursing, and Management, Taipei, Taiwan; 5Institute of Clinical Nursing, School of Nursing, National Yang-Ming University, Taipei, Taiwan
Purpose: This study aimed to explore the association between hospital loyalty, perceived usefulness of a mobile app, perceived ease of use of that mobile app, and satisfaction with the app’s use as well as predicting patients’ intended use of the app.
Patients and methods: Purposive sampling was adopted in a cross-sectional survey. The participants were outpatients at the traditional Chinese medicine departments of three hospitals in northern Taiwan (n=125). The self-report questionnaire comprised information about sociodemographics and scales related to hospital loyalty, perceived usefulness of the mobile app, its perceived ease of use, satisfaction with its use, and its usage intention. The data were analyzed using structural equation modeling.
Results: The four factors explained 70% variance in usage intention. The perceived usefulness of the mobile app directly and indirectly affects their usage intention, but its perceived ease of use had only indirect effects on the usage intention. Perceived usefulness and perceived ease of use influence the usage intention through satisfaction. The women’s hospital loyalty does not directly affect the usage intention of the mobile app, but indirectly affects it through perceived usefulness and perceived ease of use of the mobile app.
Conclusion: Intended use of the app by women is mainly related to their experience of which is usefulness, ease of use and satisfaction of service are the most important factors contributing to continuous use. Hospital loyalty does not directly affect intention to use as expected. The influence of loyalty must be related to the patients’ perception of the product, in terms of usefulness, ease to use, and satisfaction. The finding is helpful to understand patients’ preference and support their behavioral adherence.
Keywords: usage intention, patient engagement, hospital loyalty, technology acceptance model, mobile application
Introduction
Background
Studies have shown that adjusting eating habits and adopting a healthy lifestyle would be beneficial for relieving menstrual discomfort symptoms.1 Studies have also reported that patients believe that traditional Chinese medicine (TCM) involves holistic care, and that practitioners of TCM will guide them to take better care of themselves.2,3 However, TCM requires patients to follow medical instructions for a long time; this is one reason patients withdraw from the treatment. Therefore, adherence is a key factor in the process and outcomes of TCM care, in order to develop a healthy lifestyle.4
Studies have shown that patients’ engagement with e-monitoring leads to good adherence of instructions.5,6 A mobile application (app) for healthcare is a tool that can improve patients’ engagement in self-care, and can be helpful for behavioral adherence.7,8 The versatility of mobile apps makes users more participatory, thus empowering them in making an informed choice for themselves.9 Using a mobile app as a tool for patient health management has become an extended healthcare service provided by hospital organizations.10–12 Hence, understanding technology acceptance from a patient’s perspective will enable hospital administrators or health care professionals to better design patient app content.
Theoretical framework and hypothesis development
The technology acceptance model (TAM) is a theoretical basis to propose a model of e-monitor usage intention, and it has received empirical support in predicting technology acceptance and adoption.13–16 This model provides a theoretical basis for determination of the external variables that affect users’ internal beliefs, attitudes, and intentions, thereby affecting users’ information technology use.13 Two motivational factors, perceived usefulness (PU) and perceived ease of use (PEOU), which were hypothesized to be the fundamental determinants of a user’s acceptance and elicit an attitude toward continuing use.15
PU is defined as the users’ perception of the system as enhancing work efficiency.13 Patients tend to use an app that they believe will improve their disease care.17–19 Furthermore, PU has direct and indirect effects on usage intention.13–16 If a patient perceives technology to be a useful way to work more effectively, that patient tends to use the technology.
PEOU is defined as the users’ perception of the system as being free of challenges or effort.13 Davis found that PEOU has a influence on PU,13 and recent studies have also shown that PEOU directly affects PU.13–15 Moreover, it has been noted in technology acceptance research that PEOU has direct effects on usage intention,20,21 as well as indirect effects on usage intention.13–16 If the patient perceives that the technology is easy to operate, that patient tends to use it. Based on these understandings, the following hypotheses were proposed:
H1a: PU of the mobile app is positively related to its usage intention. (PU→Usage intention) H1b: PEOU of the mobile app is positively related to its usage intention. (PEOU→Usage intention) H1c: PEOU of the mobile app is positively related to its PU. (PEOU→PU)
Mobile apps is one of the healthcare services that has promotes patients’ health and has positive effects on their behavioral adherence. Mobile apps are used to support patients’ behavioral adherence, such as in the cases of chronic kidney disease, chronic obstructive pulmonary disease, heart failure, diabetes, cancer, and post-operative management.7,10,11,17–19 However, whether patients continue to use an app service depends on their satisfaction with the service.22,23 User satisfaction is defined as the degree to which users are satisfied with their former use of an information system.24 With regard to service quality, patient satisfaction is critical to healthcare organizations. Advanced technology has made it possible for healthcare organizations to begin to design digital services to enhance patients’ satisfaction and experiences. In addition, Zhou and colleagues found that user satisfaction with mobile apps is associated with their usefulness as perceived after a trial,25 and recent studies have shown that user satisfaction is an important factor that affects the usage of technology as well as being the most influential predictor of user loyalty and usage intention.26,27 Patients with higher satisfaction with healthcare services have better medical adherence and are more active in self-care, resulting in better health outcomes,23 and they are more likely to continue using healthcare services.28
According to the TAM, attitude is an explanatory factor for PU and PEOU. A study of the end user information systems satisfaction indicated that satisfaction was one dimension of attitude.29 Previous study included satisfaction as a representative of attitude in testing TAM.30 The research findings demonstrated that satisfaction has a positive effect on intention.31,32 A study of the customer satisfaction in mobile service sector found that PU and PEOU have a positive effect on satisfaction.33 In accordance with the above literature review, the following hypotheses were proposed:
H2a: Satisfaction with the mobile app use is positively related to its usage intention. (Satisfaction→Usage intention) H2b: PU of the mobile app is positively related to its usage intention through satisfaction with its use. (PU→Satisfaction→Usage intention) H2c: PEOU of the mobile app is positively related to its usage intention through satisfaction with its use. (PEOU→Satisfaction→Usage intention)
Hospital loyalty is important for healthcare organizations to sustain their enterprise in the long term.34 Healthcare organization could see itself as a solution provider, and patient problems would be viewed more broadly, with a more comprehensive understanding of the various needs and situations of use by its patients. In the healthcare context, the healthcare service is a product, and the hospital is a brand.28 The patient’s loyalty to the hospital brand will affect the patient’s usage intention of the mobile app. Loyalty is defined as the continued use of a service and is grounded in attitudes toward the service.35 Loyalty symbolized the relationship between an individual’s attitude toward a service and patronage with the service provider.36 Brand loyalty is defined as the situation when customers will continue to repeat purchases and recommend the particular company’s products to others.37 The effects of digital services on hospital loyalty have not been fully investigated, unlike in other fields such as marketing studies.38 Therefore, this study attempted to use brand influence to determine the effects of satisfaction with and usage intention of a mobile app. However, some questions remain. Will hospital loyalty affect satisfaction with mobile app use through its PU, and indirectly affect usage intention? Will hospital loyalty affect satisfaction with the mobile app use through its PEOU and indirectly affect usage intention? These have not been discussed in the literature. In accordance with the above reasoning, the following hypotheses were proposed:
H3a: Hospital loyalty is positively related to usage intention of the mobile app. (Hospital loyalty→Usage intention) H3b: Hospital loyalty is positively related to usage intention of the mobile app through satisfaction with its use. (Hospital loyalty→Satisfaction→Usage intention) H3c: Hospital loyalty is positively related to usage intention of the mobile app through PU of mobile app to affect satisfaction with the mobile app use. (Hospital loyalty→PU→Usage intention) H3d: Hospital loyalty is positively related to usage intention of the mobile app through PEOU of the mobile app to affect satisfaction with its use. (Hospital loyalty→PEOU→Usage intention)
The research model is shown in Figure 1.
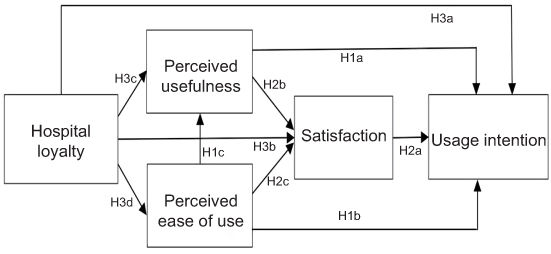 |
Figure 1 Research model. |
Aim
Mobile apps with an e-monitor function have positive effects on patients’ behavioral adherence. Exploration of the factors contributing to the usage intention of mobile apps is helpful for supporting patients’ behavioral adherence. Hence, this study aimed to explore the association between hospital loyalty, PU of a mobile app, PEOU of the app, and satisfaction with the app use as well as their effects in predicting patients’ usage intention of the mobile app.
Materials and methods
Mobile app design
We designed a mobile app to enable participants to self-monitor their behavior. A team of experts was brought together, including an obstetrics and gynecology nurse, a TCM physician, a nursing scholar, and a health educator. The functions and design of the app are a result of the discussion outcomes between the research team and programmer. The designated app could be used on iPhone (iOS) and Android devices and downloaded for free through the Apple Store and Google Play. Due to it being flexible, convenient, and recordable, the app could assist participants in recording and monitoring their status on smartphones or tablets. Vericode was used as security testing for the app. All data were saved on a secure encrypted password-protected server with access limited to study personnel through the administration portal.
Components of the app included monitoring and calendar functions. (1) The monitoring function documented participants’ behavioral adherence, namely, whether the users use medication according to physician’s instructions, use painkillers, consume cold or raw food, and engage in exercise. The monitoring function also assessed participants’ menstrual status in terms of their pain level (0–10 points), menstrual discomfort (0–10 points), amount of blood loss (little, moderate, or severe), and presence of blood clots (yes-no). (2) The calendar function enable data storage and remind the date of outpatient follow-up. Information input by users are automatically converted to aggregate data in terms of behavioral adherence and menstrual status, and the behavior and menstrual status are noted on the calendar.
The main function of the app is to monitor participants’ adherence to their behavioral regimen and the incidences of menstrual distress by using the app to add time records. Participants were not required to provide any personal information. Furthermore, no electronic information was provided to them because participants received oral or written educational materials at the follow-up outpatient visit if necessary.
It can review the process of recording and help participants understand their behavioral adherence and menstrual status pertaining to medical care. Through the presentation of monthly data, women can be better informed about their menstrual status, menstrual symptoms, and behavioral adherence. The reminder function automatically displays messages prior to a scheduled follow-up visit, allowing participants to remember the day on which they need to make another visit. The mobile app design is shown in Figure 2.
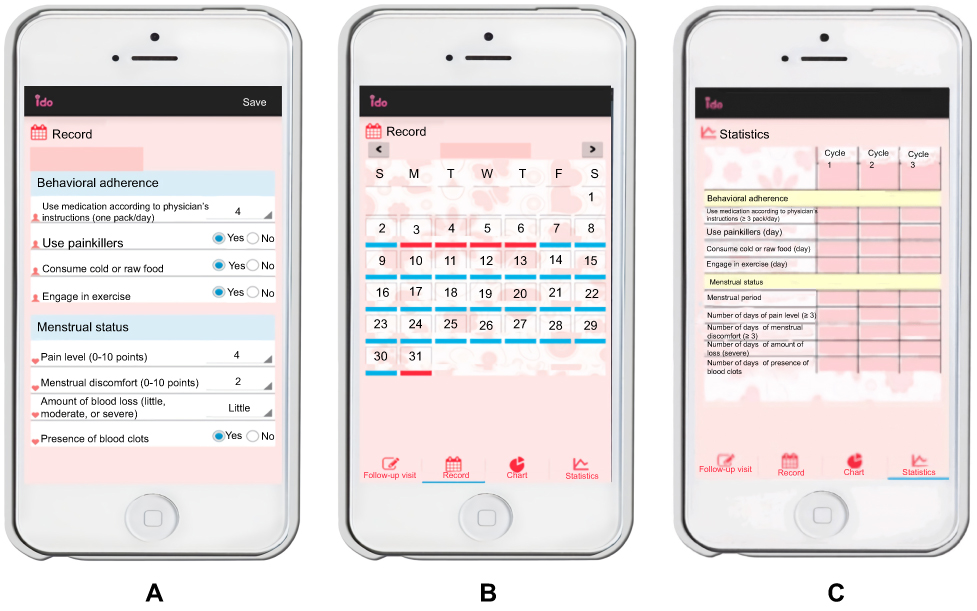 |
Figure 2 Mobile app design – (A) assessment of behavioral and menstrual status; (B) calendar function; (C) data storage (The content of this interface has been translated into English; the original interface is in Chinese.). |
Participants and data collection
Purposive sampling was adopted in the cross-sectional survey. We enrolled the eligible participants from outpatients at the TCM departments of three hospitals in northern Taiwan. The inclusion criteria were as follows: women who (1) were aged 20–50 years, (2) had experienced menstrual symptoms in the past 3 months, (3) were currently receiving TCM treatment, (4) have smart phone and often use it, and (5) were willing to participate in the study and sign a consent form. We excluded participants whose regular physician visits were for the treatment of cancer, other chronic illnesses, or mental illness.
After explaining the study purpose and process to the participants and obtaining their consent, we helped them install the app on their personal smartphones. We provided a set of account numbers and passwords to the participants, introduced the interface and function of the app, helped the participants log in to the app to key in their menstrual status and behavioral adherence pertaining to medical care from the previous month. We let them try to use the app, and asked about their feelings after using it and intention to continue using the app; they then completed structured questionnaires. The questionnaires did not ask for the names of the respondents and assured the respondents that their responses would be used only for academic research. In addition, a number of gifts were provided to patients participating in this study to enhance their willingness to complete the questionnaires. Data were collected by the research team members.
Sample size estimation
A widely accepted principle suggested by Gorsuch and Everitt is that a quality ratio is 5 to 10 cases per parameter variable;39,40 MacCallum suggested that 100–200 cases would be adequate for SEM.41 This study has 15 parameters, so according to the above principles, the estimated sample size is 75–150. A total of 156 patients met the inclusion criteria; among them, 31 patients failed to complete the questionnaire, and they were excluded from analysis. The final sample consisted of 125 patients, which is an adequate number for analysis. The overall response rate was 80%.
Measures
To test the 10 proposed hypotheses, a questionnaire was used to obtain data for analysis. The self-report questionnaire was composed of information about sociodemographics and scales related to hospital loyalty, PU of the mobile app, its PEOU, satisfaction with its use, and its usage intention. The questionnaire was developed based on the framework of TAM as well as the literature review (Table S1).13,16,21,35
The sociodemographic variables included age, body mass index (BMI), educational level, marital status, work/school duration, obstetric and gynecological diagnosis, pregnancy experience, and experience of childbirth.
Hospital loyalty
Loyalty is the degree to which a customer reuses a service and has a positive attitude toward the provider.42 In this study, hospital loyalty was defined as the intention and preference for returning to a specific hospital.43 It was measured using three items, for example: “I would like to use the service again” with a five-point Likert scale with scores ranging from 1 (strongly disagree) to 5 (strongly agree). The scores ranged from 3 to 15 and higher scores indicated a higher loyalty to the hospital. The Cronbach’s α coefficient was 0.75 in its development32 and 0.88 in this study.
Perceived usefulness
People prefer to use an app when they believe it will improve their job performance and living efficiency; if the app is useful, the more they will continue to use it.15 In this study, PU of the mobile app was defined as the extent to which participants perceived the app to be helpful for maintaining menstrual records and behavioral adherence to medical instructions.13 It was measured using four items, for example: “Overall, the application is useful for my self-care” with a five-point Likert scale from 1 (strongly disagree) to 5 (strongly agree). The scores ranged from 4 to 20 and higher scores indicated a higher PU of the mobile app. The Cronbach’s α coefficient was 0.87 in its development22 and 0.88 in this study.
Perceived ease of use
People prefer to use an app when they believe that using it is free of effort, and that they do not need to spend too much time learning it.13 In this study, PEOU of the mobile app was defined as the extent to which the app was perceived to be easy to operate.15 It was measured using four items, for example: “The interface design of the application was clear and understandable” with a five-point Likert scale from 1 (strongly disagree) to 5 (strongly agree). The scores ranged from 4 to 20 and higher scores indicated a higher PEOU of the mobile app. The Cronbach’s α coefficient was 0.90 in its development20 and 0.93 in this study.
Satisfaction
Satisfaction is the customer’s post-purchase evaluation and emotional response to a product or service experience.44 In this study, Satisfaction with the mobile app use was defined as the satisfaction with use of the mobile app.35 It was measured using two items, for example: “I felt satisfied after using application” with a five-point Likert scale from 1 (strongly disagree) to 5 (strongly agree). The scores ranged from 2 to 10 and higher scores indicated a higher satisfaction with the mobile app use. The Cronbach’s α coefficient was 0.84 in its development35 and 0.88 in this study.
Usage intention
Usage intention is not only continuing an activity, but also routinization and conformation.45 In this study, Usage intention of the mobile app was defined as the intention to use the app continuously.15 It was measured using two items, for example: “I will use the application in the future” with a five-point Likert scale from 1 (strongly disagree) to 5 (strongly agree). The scores ranged from 2 to 10 and higher scores indicated a higher usage intention (Table 1). The Cronbach’s α coefficient was 0.90 in its development20 and 0.85 in this study.
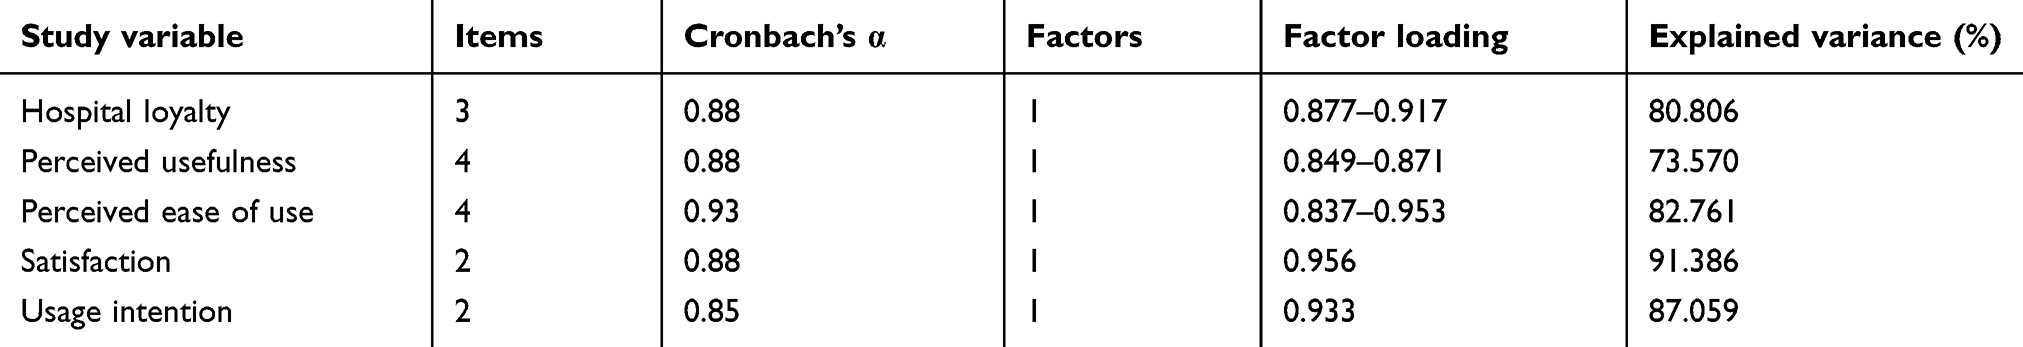 |
Table 1 Cronbach’s α, factor loadings, and explained variance of the study variables |
Data analysis
SPSS version 20.0 was used for the descriptive analysis of the sociodemographic data. Structural equation modeling (SEM) was conducted using AMOS version 5.0 to test the 10 proposed hypotheses to assess the relationships between the hospital loyalty, PU of the mobile app, its PEOU, satisfaction with its use, and usage intention.
A two-step approach was used to test the proposed hypotheses. First, a measurement model was examined to assess how well the observed measures reflect the latent constructs. Second, the hypothesized SEM was tested to examine the relationships among constructs. The aim of the analysis was to evaluate whether the hypothesized model fit the data well based on goodness-of-fit indices: root mean square error of approximation (RMSEA), standardized root mean residual (SRMR), Tucker-Lewis index (TLI), and comparative fit index (CFI). The value of RMSEA and SRMR should be smaller than 0.08, TLI should be more than 0.90, and CFI should be more than 0.95 to be considered good fit.46,47
Results
The sociodemographic data of participants
The participants’ (N=125) average age was 32.19 (SD =7.64) years and 72% (N=90) were single. The average BMI was 21.45 (SD =3.51). Concerning educational level, 58.4% were university graduates (N=73). Regarding marital status, 72.0% were single (N=90). In terms of work duration or school duration, 79.2% (N=99) had a fixed time. Of the women, 58.4% (N=73) had obstetric and gynecological diagnoses. Additionally, 80.8% (N=101) women had pregnancy experience and 87.2% (N=109) had childbirthing experience. The characteristics of the study participants are shown in Table 2.
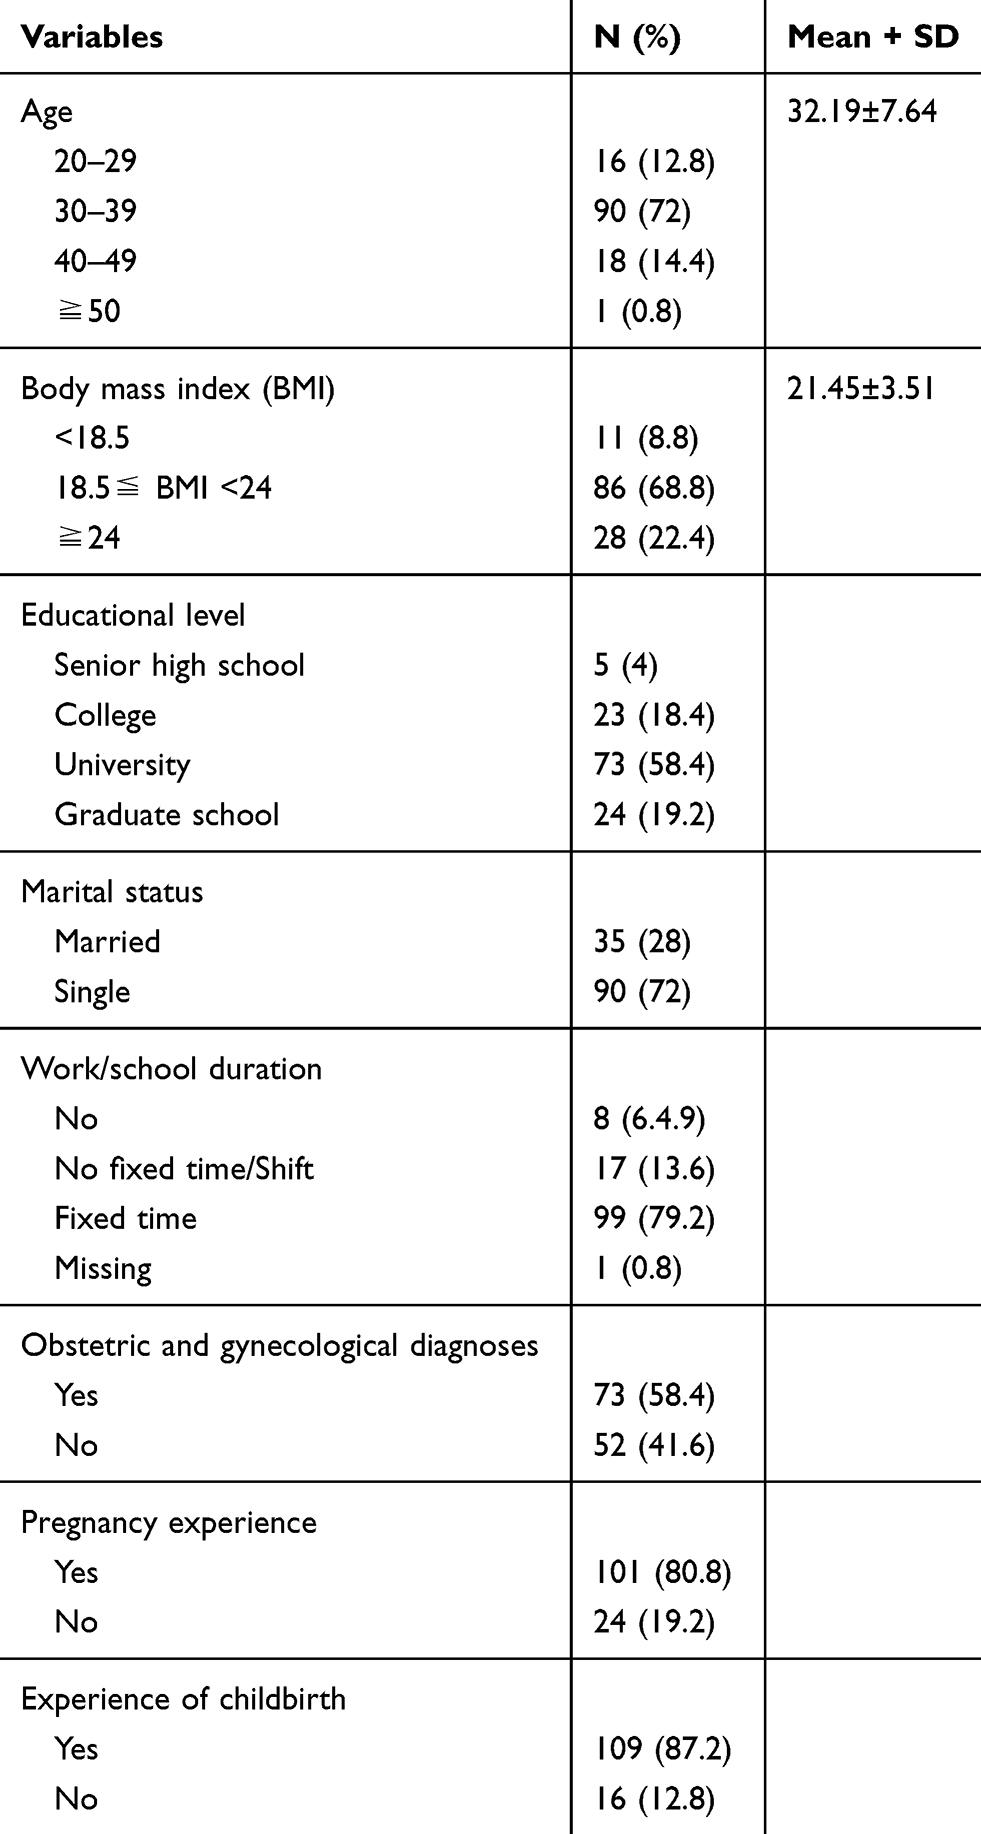 |
Table 2 Demographic characteristics |
Measurement model within the latent variables
Testing the measurement model involved estimating each item according to its hypothesized latent variable. A confirmatory factor analysis was conducted to test the factor structure of the 15-item scale. Any factor loading above 0.50 was considered significant.48 All the measured variables were significantly loaded on the latent variables, with factor loadings ranging from 0.71 to 0.97, with all P-values<0.001, indicating that the latent variables were adequately measured by their respective measurements (Figure 3).
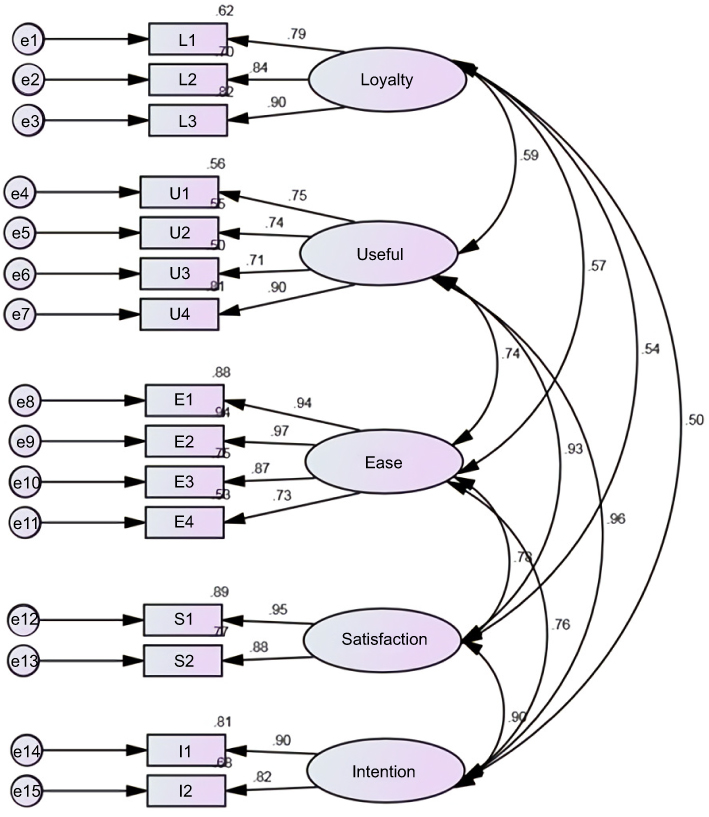 |
Figure 3 Measurement model composed of five latent variables tested through confirmatory factor analysis. All the correlations were statistically significant. Note: L1–L3= items of hospital loyalty; U1–U4= items of perceived usefulness of the mobile app; E1–E4= items of perceived ease of use of the mobile app; S1–S2= items of Satisfaction with the mobile app use; I1–I2= items of usage intention of the mobile app. |
Structural equation model
The 10 hypotheses were tested using a structural model in this study. The full model shows that 7 of the 10 hypotheses were supported, and H1b, H3a, and H3b were not supported, the model fit with the data (χ2(df =0) =0; CFI =1; RMSEA =0.583; SRMR =<0.001; TLI =0). To find the model with maximum parsimony, unsupported parameters were deleted from the full model. The parsimony model showed that the model fit was acceptable for the data (χ2(df =3) =0.816; CFI =1; RMSEA =<0.001; SRMR =0.013; TLI =1.004), accounting for 70% of the variance of usage intention of the mobile app.
Within the parsimony model, H1a and H1c were supported. PU of the mobile app (H1a) had a direct effect on its usage intention (β=0.40, P<0.05). PEOU of the mobile app (H1c) had a direct effect on its PU (β=0.63, P<0.05).
Within the parsimony model, H2a, H2b, and H2c were supported. Satisfaction with the mobile app use (H2a) had a direct effect on its usage intention (β=0.49, P<0.05). PU of the mobile app (H2b) had an indirect effect on its usage intention through satisfaction with the mobile app use (β=0.49, P<0.05). PEOU of the mobile app (H2c) had an indirect effect on its usage intention through satisfaction with the mobile app use (β=0.40, P<0.05).
Within the parsimony model, H3c and H3d were supported. Hospital loyalty (H3c) had an indirect effect on usage intention of the mobile app through its PU to affect satisfaction with the mobile app use (β=0.17, P<0.05). Hospital loyalty (H3d) had an indirect effect on usage intention of the mobile app through its PEOU to affect satisfaction with the mobile app use (β=0.53, P<0.05) (Tables 3 and 4). A breakdown of all indirect and total effects on usage intention of the mobile app for each of the latent variables is depicted in Table 4. SEM analysis of the research model is shown in Figure 4.
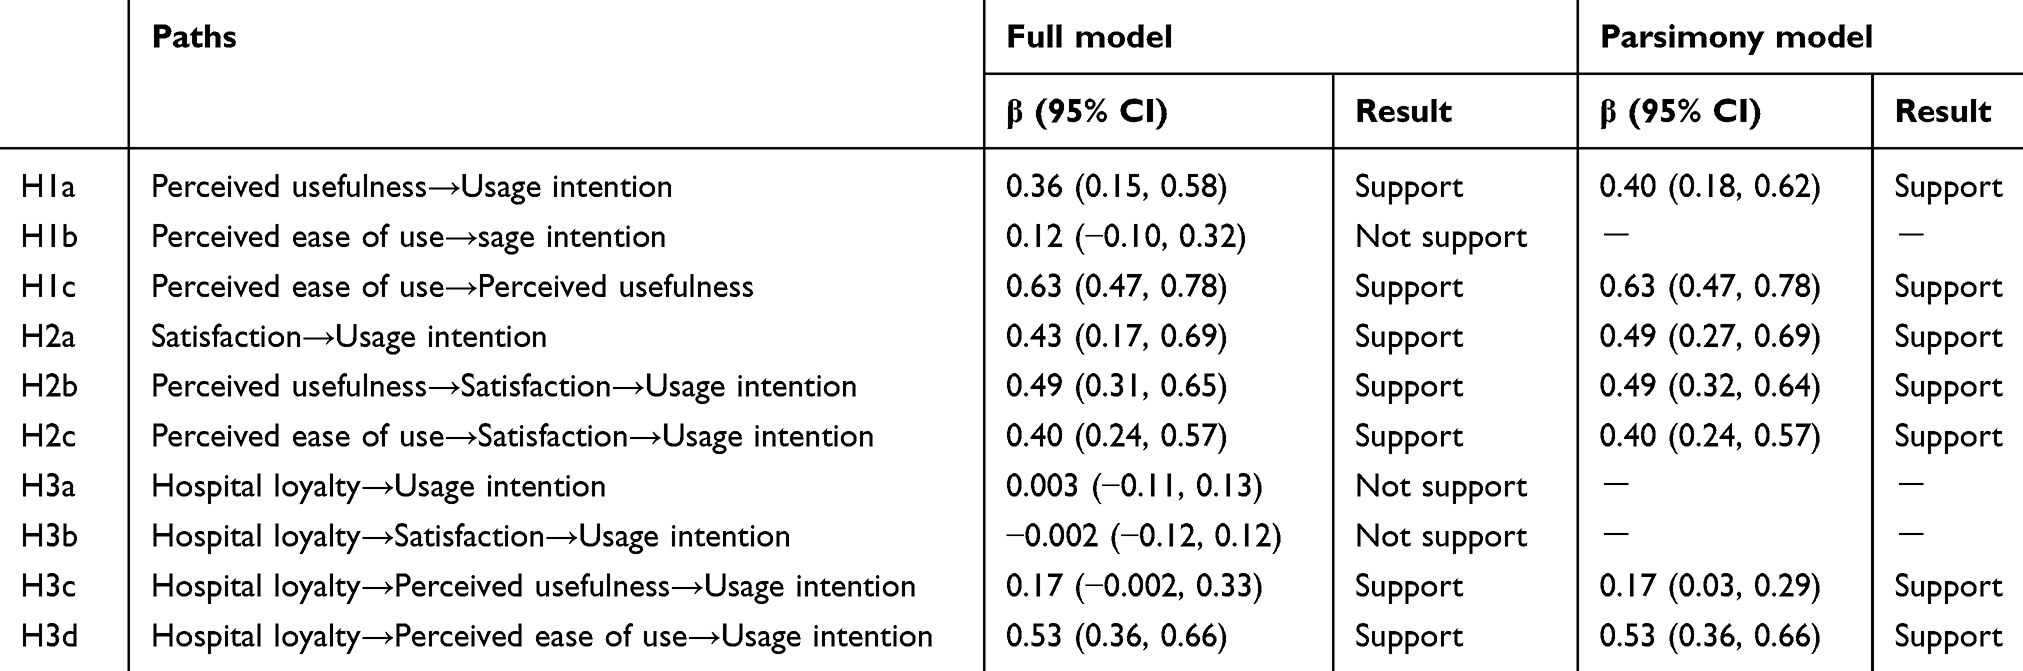 |
Table 3 Standardized path coefficients for the full and parsimony models |
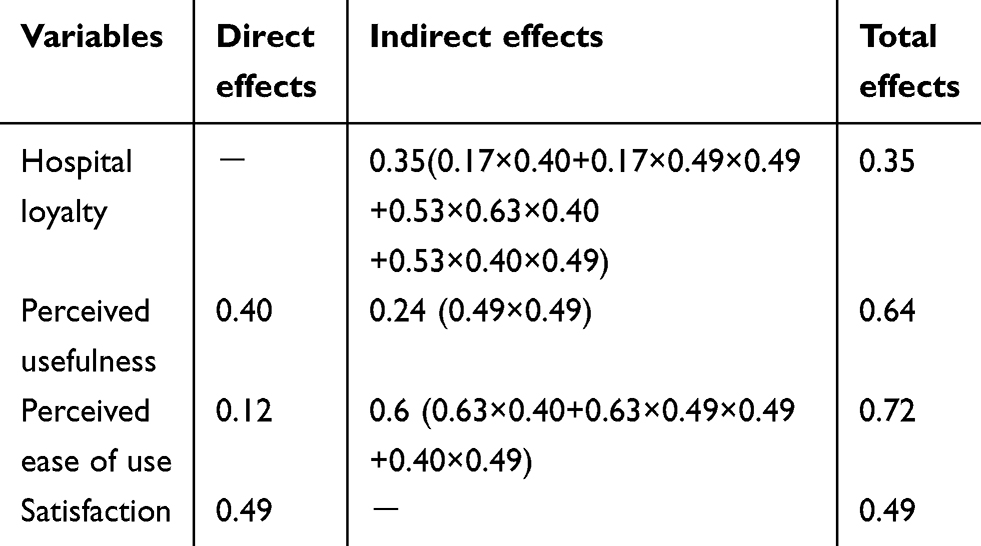 |
Table 4 Standardized direct and indirect effects on usage intention of mobile app (parsimony model) |
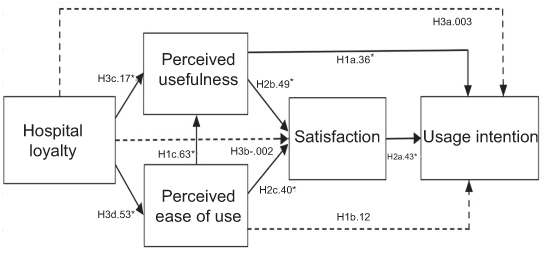 |
Figure 4 Structural equation modeling analysis of the research model (full model). The dotted line represents a nonsignificant relationship. *p<0.05. |
Discussion
In this study, the final model of the SEM showed that the predictors identified, including hospital loyalty, PU of the mobile app, its PEOU, and satisfaction with its use explained 70% variance in usage intention of the mobile app. Many studies have explored the effectiveness of app-based interventions,49,50 but there is a need to explore usage intention during the development of such apps. Unlike past research, this study used hospital loyalty to explore the effect on usage intention. Patients’ continuation of use of the extended services that are provided by the hospital is related to their perceptions of the hospital’s reputation, which can be represented as the hospital brand, as well as with their satisfaction with the services.51 In the healthcare context, hospital brand is a comprehensive representation of product characteristics, and represents the guarantee of quality and value, forming a basis for repeated use of a service.52 Brand loyalty to the hospital reflects the trust and dependence on the hospital, and so the brand is influential.51 Hospital loyalty stems from the perception of the services provided by the hospital, which affects the patients’ intention to continue using the service. The findings of this study revealed that women’s hospital loyalty does not directly affect the usage intention of the mobile app, but indirect affect it through PU and PEOU of the mobile app to affect satisfaction with the mobile app use.
TAM focuses on the acceptance of technology; this study not only emphasizes the acceptance of technology, but also focuses on its usage intention in the future. We found that satisfaction serves as mediator between the hospital loyalty and usage intention. This result is consistent with the finding of a study related to service quality, patient satisfaction and loyalty.28 The author (2011) found the mediating effect of satisfaction in the relationship between brand image and re-visit intention.28 In addition, hospital loyalty, PU of the mobile app, and its PEOU had a significant positive influence on usage intention of the mobile app through satisfaction with its use. It can be seen that the satisfaction with the extended service is a key factor affecting the usage intention. As the satisfaction with a service will affect subsequent behavior,53 higher satisfaction with an extended service for women who are outpatients, will lead to better behavioral adherence and health outcomes.23 Therefore, to increase the patients’ continuous usage intention of the services, increasing their satisfaction with the service is necessary. However, users’ satisfaction develops from the overall experience of mobile apps, which should be measured using several aspects like service function, quality, and effectiveness. In this regard, mobile apps should involve efficient quality control in the stages of app design, development, and promotion to constantly improve user satisfaction.
In line with other studies,13,15 we found that the PU of mobile apps had direct and indirect effects on their usage intention, but inconsistent with other studies,20,21 PEOU had only indirect effects on the usage intention. This may be because participants who are habituated to using smartphones in their daily lives, are familiar with the operation of mobile-related apps, and most of them can accept the assistance of technology. Regarding the total effect, PU and PEOU are strong predictors of usage intention of mobile apps. According to this finding, the applicability of TAM is shown to be supported. In addition, TAM will influence the usage intention through satisfaction. Meanwhile, the system quality and service quality play a critical role in users’ experiences. Apparently, apps with stable performance, friendly interfaces, convenient operation, and functional completeness will attract more users.
There are some limitations in this study. First, the user testing was done on a small number of smartphone devices; the app is currently only available as a mobile application on Android and iOS devices, and we recognize that the functionality of the application may vary depending on the smartphone device and operating system version. Testing of mobile phones with different operating systems will be added in the future. Second, it was a cross-sectional investigation and so conclusions about causal effects linking hospital loyalty, PU of mobile apps, its PEOU, and satisfaction with its use to its usage intention need to be caution. More precise research, such as a longitudinal study, is needed.
Implications for practice and further research
The app is an extension of the healthcare organization. By using the app, the patient’s engagement in self-care can be enhanced. According to the results of this study, usefulness is more important than ease of use, so in the design of an app, the designer should understand the patient’s needs and then design an app that meets those needs and that the patient thinks is useful. Patient satisfaction is an important element of service quality for healthcare organizations. With the convenience of advanced technology, healthcare organizations began to design various digital services to enhance patients’ experience and satisfaction. Previous research has revealed an association between patient loyalty and satisfaction.28 Unlike marketing research,38 the effects of hospital loyalty on digital services have not been fully investigated. Our findings have provided a preliminary explanation of loyalty effects. Needs for further study have emerged to enhance the understanding of how loyalty affects patients.
Conclusions
This study applied TAM to evaluate the intention of using mobile app for behavioral adherence by women receiving traditional Chinese medicine treatment for menstrual symptoms. The results support the TAM, showing that women’s app usage intention is mainly related to their experience of its use. Women’s hospital loyalty does not directly affect their usage intention of the app, but indirectly through its PU and PEOU to affect the usage intention of mobile apps.
Ethics approval and informed consent
The study protocol was approved by the institutional review boards of Taipei City Hospital Institutional Review Board (IRB approval no. TCHIRB-1030905). All the participants signed informed consent before participating in the study. The date of approval by the Institutional Review Board was December 22, 2014.
Acknowledgments
We would like to express our gratitude to the patients and the care units that participated in this study. This work was supported by a grant from the Ministry of Science and Technology, Taiwan (103-2314-B010-033-MY2).
Author contributions
All authors contributed to data analysis, drafting and revising the article, gave final approval of the version to be published, and agree to be accountable for all aspects of the work.
Disclosure
The authors report no conflicts of interest in this work.
References
1. CK, Huang YP, Fang HL, Huang YY. Dysmenorrhea: a study of affected factors and approaches to relief among female students at a college in southern Taiwan. The Journal of Nursing. 2013;60(3):40-50. doi: 10.6224/JN.60.3.40
2. Hao Y, Jiang J, Gu X. Traditional Chinese medicine and nursing care. Int J Nurs Sci. 2017;4(3):1–4. doi:10.1016/j.ijnss.2017.06.005
3. Reynolds A. Patient-centered care. Radiol Technol. 2009;81(2):133–147.
4. Guo JL, Ku HYT, Yang FC, Hsu HP, Lin YH, Huang CM. Patterns of treatment expectation and the physician-patient relationship perceived by women receiving traditional Chinese medicine treatment for menstrual symptoms: a Q-methodology study. Scand J Caring Sci. 2017;31:748–758. doi:10.1111/scs.12394
5. Dentzer S. Rx for the ‘blockbuster drug’ of patient engagement. Health Aff. 2013;32(2):202. doi:10.1377/hlthaff.2013.0037
6. Graffigna G, Barello S, Riva G. How to make health information technology effective: the challenge of patient engagement. Arch Phys Med Rehabil. 2013;94(10):2034–2035. doi:10.1016/j.apmr.2013.04.024
7. Bateman EH, Keefe DMK. How can ehealth enhance adherence to cancer therapy and supportive care. Srp Arh Celok Lek. 2016;144(1–2):116–121.
8. Aldeer M, Javanmard M, Martin RP. A review of medication adherence monitoring technologies. Appl Syst Innovation. 2018;1(14):3–27. doi:10.3390/asi1020014
9. Ball MJ, Lillis J. E-health: transforming the physician/patient relationship. Int J Med Inform. 2001;61(1):1–10.
10. Omole O, Ijadunola M, Olotu E, et al. The effect of mobile phone short message service on maternal health in south‐west Nigeria. Int J Health Plann Manage. 2018;33(1):155–170. doi:10.1002/hpm.2404
11. Athilingam P, Jenkins BA, Zumpano H, Labrador MA. Mobile technology to improve heart failure outcomes: aproof of concept paper. Appl Nurs Res. 2018;39:26–33. doi:10.1016/j.apnr.2017.10.018
12. Bonner A, Gillespie K, Campbell KL, et al. Evaluating the prevalence and opportunity for technology use in chronic kidney disease patients: a cross-sectional study. Biomed Nephrol. 2018;19(1):2–8.
13. Davis FD. Perceived usefulness, perceived ease of use, and user acceptance of information technology. Manage Inf Syst Q. 1989;13(3):319–340. doi:10.2307/249008
14. Teo T, Noyes J. An assessment of the influence of perceived enjoyment and attitude on the intention to use technology among pre-service teachers: a structural equation modelling approach. Comput Technol. 2011;57(2):1645–1653.
15. Wong KT, Osman R, Goh PSC, Rahmat MK. Understanding student teachers’ behavioural intention to use technology: technology acceptance model (TAM) validation and testing. Int J Instruction. 2013;6(1):89–104.
16. Teo T. The impact of subjective norm and facilitating conditions on pre-service teachers’ attitude toward computer use: a structural equation modelling of an extended technology acceptance model. J Educ Comput Res. 2009;40:89–109. doi:10.2190/EC.40.1.d
17. Semple JL, Sharpe S, Murnaghan ML, Theodoropoulos J, Metcalfe KA. Using a mobile app for monitoring post-operative quality of recovery of patients at home: a feasibility study. J Med Internet ResmHealth uHealth. 2015;3(1):e18. doi:10.2196/mhealth.3929
18. Gorst SL, Armitage CJ, Brownsell S, Hawley MS. Home telehealth uptake and continued use among heart failure and chronic obstructive pulmonary disease patients: a systematic review. Ann Behav Med. 2014;48(3):323–336. doi:10.1007/s12160-014-9607-x
19. Holtz B, Lauckner C. Diabetes management via mobile phones: a systematic review. Telemed e-Health. 2012;18(3):175–184. doi:10.1089/tmj.2011.0119
20. Chuo YH, Tsai CH, Lan YL, Tsai CS. The effect of organizational support, self efficacy, and computer anxiety on the usage intention of e-learning system in hospital. Afr J Bus Manage. 2011;5(14):5518–5523.
21. Wang YS, Lin HH, Luarn P. Predicting consumer intention to use mobile service. Inf Syst J. 2006;16:157–179. doi:10.1111/j.1365-2575.2006.00213.x
22. Baird K. Raising the Bar on Service Excellence. Archieboy Holdings. USA: LLC; 2013.
23. Guldvog B. Can patient satisfaction improve health among patients with angina pectoris. Int J Qual Health Care. 1999;11(3):233–240. doi:10.1093/intqhc/11.3.233
24. Szymanski DM, Hise RT. E-satisfaction: an initial examination. J Retailing. 2000;76(3):309–322. doi:10.1016/S0022-4359(00)00035-X
25. Zhao Y, Deng S, Zhou R. Understanding mobile library Apps continuance usage in China: a theoretical framework and empirical study. Int J Libraries Inf Stud. 2015;65(3):161–173.
26. Pindeha N, Sukia NM, Sukib NM. User acceptance on mobile apps as an effective medium to learn Kadazandusun language. Procedia Econ Finance. 2016;37:372–378. doi:10.1016/S2212-5671(16)30139-3
27. Zhao L, Lu Y, Zhang L, Chau PYK. Assessing the effects of service quality and justice on customer satisfaction and the continuance intention of mobile value-added services: an empirical test of a multidimensional model. Decis Support Syst. 2012;52(3):645–656. doi:10.1016/j.dss.2011.10.022
28. Wu CC. The impact of hospital brand image on service quality, patient satisfaction and loyalty. Afr J Bus Manage. 2011;15(12):4873–4882.
29. Adamson I, Shine J. Extending the new technology acceptance model to measure the end user information systems satisfaction in a mandatory environment: a bank’s treasury. Technol Anal Strategic Manage. 2003;15(4):441–455. doi:10.1080/095373203000136033
30. Piriyakul M, Piriyakul R, Chuachareon O, Boonyoung M, Piriyakul P, Piriyakul I. Effects of trust, satisfaction and factors corresponding to TAM on intention to reuse internet business transaction. Int Rev Manage Bus Res. 2015;4(3):872–890.
31. Chen YY, Huang HL, Hsu YC, Tseng HC, Lee YC. Confirmation of expectations and satisfaction with the internet shopping: the role of internet self-efficacy. Comput Inf Sci. 2010;3(3):14–22. doi:10.5539/cis.v3n3p14
32. Devaraj S, Fan M, Kohli R. Antecedents of B2C channel satisfaction and preference: validating e-commerce metrics. Inf Syst Res. 2002;13:316–333. doi:10.1287/isre.13.3.316.77
33. Kim JY, Lee HS. Key factors influencing customer satisfaction in Korea’s mobile service sector. J Internet Banking Commerce. 2013;18(3):1–13.
34. Astuti HJ, Nagase K. Patient loyalty to healthcare organizations: relationship marketing and satisfaction. Int J Manage Marketing Res. 2014;7(2):39–56.
35. Dick AS, Basu K. Customer loyalty: toward an integrated conceptual framework. J Acad Marketing Sci. 1994;22(2):99–113. doi:10.1177/0092070394222001
36. Salgaonkar PB. Marketing of Healthcare Services. Delhi, India: Abhijeet Publications; 2006.
37. Jones MA, Mothersbaugh DL, Beatty SE. Why customers stay: measuring the underlying dimensions of services switching costs and managing their differential strategic outcomes. J Bus Res. 2002;55(6):441–450. doi:10.1016/S0148-2963(00)00168-5
38. Corstjens M, Lal R. Building store loyalty through store brands. J Marketing Res. 2000;37(3):281–292. doi:10.1509/jmkr.37.3.281.18781
39. Gorsuch R. Factor Analysis. Hillsdale, NJ: L. Erlbaum Associates; 1983.
40. Everitt BS. Multivariate analysis: the need for data, and other problems. Br J Psychiatry. 1975;126:237–240.
41. MacCallum RC, Widaman KF, Zhang S, Hong S. Sample size in factor analysis. Psychol Methods. 1999;4:84–99. doi:10.1037/1082-989X.4.1.84
42. Gremler DD, Brown WW. Service loyalty: Its nature, importance and implications. In: Edvardsson B, Brown SW, Johnston R, Scheuing EE, editors. Advancing Service Quality: A Global Perspective, International Service Quality Association. Jamaica: New York; 1996:171–180.
43. MacStravic RS. Loyalty of hospital patients: a vital marketing objective. Health Care Manage Rev. 1987;12(2):23–30.
44. Oliver RL, Swan JE. Consumer perceptions of international equity and satisfaction in transactions: a field survey approach. J Mark. 1989;53:21–35. doi:10.1177/002224298905300202
45. Al-hawari MA, Mouakket S. Do offline factors trigger customers’ appetite for online continual usage? A study of online reservation in the airline industry. Asia Pac J Marketing Logist. 2012;24(4):640–657. doi:10.1108/13555851211259061
46. Hu LT, Bentler PM. Fit indices in covariance structure modeling: sensitivity to under parameterized model misspecification. Psychol Methods. 1998;3:424–453. doi:10.1037/1082-989X.3.4.424
47. Kline RB. Principles and Practice of Structural Equation Modeling.
48. Hair JF. Multivariate Data Analysis: A Global Perspective. Upper Saddle River, NJ: Person Prentice Hall; 2010.
49. Mattila E, Orsama AL, Ahtinen A, Hopsu L, Leino T, Korhonen I. Personal health technologies in employee health promotion: usage activity, usefulness, and health-related outcomes in a 1-year randomized controlled trial. JMIR Mhealth Uhealth. 2013;1(2):e16. doi:10.2196/mhealth.2557
50. Quinn CC, Shardell MD, Terrin ML, Barr EA, Ballew SH, Gruber-Baldini AL. Cluster-randomized trial of a mobile phone personalized behavioral intervention for blood glucose control. Diabetes Care. 2011;34(9):1934–1942. doi:10.2337/dc11-0366
51. Aggarwal P, Janssens B Power to the patient: a new growth paradigm for Indian providers; 2014. Available from: https://www.bcg.com/publications/2014/health-care-payers-providers-power-to-the-patient.aspx.
52. Chaudhuri A, Holbrook MB. The chain of effects from brand trust and brand affect to brand performance: the role of brand loyalty. J Mark. 2001;65(2):81–93. doi:10.1509/jmkg.65.2.81.18255
53. Kotler P. Manajemen Pemasaran. Edisi Milenium, Jakarta: Prenhallindo; 2009.
Supplementary material
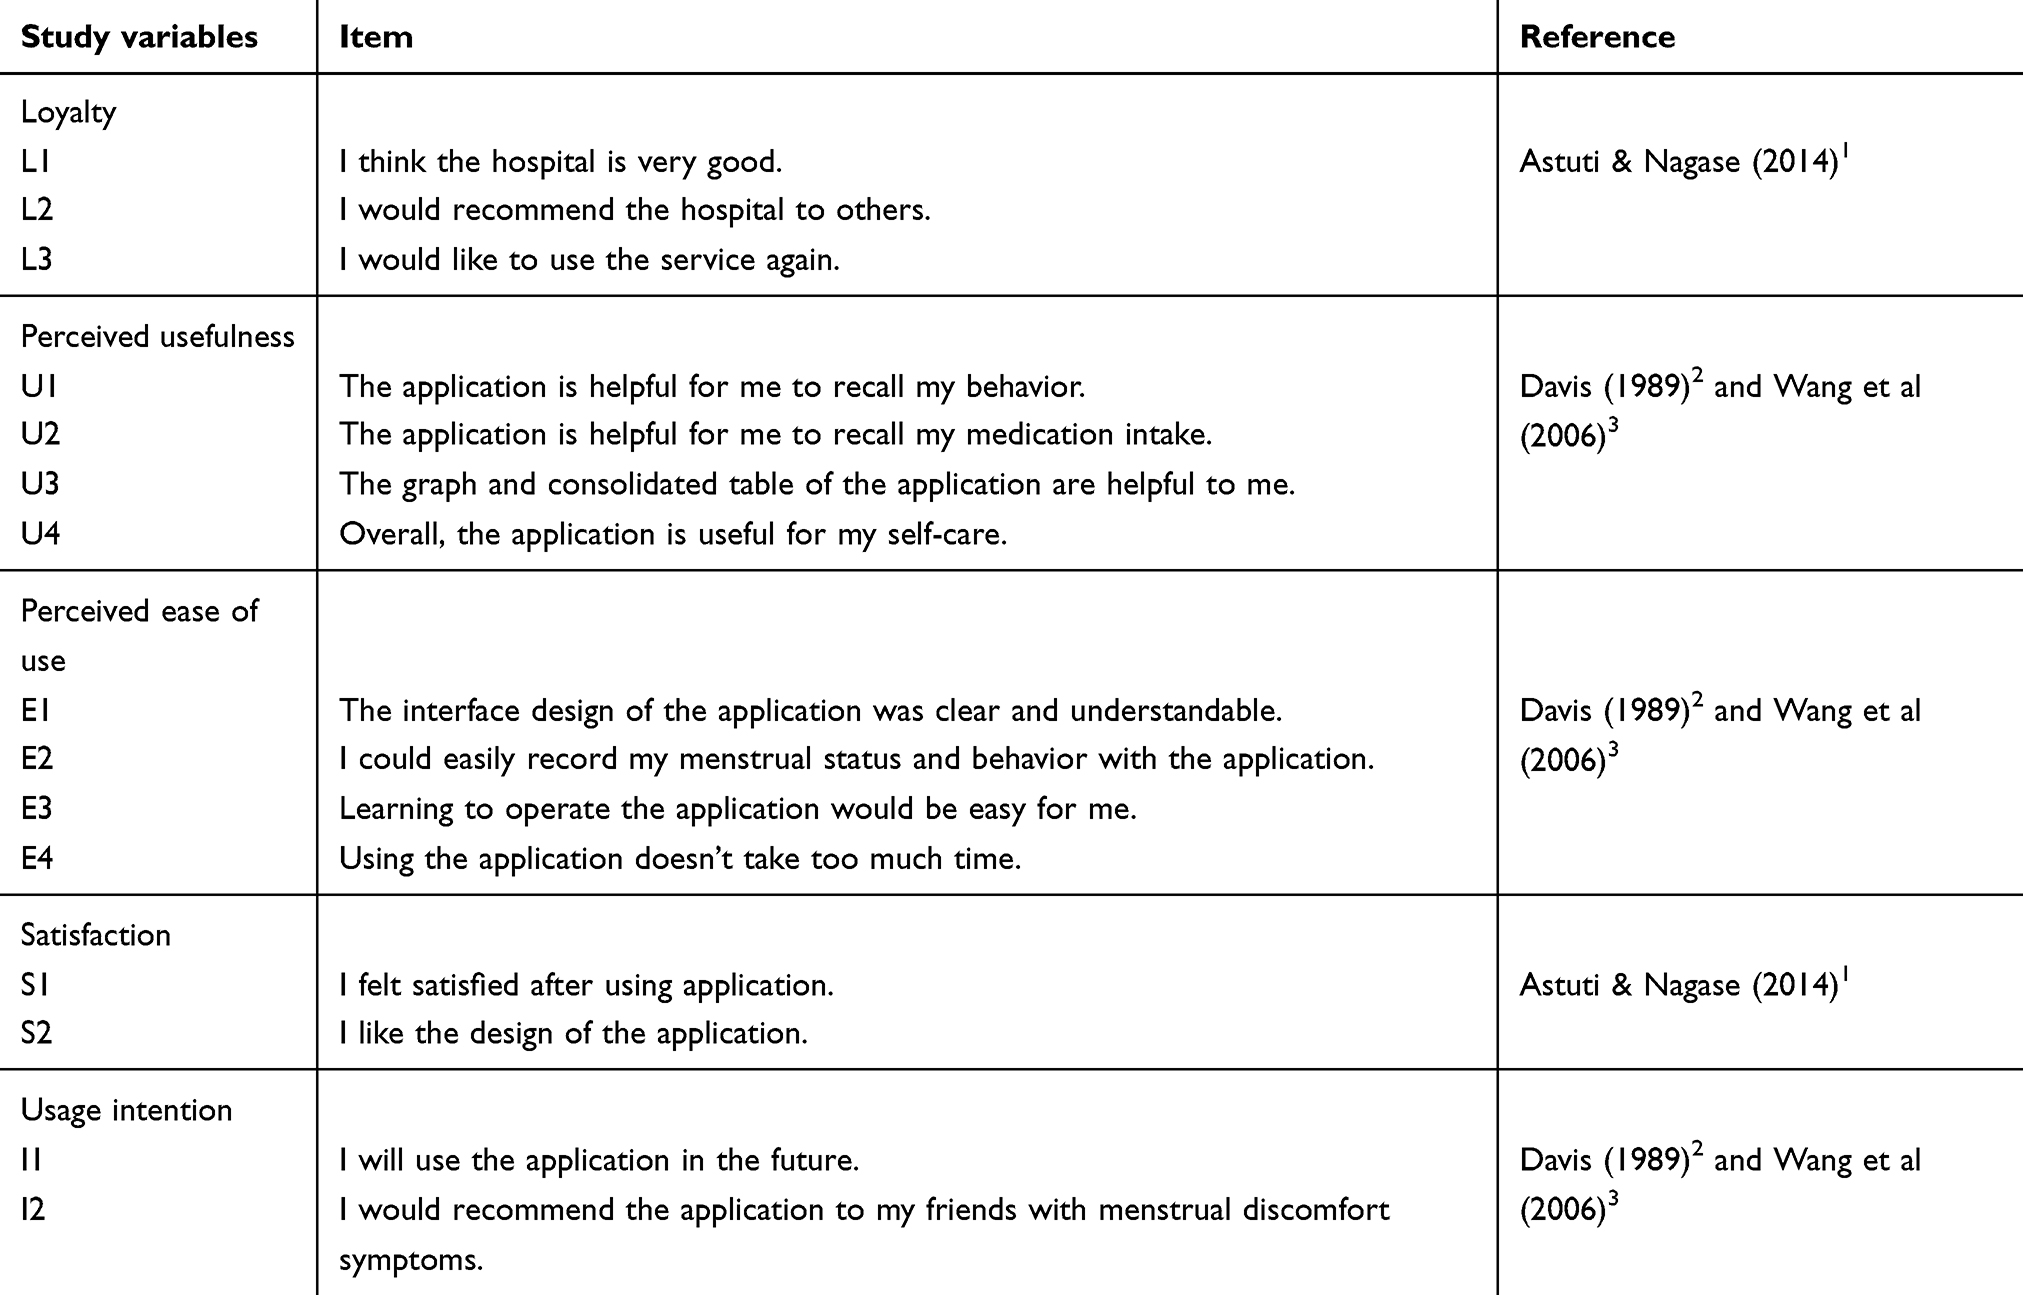 |
Table S1 Study variables and corresponding items |
References
1. Astuti HJ, Nagase K. Patient loyalty to healthcare organizations: relationship marketing and satisfaction. Int J Manage Marketing Res. 2014;7(2):39–56.
2. Davis FD. Perceived usefulness, perceived ease of use, and user acceptance of information technology. Manage Inf Syst Q. 1989;13(3):319–340. doi:10.2307/249008
3. Wang YS, Lin HH, Luarn P. Predicting consumer intention to use mobile service. Inf Syst J. 2006;16:157–179. doi:10.1111/j.1365-2575.2006.00213.x
 © 2019 The Author(s). This work is published and licensed by Dove Medical Press Limited. The
full terms of this license are available at https://www.dovepress.com/terms
and incorporate the Creative Commons Attribution
- Non Commercial (unported, 3.0) License.
By accessing the work you hereby accept the Terms. Non-commercial uses of the work are permitted
without any further permission from Dove Medical Press Limited, provided the work is properly
attributed. For permission for commercial use of this work, please see paragraphs 4.2 and 5 of our Terms.
© 2019 The Author(s). This work is published and licensed by Dove Medical Press Limited. The
full terms of this license are available at https://www.dovepress.com/terms
and incorporate the Creative Commons Attribution
- Non Commercial (unported, 3.0) License.
By accessing the work you hereby accept the Terms. Non-commercial uses of the work are permitted
without any further permission from Dove Medical Press Limited, provided the work is properly
attributed. For permission for commercial use of this work, please see paragraphs 4.2 and 5 of our Terms.