Back to Journals » Risk Management and Healthcare Policy » Volume 15
Does Geographic Location Affect the Quality of Care? The Difference in Readmission Rates Between the Border and Non-Border Hospitals in Texas
Authors Shin DY, Chang J, Ramamonjiarivelo ZH, Medina M ![]()
Received 14 January 2022
Accepted for publication 24 April 2022
Published 12 May 2022 Volume 2022:15 Pages 1011—1023
DOI https://doi.org/10.2147/RMHP.S356827
Checked for plagiarism Yes
Review by Single anonymous peer review
Peer reviewer comments 3
Editor who approved publication: Professor Mecit Can Emre Simsekler
Dong Yeong Shin,1 Jongwha Chang,2 Zo H Ramamonjiarivelo,3 Mar Medina4
1Department of Public Health Sciences, New Mexico State University, Las Cruces, NM, USA; 2Department of Healthcare Administration, College of Business, Texas Woman’s University, Denton, TX, USA; 3School of Health Administration, Texas State University, San Marcos, TX, USA; 4School of Pharmacy, University of Texas at El Paso, El Paso, TX, USA
Correspondence: Jongwha Chang, Healthcare Administration, College of Business, Texas Woman’s University, 304 Administration Dr., Denton, TX, 76204, USA, Email [email protected]
Purpose: Previous literature has limited empirical evidence describing the association between border location and readmission rates among hospitals in the U.S.-Mexico border region. Thus, our study explores this novel connection in Texas border hospitals using a non-experimental longitudinal study design.
Materials and Methods: Using longitudinal panel data (2013∼ 2016) drawn from the American Hospital Association Annual Survey Database, Hospital Compare, and Area Health Resource File, a random-effects linear regression analysis was performed to quantify the impact of border location on the readmission rates of the same sample at multiple timed points.
Results: We found a positive relationship between border location and 30-day hospital readmission rates for heart failure and pneumonia in Texas. Border hospitals in Texas had approximately a 4.17% higher heart failure readmission rate and a 3.46% higher pneumonia readmission rate than non-border hospitals. We also identified several hospital organizational and market factors associated (eg, registered nurse [RN]-to-patient ratio) with hospital readmission rates.
Conclusion: The results suggest that improving RN staffing levels can be the most feasible action to lower the readmission rates among border Texas hospitals. Decreasing readmission rates by increasing RN staffing levels would also help them avoid reimbursement reduction under the Hospital Readmission Reduction Program (HRRP) and enhance overall health in Texas border communities. Further, to improve border health in Texas, decision-makers in state and local governments must consider incentivizing border hospitals to improve RN staffing levels and modulating the market factors affecting hospital readmission rates that are mostly beyond the control of hospitals.
Keywords: U.S.-Mexico border, hospital, quality of care, readmission, registered nurse, nurse staffing, hospital characteristics, Hispanic population, county, market factors
Background
Limited healthcare access is associated with various adverse health outcomes, including premature mortalities1 and increased risks for common chronic conditions.2,3 Considering that patients with more than one comorbidity have increased healthcare costs up to seven times that of patients with one chronic condition,4 the limited access to care has severe implications on healthcare costs. To improve health in the US population and control US healthcare costs, it is essential to understand the barriers that disproportionately affect patients with comorbidities and their ongoing care, especially amongst populations at a higher risk for comorbidities.
Patient location may impact their access to healthcare. Holding other factors constant, long distances to healthcare providers discourage people from utilizing health services because of increased time and transportation costs.5,6 Rural residents who live far from healthcare providers experience disproportionately more significant travel burdens to providers’ facilities than urban residents in the U.S.7–9
The rural-urban discrepancy in geographic access to healthcare has specific ramifications in the U.S.-Mexico border region. For example, 33 of the 44 counties located in the border region are designated as non-core or micropolitan counties by the Office of Management and Budget.10 According to the US Department of Health & Human Services (HHS), the border region is also medically underserved;11 its population faces health and socioeconomic challenges, such as limited access to healthcare, high uninsured rates, and disparities in health conditions,11 to name a few.
The geographic proximity to and lower healthcare costs in Mexico attracts millions of uninsured US residents12 to Mexican health services as a supplement to or as the primary source of healthcare services. Previous research like Bastida et al13 demonstrated that uninsured Texas border residents were up to 7 times more likely than those insured to use health services in Mexico. The authors13 further highlighted that the continued healthcare utilization disparities along the U.S.-Mexico border would be heightened by a lack of policies to improve healthcare accessibility in the region.
Adding to the health disparities felt on the border, Su et al14 demonstrated that dissatisfaction with the quality of US health services is a statistically significant predictor for Texas border residents to instead utilize Mexican healthcare services. The Agency for Healthcare Research and Quality (AHRQ) in 2014 reported that Texas had an overall quality score far below the median and was ranked 49th out of the 50 States and the District of Columbia.15 Regarding the quality of care received by the Hispanic population, Texas was ranked last in the US, while the three other border states were close to the median.15 The limited access to care, health disparities, and questionable quality of care received in some U.S.-Mexico border areas raises concerns about the quality of care provided by Texas hospitals in the border region. To our knowledge, no empirical evidence exists in the literature to remedy such potential issues.
Our study stemmed from a research question, “Do U.S.-Mexico border and non-border hospitals in Texas differ in quality of care?” To answer this question, this study examines the relationship between Texas hospitals’ border locations and their quality of care, measured by heart failure (HF) and pneumonia (PN) readmission rates. To explore this relationship, the study employs a random-effects linear regression model using longitudinal panel data between 2013 and 2016. We expect that our empirical evidence will fill the literature gap on the relationship between border location and quality of care in hospitals. Our findings will benefit hospital leaders trying to understand what affects their quality of care, how to succeed under the Hospital Readmission Reduction Program (HRRP), and how to better serve their communities. A better understanding of the factors that explain the variation in the quality of care in hospitals will also allow decision-makers in state and local governments to improve border health by implementing policies that support border hospitals.
Methods
Data Sources
This is a non-experimental, longitudinal study based on secondary data analysis with unique identifiers (eg, Medicare provider number). We utilized longitudinal panel datasets between 2013 and 2016, drawn from the American Hospital Association (AHA) Annual Survey Databases, the Area Health Resource File (AHRF) of the US Department of Health and Human Services (HHS), the Hospital Compare (HC) and the Case Mix Index (CMI) files from the Centers for Medicare & Medicaid Services (CMS), and the Rural-Urban Commuting Area (RUCA) codes from the US Department of Agriculture (USDA). Texas hospitals’ border locations were identified using the information provided by the Texas Department of Health and Human Services (DSHS).16
The AHA Annual Survey database contains data regarding hospitals’ organizational characteristics, utilization, staffing, and so forth. The AHRF database provides county-level data regarding healthcare resources, health status, population information, and more. The CMS HC database contains hospital performance data, such as indicators of quality of care. Previous studies have utilized the AHA, HC, and AHRF datasets to study hospitals’ readmission rates.17–19 The CMS CMI files contain CMIs for hospital discharges representing the hospitals’ average diagnosis-related group (DRG) relative weights. The RUCA codes use measures of population density, urbanization, and daily commuting to classify US census tracts. As conducted by a recent study,20 we used the CMI files and the RUCA codes to measure the severity of patients’ illnesses treated by hospitals and the urban/rural location of hospitals, respectively. For checking statistical model, we ran a correlation test and confirmed no correlation over a typical threshold (0.8) for variables. (Supplementary Files) Also, when we check imputations for missing CMI cases, we conducted regression analysis with multiple imputations for missing CMI cases and without them. Without the imputations, we also found the same result in terms of positive relationship between the independent variables and HF and PN readmission rates (Supplementary Files).
This study’s unit of analysis is hospital-year. The sampling frame consisted of all non-federal, general, and acute care hospitals that operated in Texas from 2013 to 2016. After merging the datasets, our final sample included 339, 320, 341, and 335 hospitals for the years 2013, 2014, 2015, and 2016, respectively. Accordingly, the panel dataset consisted of 1,335 hospital-year observations for analysis. All data accessed were compiled with relevant data protection and privacy regulation.
Variables
Previous studies have considered hospital readmission as an important quality measure for hospitals.17,19,21 The outcome of interest and our dependent variables are the quality of care in hospitals, measured with 30-day readmission rates provided by the CMS for HF and PN. The CMS uses well-regarded methods to identify 30-day readmissions.22 This study focused on CMS’s 30-day readmission databases for Medicare beneficiaries 65 years or older and enrolled in the traditional fee-for-service (FFS) Medicare for 12 months before their hospitalization.17 Our dependent variables represent unplanned readmission rates for HF and PN within 30 days of discharge from hospitalization, with lower readmission rates indicating a better quality of hospital care.23 These quality measures have also been adopted by previous studies.17,18,24,25 The dependent variables were transformed into the natural logarithm to normalize data distribution.
The independent variable is the location of the Texas hospital on the U.S.-Mexico border. The Texas DSHS defines the DSHS Border Area as the region within “62 miles of the Rio Grande in the La Paz Agreement of 1986”,16 spanning 32 Texas border counties and Mexico. Based on the Texas DSHS definition,16 this study coded the independent variable as a binary measure where a value of “1” means a border hospital, while a value of “0” indicates a non-border hospital.
To improve hospitals’ readmission rates, a greater understanding of the factors surrounding their variation is essential. Previous studies used hospital18,19,24,26–33 and community characteristics17–19,27–30,32 to explain the variation in hospital readmissions. Our study controlled ten hospital organizational factors and eight market factors for analysis.
To control for the variation of hospital readmission rates as explained by hospital characteristics, this study selected the following organizational control variables that have been adopted by previous readmission studies: ownership status,17–19,27,31,32 hospital size,17–19,27–29,31,32 system affiliation,17,19 teaching hospital status,17–19,28,29,31,32 occupancy rate,17,19 case mix index,30 and nurse staffing.17,19,31,32,34
We included four nursing staffing variables to account for various staffing intensity and skill levels. Many previous hospital readmission studies have used the registered nurse (RN)-to-patient ratio variable as a nurse staffing variable;17,19,31,32,34 therefore, we have included the RN-to-patient ratio. Since a sufficient RN staffing level is essential for hospitals to maintain quality patient care,35 another RN staffing variable that measures the proportion of various RNs (ie, RN skill mix) was included to capture different aspects of RN staffing. Considering that the full-time nursing workforce’s tacit knowledge is important in providing quality patient care services/routines,36 this study adopted an additional RN staffing variable, the full-time RN ratio. Lastly, to control for the impact of the nursing workforce with varied skills, this study included the licensed practical nurse (LPN)-to-patient ratio, which was used to control for RN-to-patient ratio in a previous study,20 as the fourth nurse staffing variable.
The operational definitions of our organizational control variables are as follows: ownership status (private for-profit [reference]; private not-for-profit; public, non-federal), hospital size (the number of staffed beds), teaching hospital status (non-teaching [reference]; teaching), system affiliation (non-system hospital [reference]; system hospital), occupancy rate (total inpatient days divided by the multiplication of hospital size and 365), RN-to-patient ratio (RN full-time equivalents [FTEs] divided by 1000 inpatient days), LPN-to-patient ratio (LPN FTEs divided by 1000 inpatient days), RN skill mix (RN FTEs divided by the FTEs of all nursing workforce), and full-time RN ratio (full-time RN FTEs divided by the sum of full-time and part-time RN FTEs). CMI is computed by summed DRG weights for all Medicare discharges divided by the number of discharges for both transfer-adjusted and unadjusted cases. A higher CMI indicates relatively more complex cases and costly services in a hospital with greater resources.37,38
Herrin et al18 suggest that a considerable level of variation in hospital readmission rates is explained by market factors measured by county characteristics. To control for the impact of market factors, we included market-level control variables adopted by previous readmission studies: per capita income (ie, community income level),17–19,27 urban location,17–19,24,28,29,32 primary care physician resource,17,18 and specialist resource.18,19 We included these variables to control the degree of resource abundance in the markets in which hospitals operate.
We also adopted additional market-level variables used by previous hospital readmission studies: Medicare health maintenance organization (HMO) penetration17,19,32,33 and county unemployment rate.17,19 By utilizing these variables, this study aimed to control for the level of difficulties in predicting the actions of stakeholders (eg, managed care organizations and patients) in the county. If it is difficult for hospital managers to comprehend the actions of market players due to imperfect information and knowledge, such hardship can negatively affect rational decision-making in organizations.39–41
This study also controlled for market concentration, which was used in previous hospital readmission studies.17,19 This study measured market concentration using the Herfindahl-Hirschman index (HHI), aiming to capture the level of complex knowledge needed to understand the market and the competitors in it. If the number of competitors increases, hospitals face increased uncertainty to effectively react to the actions of competitors, preventing them from successfully altering their practices to be profitable or viable.
Lastly, to capture a characteristic of border hospitals, this study used the proportion of the Hispanic population in the area as another market-level control variable. Several hospital readmissions studies25,28,29,42–44 have examined racial/ethnic disparities in hospital readmissions by comparing one reference ethnic group with one or more different ethnic groups. According to Texas DSHS,45 the proportion of the Hispanic population was 88.4% in border counties and 35.5% in non-border counties. To control for racial/ethnic differences, this study adopted the proportion of the Hispanic population as the final control variable. This control variable is expected to be a proper measure for organization-level research like ours to capture the ethnic group’s impact on hospital readmission rates. Table 1 summarizes the study variables, related operational definitions, and data sources.
 |
Table 1 Summary of Variables |
Data Analysis
This study conducted a univariate descriptive analysis, bivariate paired t-tests, and multivariate analysis with a random-effects linear regression model. We measured the descriptive statistics to examine the distributional properties of all variables, including frequencies, means, and standard deviations. Paired t-tests were performed to compare the mean values of the continuous variables between 2013 and 2016.
The main statistical approach of this longitudinal analysis is a random-effects linear regression model used to measure the influence of the border hospital status on the hospital readmission rates. We employed a random-effects model over a fixed-effects model because our independent variable and multiple control variables (eg, ownership) can be characterized as time-invariant factors when the fixed model’s “ruling out” provides no estimation of time-constant effects and poor estimates when little variation in the variables exists. Finally, year-fixed effects were controlled for the effect of time in the panel data, and robust standard errors were estimated to control for inter-entity differences. For the regression analysis, missing values were imputed by the Gaussian normal regression imputation method using Stata software46 due to a large number of missing cases in the CMI data (22.01%).
Results
Table 2 displays the univariate descriptive statistics for a total of 1335 hospital-year observations. On average, the sample hospitals had 220 beds, a 42% occupancy rate, and a CMI of 1.51. Most hospitals were non-border (91.8%) and non-teaching hospitals (60%) with system affiliations (59.8%) and were in urban settings (75%). There were relatively similar numbers of private not-for-profit hospitals (36.6%) and private for-profit hospitals (35.6%) in the sample. In addition, the sample hospitals had an average of 15.2 RN FTEs and 4.4 LPN FTEs per 1000 inpatient days, and the proportion of RNs in all nursing workforce was 70%, with 77% of RNs in full-time positions.
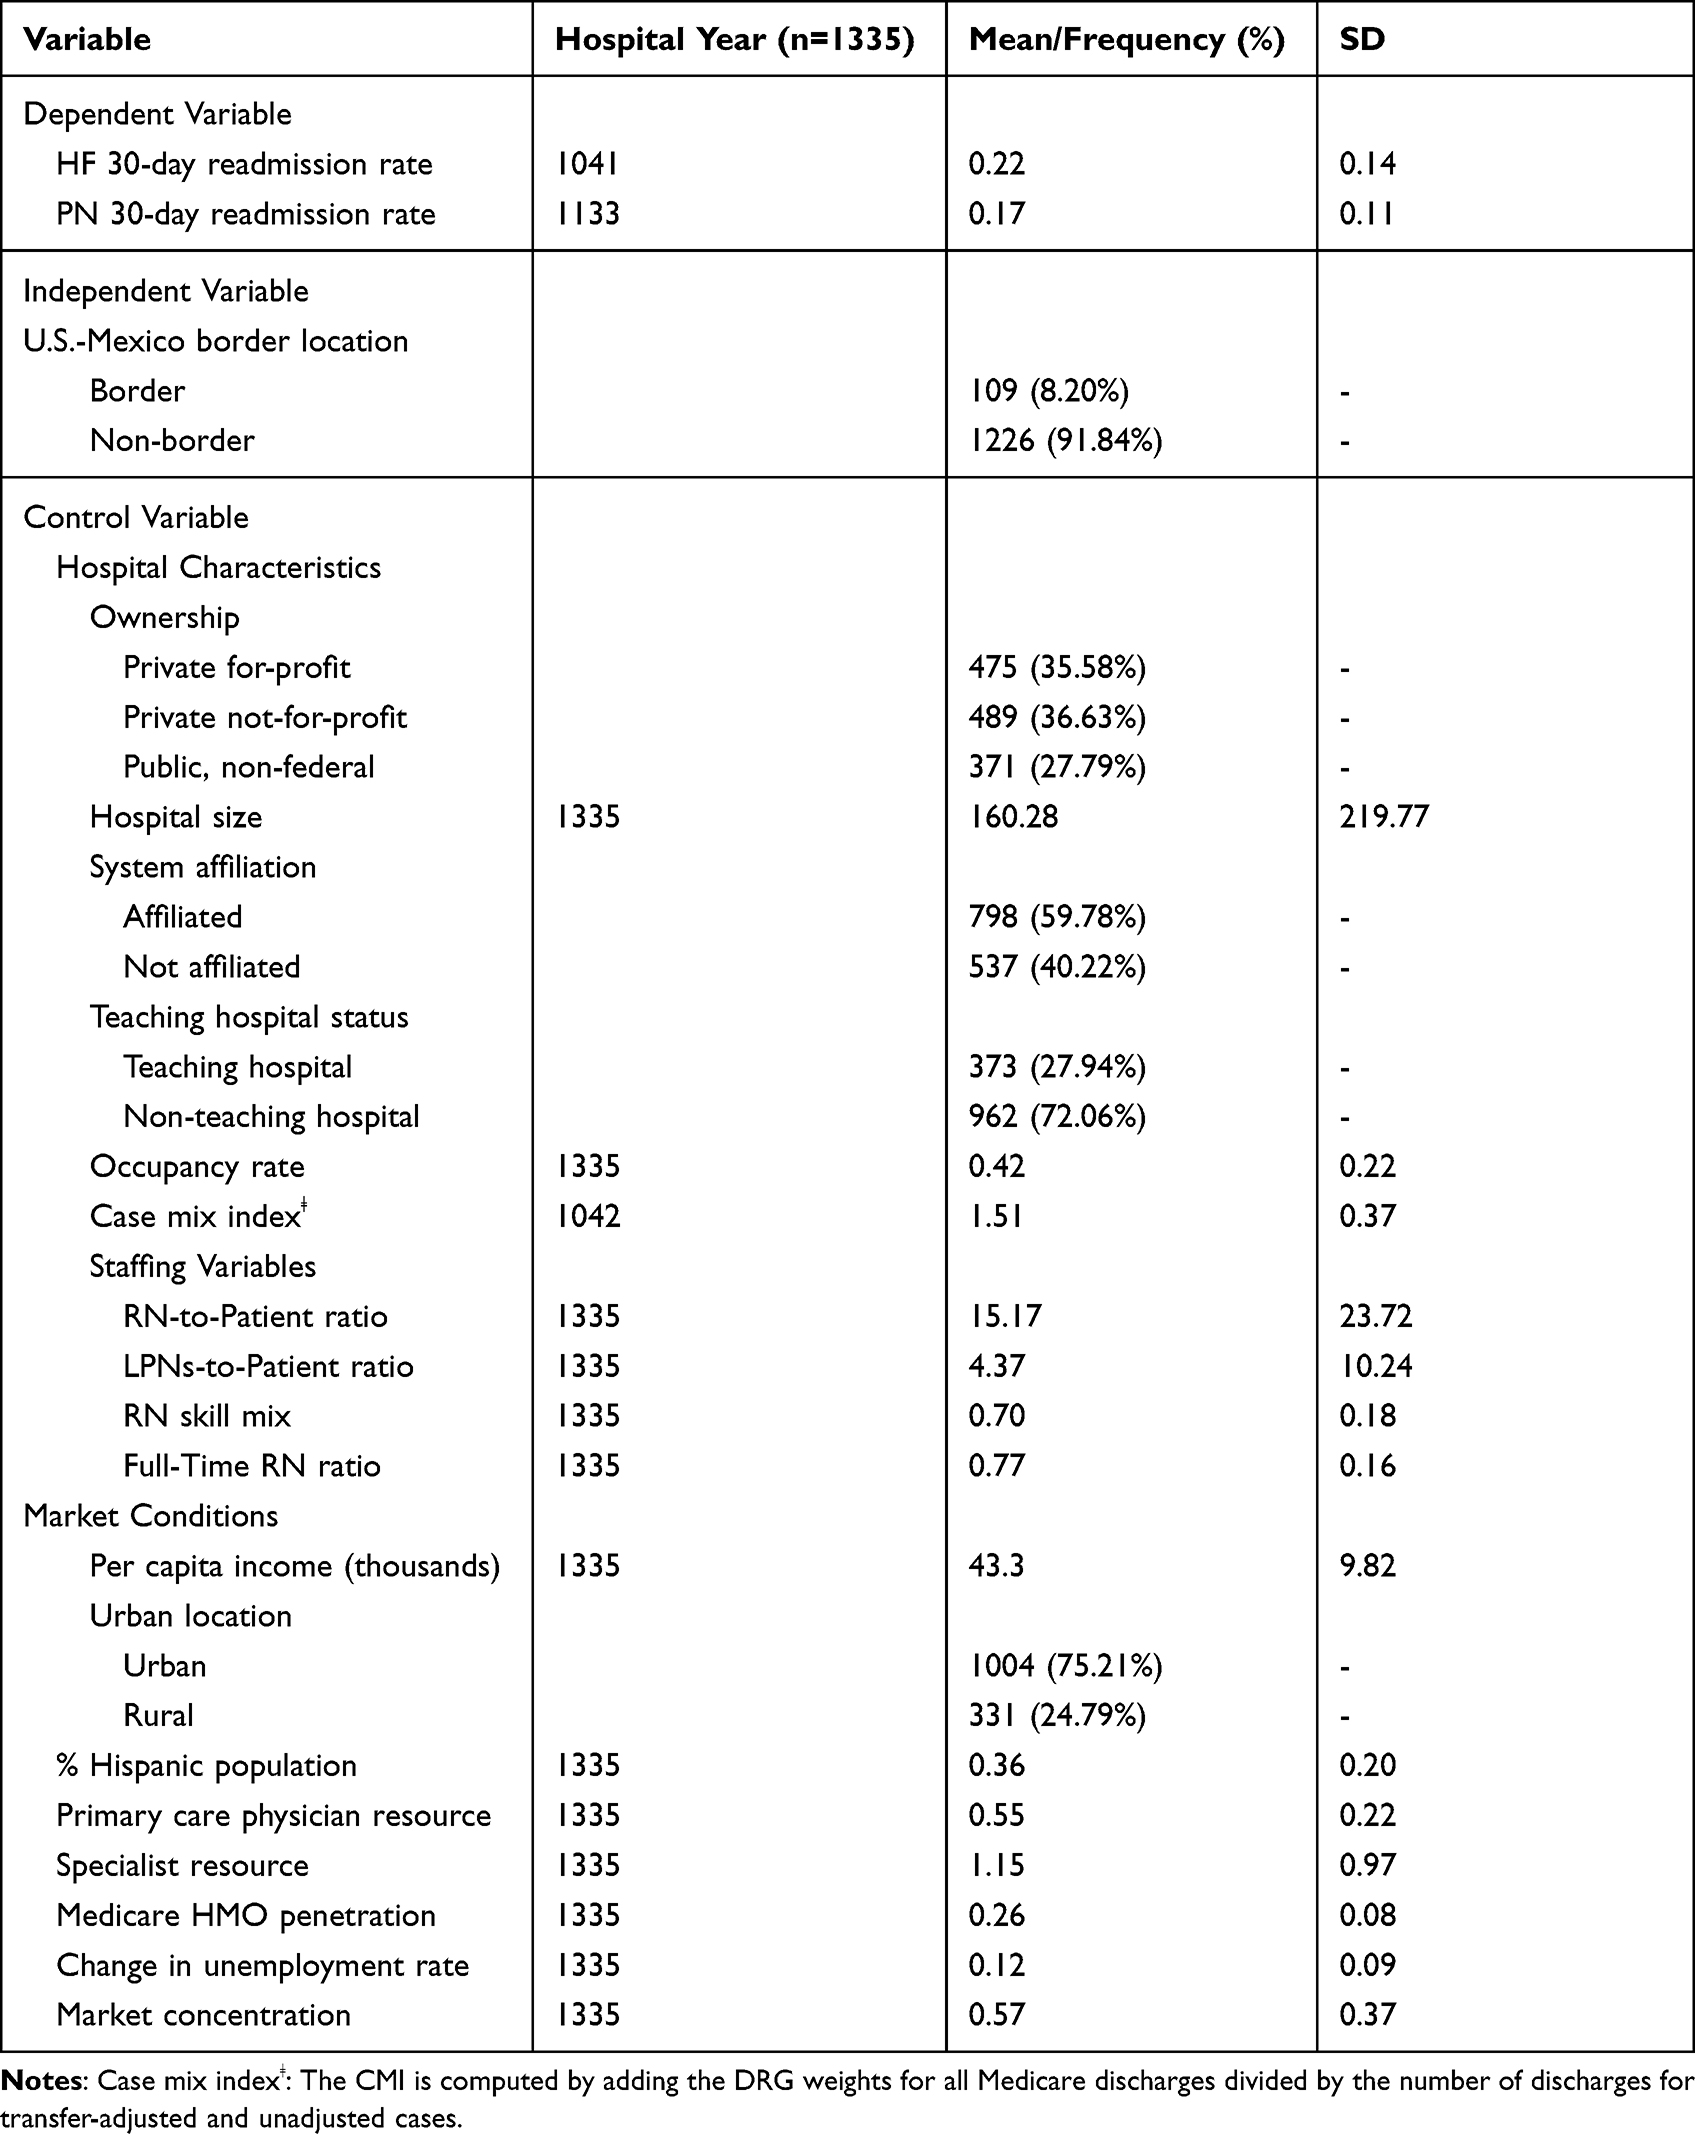 |
Table 2 Descriptive Statistics |
The hospitals in the sample were in counties with an average population of 36% Hispanic and whose population earned about $43,325 per year. The counties’ market concentration was 0.57; and an increase in the market concentration, as measured by HHI, generally indicates a decrease in market competition. On average, these counties had less than one primary care physician (0.6) and a little more than one physician specialist (1.2) per 1000 population. About 26% of those eligible for Medicare in the counties were enrolled in Medicare HMOs. The average yearly change in the unemployment rate was 12%.
Table 3 shows the results of the paired t-tests. There were statistically significant differences in the mean values of the readmission rates in Texas hospitals between 2013 and 2016. The sample hospitals of Texas in 2013 had higher HF and PN readmission rates than in 2016. Concerning the organization-level control variables, the mean values of CMI and the proportion of RNs in the sample hospitals in 2013 were significantly higher than in 2016. Compared to 2013, the mean value of the RN-to-patient ratio in 2016 was higher; however, the statistical significance was marginal (p-value: 0.078).
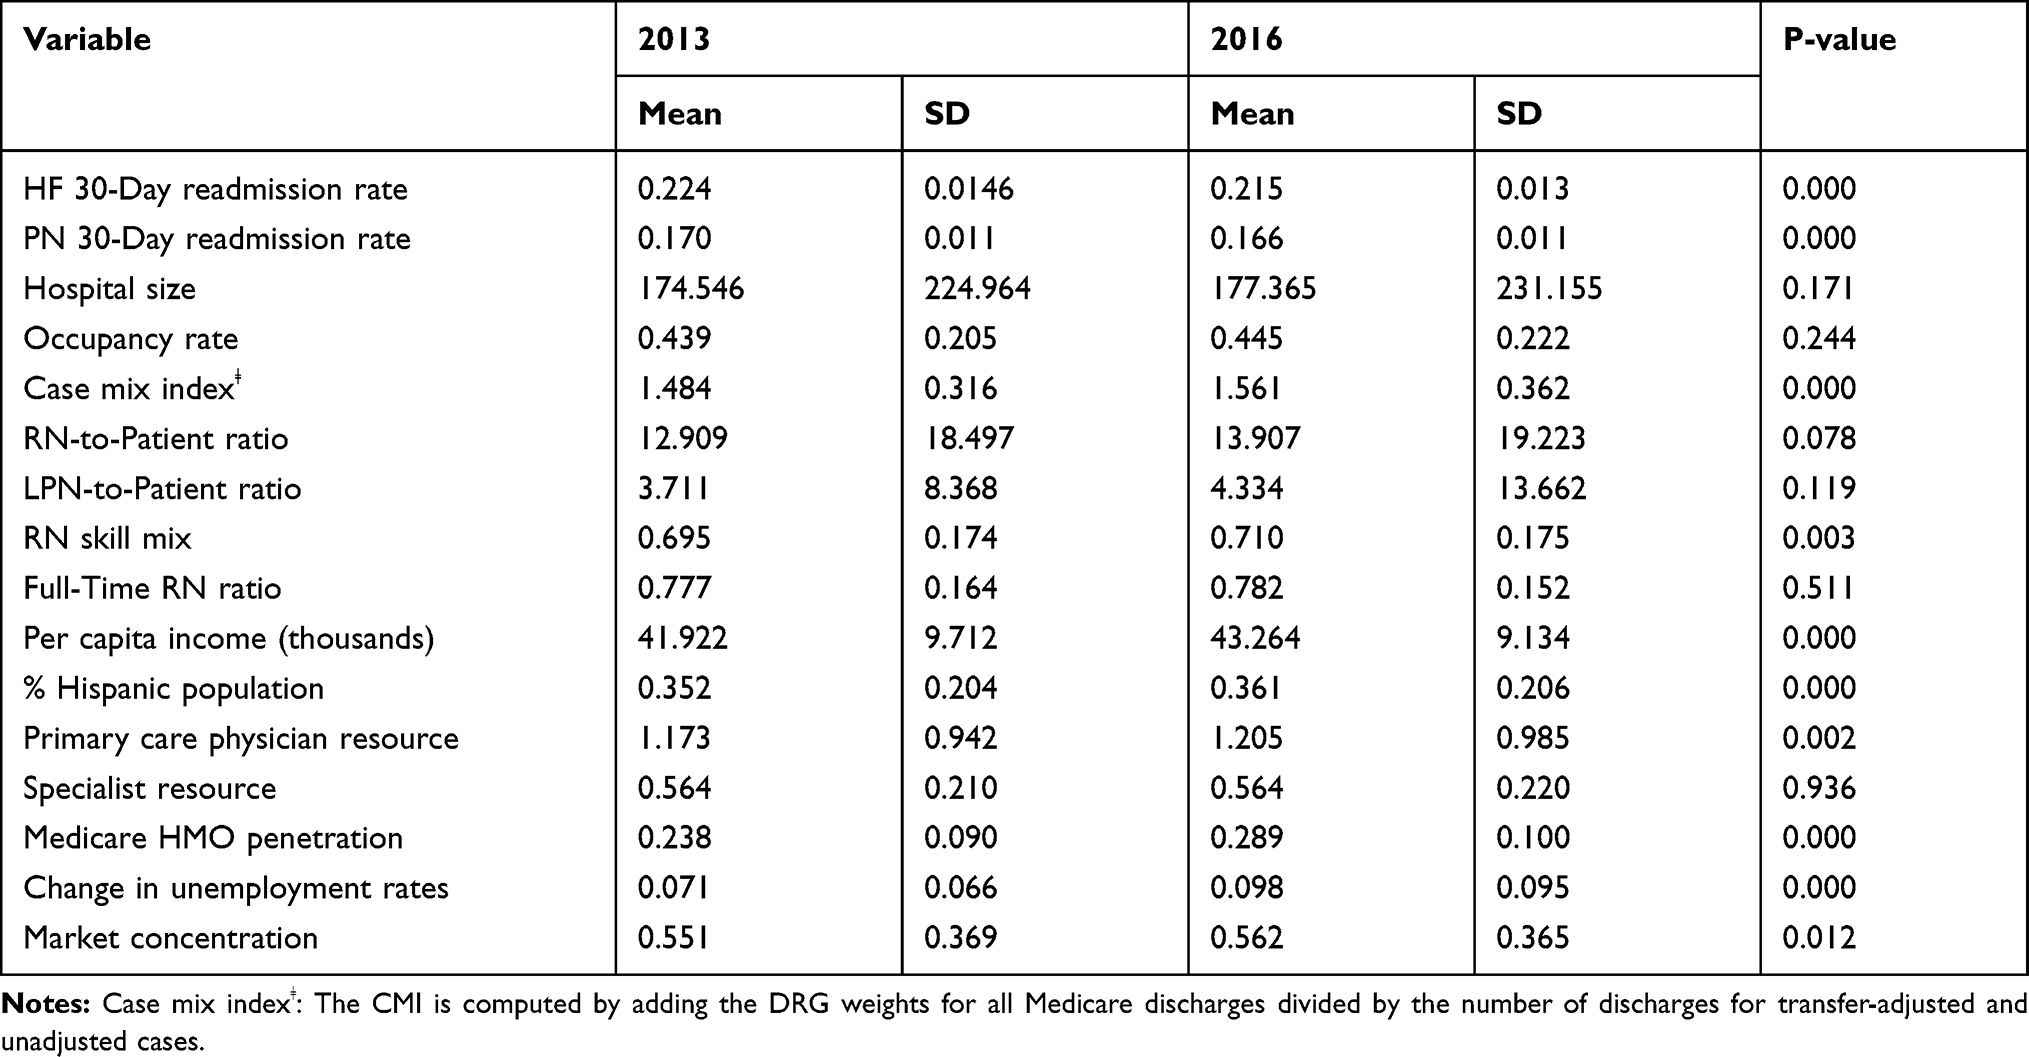 |
Table 3 Paired t-tests - Mean Difference of Variables Among Texas Hospitals Between 2013 and 2016 |
Among the market-level control variables, there were statistically significant differences in the mean values of the variables, except for the number of physician specialists per 1000 capita, between 2013 and 2016. Except for market competition, the counties in which the sample hospitals were located had higher per capita income, the proportion of the Hispanic population, number of primary care physicians, Medicare HMO penetration, and unemployment rate change in 2016 than in 2013. Since an increase in the market concentration indicates a decrease in market competition, the level of market competition was higher in 2013 than in 2016.
The random-effects regression analyses showed that the independent variable, U.S.-Mexico border location, was positively and significantly associated with both dependent variables (30-day readmission rates for HF and PN) (Table 4). When computing the exponential coefficient, border hospitals had approximately a 4.17% higher HF readmission rate and a 3.46% higher PN readmission rate than non-border hospitals.
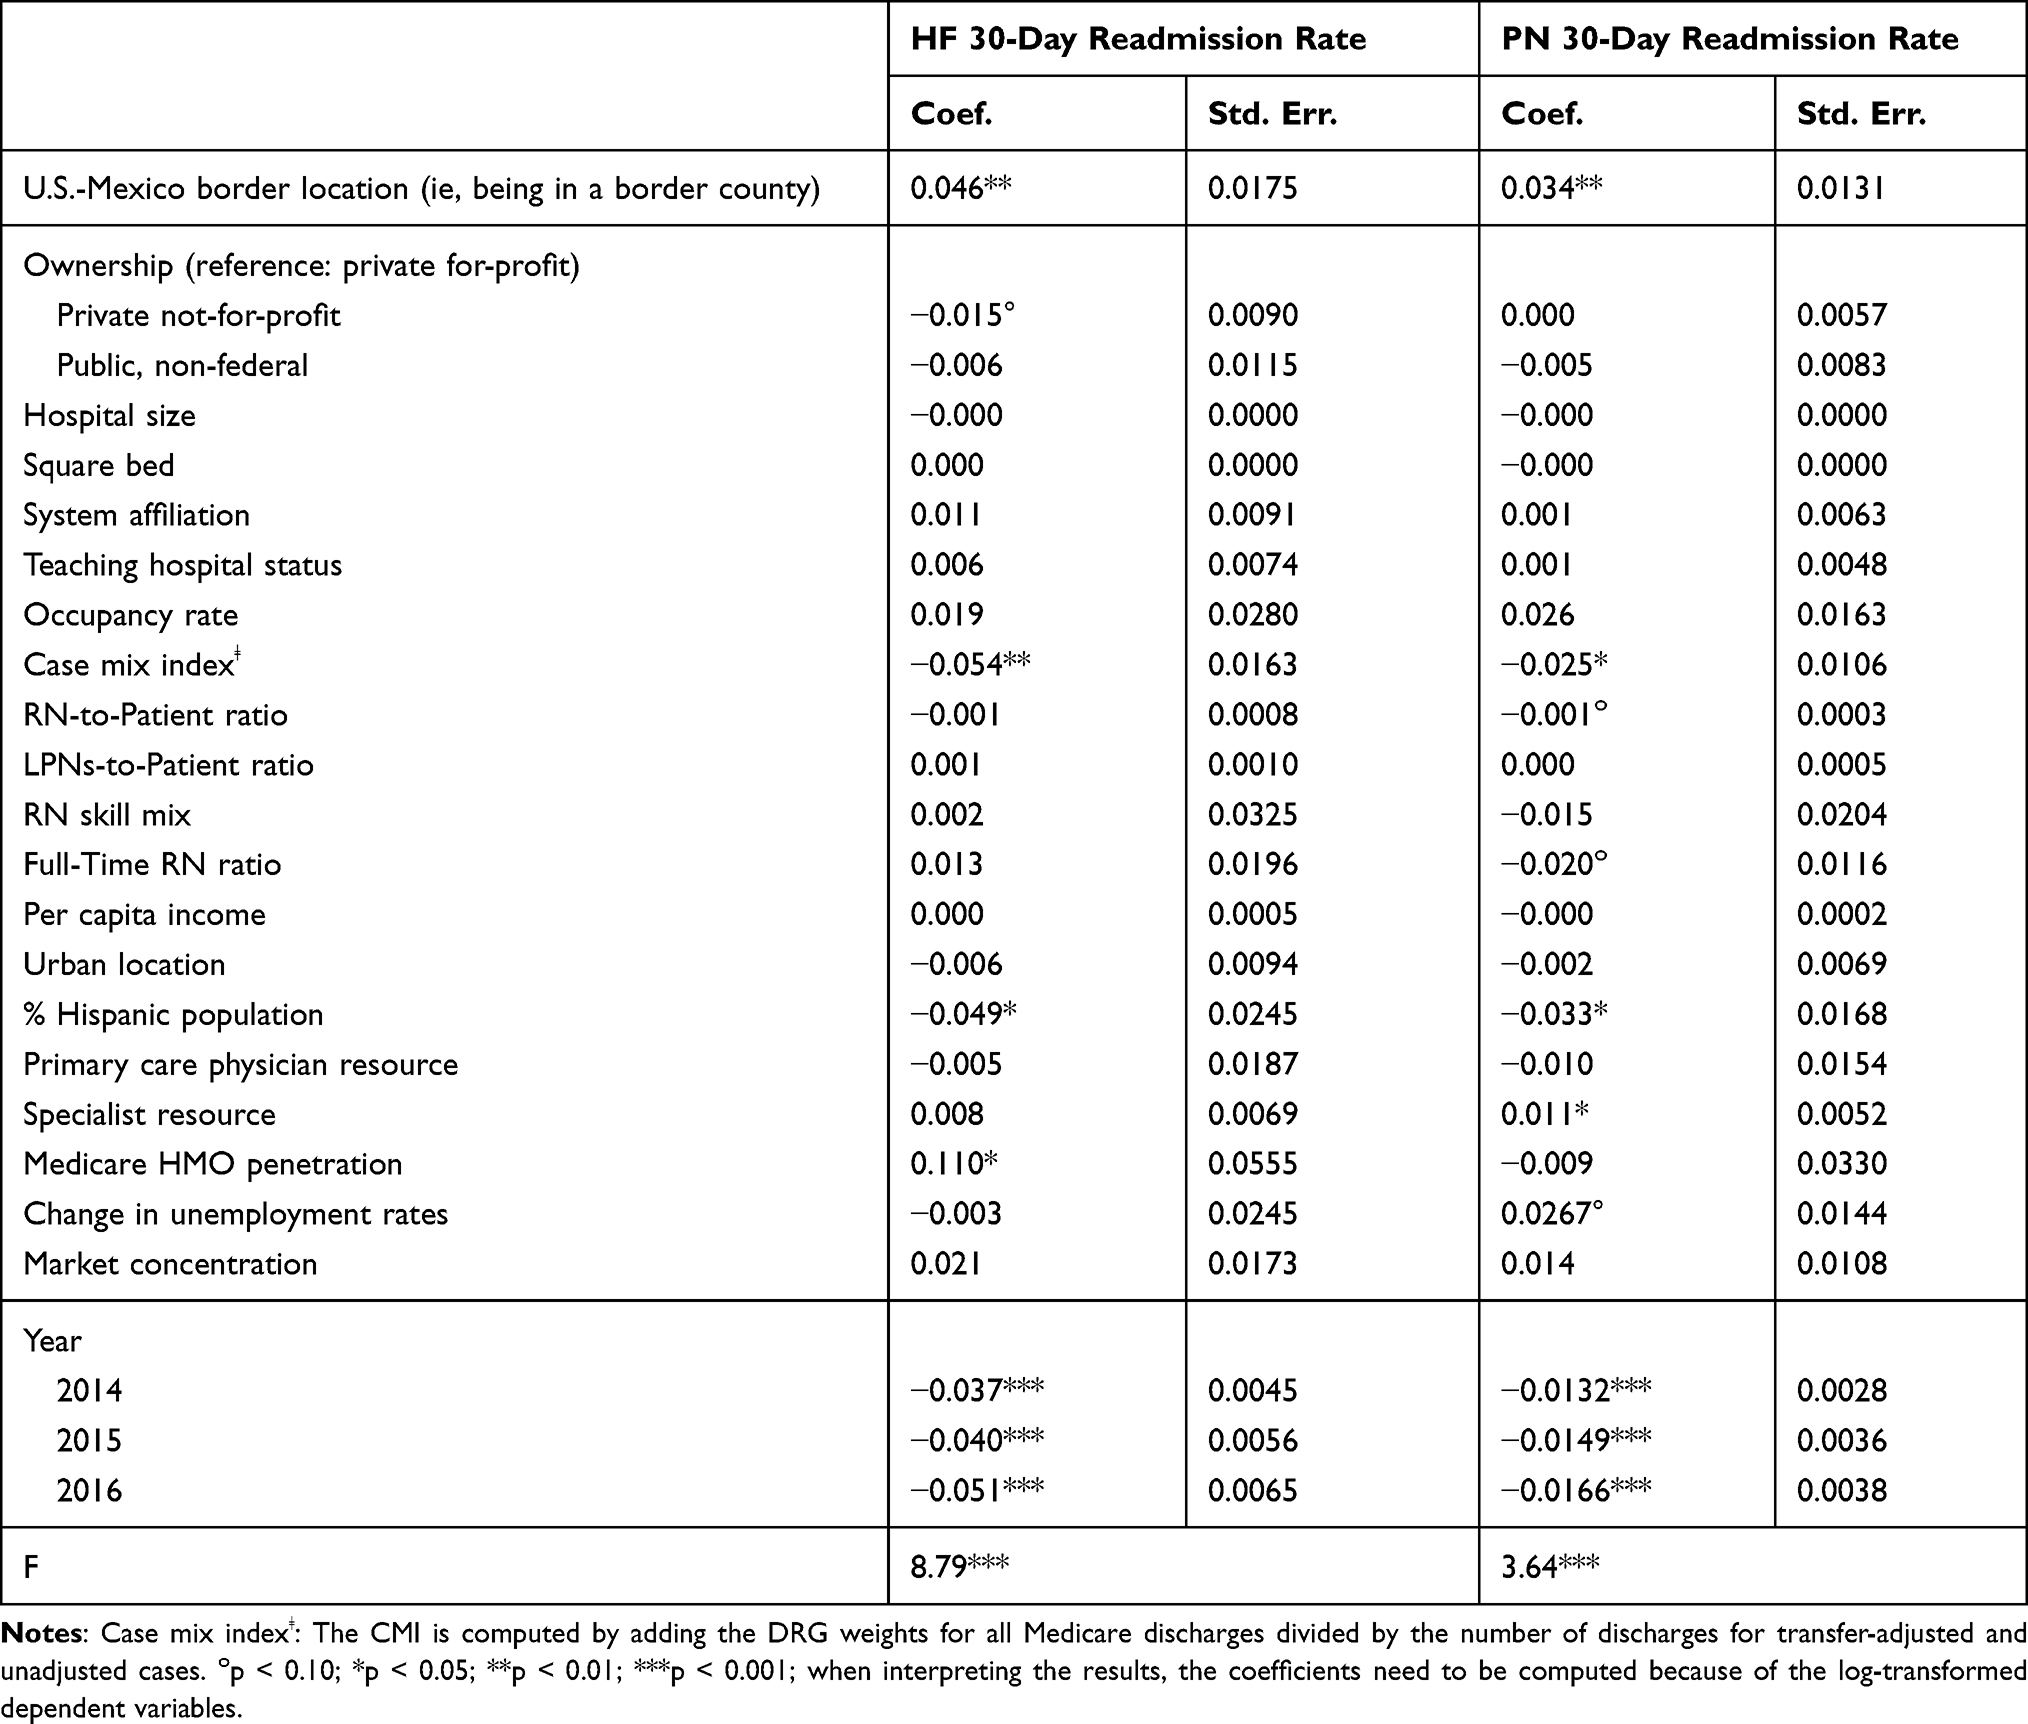 |
Table 4 Random-Effects Regression - The Relationship Between the U.S.-Mexico Border Location (and Other Factors) and Readmission Rates in Texas |
We also found that several organizational characteristic control variables were significantly or marginally significantly associated with the dependent variables. Among the sample hospitals, a 1% increase in CMI was associated with a 5.26% decrease in the HF readmission rate and a 2.47% decrease in the PN readmission rate between 2013 and 2016. Compared to private for-profit hospitals, private not-for-profit hospitals had a 1.49% lower HF readmission rate during the study timeframe; however, the relationship was marginally significant (p-value: 0.085). In addition, the RN-to-patient ratio and full-time RN ratio were also marginally significantly associated with the PN readmission rate. A 1% increase in the RN-to-patient ratio and full-time RN ratio were related to a 0.1% decrease and a 1.98% decrease in the PN readmission rate, respectively (p values: 0.077 and 0.091).
Several market-level control variables were also statistically or marginally significant predictors of the dependent variables. The Medicare HMO penetration positively and significantly affected HF readmission (exponential coefficient: 11.64%). In addition, a 1% increase in the number of physician specialists per 1000 capita was associated with a PN readmission rate increase of 1.11% (p-value: 0.035) and a similar increase in the unemployment rate raised PN readmission rates by 2.71% (p-value: 0.065).
The results also demonstrated the statistically significant relationship between the proportion of the Hispanic population in the sample hospitals’ counties and their readmission rates. A 1% increase in the Hispanic population was associated with a 4.78% decrease in the HF readmission rate and a 3.25% decrease in the PN readmission rate.
Lastly, compared to the HF and PN readmission rates in 2013, the sample hospitals had lower HF and PN readmission rates in 2014, which were again lower in 2015 and further decreased in 2016 (all p values < 0.001). Compared to 2013, the sample hospitals had lower HF and PN readmission rates by 3.63% and 1.31% in 2014, by 3.92% and 1.48% in 2015, and by 4.97% and 1.65% in 2016, respectively.
Discussion
Overall, our results indicate that border county location and some organizational and market factors are significant predictors of readmission rates in Texas. The major finding of this study was a positive relationship between border location and readmission rates among Texas hospitals. We found that Texas hospitals in border counties had higher HF and PN readmission rates than hospitals in non-border areas. To our knowledge, this is the first study of the relationship between U.S.-Mexico border hospital location and readmission rates; therefore, we cannot corroborate this finding with the existing literature.
While border hospitals may find it challenging to be responsible for patients’ health outcomes once they are discharged from the hospitals, they still need to implement different strategies to reduce 30-day HF and PN readmission rates to avoid CMS reimbursement-reduction penalties. Such strategies may include an improved transition from the hospital to the outpatient setting, patient education, follow-up calls, patient-centered pre-discharge and post-discharge interventions, case management, and home visits.
Socioeconomic and environmental challenges have impacted border public health,45 and such community drivers may have affected the quality of care in border hospitals. For example, hospitals in less resource-abundant markets (eg, counties with lower income levels) may have to employ resource-stringent strategies with fewer RNs, leading to concerns about the sound quality of care levels in such markets.20 Also, when considering the higher level of residents in below poverty levels in the border (29.3%) compared to non-border (15.9%) counties,45 border hospitals may have to adapt their quality practices to deal with market conditions threatening their viability. Further, the difference in the proportion of limited-English speaking residents in the border (31.7%) and non-border (12.2%) counties45 may have resulted in premature patient discharges from border hospitals. However, to validate this relationship and further explain it, greater research targeting border hospitals in Texas and the three other border states along the U.S.-Mexico border is needed.
In addition, to explain the variation in hospital readmission rates, this study controlled for several hospital characteristics and found statistically significant CMI and marginally significant ownership status and nurse staffing. We found that CMI was negatively associated with both HF and PN rates, contrary to the findings from a previous study.30 CMI is often used as an indicator of the severity of illness; a higher CMI suggests that the hospital deals with more complex cases that require greater services and longer lengths of stay.37 CMI also tends to be higher in larger hospitals that provide highly complex and costly services than in smaller hospitals that are likely to provide relatively simple and thus lower-cost services.38 A higher CMI may be associated with a lower readmission rate in hospitals because large hospitals are more likely to provide high-quality resource-intensive services by employing more RNs. In addition, the inconsistency in the findings between Birmingham et al30 and this study may have resulted from differences in the readmission measures (30-day all-cause Medicare readmission rate vs 30-day standardized HF and PN readmission rates), the timeframe, and other design features.
We found a marginally significant and negative relationship between the private not-for-profit ownership status (reference: private for-profit) and HF readmission rate, similar to the previous studies that have found statistically significant associations.17,27,30 It has been found that private not-for-profit hospitals are likely to respond to environmental challenges by changing their practices to survive.20 They have tighter operating margins than for-profit hospitals,30 and might have begun reacting to potential penalties of HRRP since 2013.
Furthermore, our results displayed that the PN readmission rate was negatively affected by the RN-to-patient ratio and full-time RN ratio with marginal significance, consistent with previous studies.19,24 Our findings suggest that more intensive RN staffing is associated with lower readmission rates and further emphasize that ensuring sufficient levels of RN staffing is crucial for a better quality of patient care.35 Also, compared to full-time RNs, part-time RNs may be considered less effective in providing high-quality patient care due to their less tacit knowledge relating to organizational routines and patient care.36 Therefore, higher RN-to-patient ratios and full-time RN ratios are more likely to be associated with lower hospital readmission rates.
Among market-level control variables, we found an inverse association between the proportion of the Hispanic population and HF and PN readmission rates in Texas hospitals. Previous literature has described an inconsistent relationship between Hispanic ethnicity and hospital readmission. Basu et al28 characterized lower readmission levels among Hispanics than among non-Hispanic whites. However, Rodriguez-Gutierrez et al44 reported higher readmission levels among Hispanics than in whites. On the other hand, McHugh et al25 found no significantly higher odds of readmission for HF and PN among Hispanics than whites. These studies provided different results on racial/ethnic disparities in hospital readmission based on various study methods and settings to conduct research. Their measures were intended to compare one racial/ethnic group’s hospital readmission rates with those rates of other groups using the samples of patients, while ours was to measure the impact of the proportion of a particular ethnic population in counties on readmission rates of the hospitals that operated in those counties using the sample hospitals. Thus, it is challenging to confirm if our findings are consistent with previous literature since, to our knowledge, previous studies on hospital readmissions have not utilized similar measures.
Considering the reported proportion of Hispanic people in border (88.4%) vs no-border (35.5%) counties in 2015,45 our findings on the positive association between border hospital location and hospital readmission rates may suggest that Texas hospitals in highly Hispanic populated counties are likely to have inferior hospital readmission rates for HF and PN than those in counties with less Hispanic people. However, the negative association between the proportion of the Hispanic population and such hospital readmission rates in Texas found in our study may also suggest that while it has been known that Texas border counties are experiencing health disparities, higher readmission rates in border hospitals may not be attributable to the growing Hispanic population.
We also found that the number of specialists per 1000 capita was positively associated with the PN readmission rate. A sufficient health workforce may indicate an adequate level of access to care. Also, specialists are more likely to admit patients to the hospitals; thus, more specialists can be related to higher health service utilization. Our findings related to specialist resources are consistent with the findings of Herrin et al.18
Our results also demonstrated that Medicare HMO penetration was positively associated with HF readmission rate, which is consistent with Gupta et al.17 The increase in the Medicare HMO penetration is likely to indicate that beneficiaries previously covered by traditional FFS Medicare, especially healthier ones, were attracted by Medicare Advantage plans, an alternative way to receive Medicare benefits. When healthier beneficiaries leave traditional FFS Medicare for Medicare Advantage plans, the readmission rates we used are likely to increase because those rates are only for Traditional FFS Medicare beneficiaries. This explanation may be supported by Jung et al in terms of higher hospital readmission rates in FFS Medicare than in Medicare Advantage plans.32
Lastly, the positive relationship between the change in unemployment rates and the PN readmission rate is consistent with Gupta et al.17 Fluctuations in unemployment rates may prevent hospitals from adequately responding to market challenges. This affects their practices for profitability or viability, hindering them from maintaining proper levels of quality of care, which is likely related to decreases in readmission rates.
Although we have found significant results expected to fill gaps in the literature, our findings must be interpreted considering several limitations. First, this study used secondary data that were likely to have potentially many data entry errors and missing values. Also, our study variables were limited to what was available in the data. Second, given the nature of the available data, we measured all market-level control variables at the county level. It was inevitable but suboptimal for us to define a county as the market for a hospital because its input sources, such as patients and nurses, may not only come from the county in which it is located. Future research would need to explore more robust measures of the market or the external environment of hospitals. Third, our data only covered the readmission rates of Medicare beneficiaries aged 65 or older and enrolled in FFS Medicare. Fourth, the quality of healthcare services in neighboring nursing homes may affect hospital readmission rates.18 However, we could not include this variable due to data limitations. Fifth, although we were aware of some potentially relevant control variables (eg, the proportion of Medicare and Medicaid patients) in testing our study model, we could not include all of them due to a large number of the control variables already chosen for our study (ie, 18 variables). Lastly, we used data from Texas and did not include the three other border states. Therefore, our findings cannot be generalized to other border states. We recommend that future studies focus on other border states or all four border states.
Conclusion
Despite the growing body of research illuminating the health issues in the U.S.-Mexico border region, little has been known about the quality of care provided by the healthcare providers in the area. Using longitudinal data for the state of Texas from 2013 through 2016, this study has examined the association between border location and hospital quality of care as measured by HF and PN readmission rates.
We found that border hospitals had higher HF and PN readmission rates than non-border hospitals. Given the widely known border health disparities at the individual level, our findings on the quality of care in Texas border counties at the hospital level are expected to be a great addition to the literature. Our results also provide additional evidence that organizational and market factors explain variations in hospital readmission rates in border counties. Therefore, we may draw some managerial and policy implications from our findings.
Considering that border hospitals produced higher readmission rates than non-border hospitals, our findings suggest that hospital managers in border counties should consider improving factors that affect their readmission rates to improve the quality of care. More RNs per inpatient day and a higher proportion of full-time RNs to increase RN staffing levels in Texas border hospitals may be essential changes to improve border health in Texas through decreasing hospital readmission rates. A better understanding of how RN staffing levels affect hospital readmission rates can help managers in border hospitals prevent them from avoidable payment reductions under HRRP and contribute to community health at the same time. Also, managers in border hospitals may consider the strategies discussed in the previous section (eg, patient-centered pre-discharge and post-discharge interventions) to decrease their hospital readmission rates.
Given the higher percentage of private for-profit (61.47%) vs private not-for-profit (13.76%) hospitals (see Table 5) and higher readmission rates in private for-profit than private not-for-profit hospitals, our results emphasize the importance of government initiatives. State and local government initiatives that incentivize private for-profit border hospitals to increase their RN staffing levels to lower their readmission rates can improve the health of border counties. Government efforts to attract more private not-for-profit hospitals, which were found to have lower readmission rates for HF and PN than private for-profit hospitals in Texas, in border counties may also improve overall hospital readmission rates, thereby improving health in their border communities.
 |
Table 5 Structural Characteristics of Border Hospitals vs Non-Border Hospitals Between 2013 and 2016 |
Our results also have some other policy implications through the factors that affect hospital readmission rates but are beyond the control of hospital managers. Considering the positive relationship between the change in unemployment rates in Texas counties and the PN readmission rate of the sample hospitals, state and local governments must consider initiatives to enhance economic conditions, thus stabilizing unemployment rates in communities and possibly reducing hospital readmission rates. Increased quality of care may parallel improved health status of the population. Therefore, it is crucial for decision-makers at state and local levels to understand that county-level factors may explain a substantial variation in hospital readmission rates. Modulating environmental forces that affect hospital readmissions may be essential to enhancing community health.
Ethical Statement
Institutional Review Board (IRB) approval was waived since this study did not involve human subjects.
Disclosure
The authors report no conflicts of interest in this work.
References
1. Okoro C, Zhao G, Fox J, et al. Surveillance for health care access and health services use, adults aged 18–64 years – behavioral risk factor surveillance system, United States, 2014. MMWR Surveill Summ. 2017;66(7):1–42. doi:10.15585/mmwr.ss6607a1
2. Wilper AP, Woolhandler S, Lasser KE, McCormick D, Bor DH, Himmelstein DU. Health insurance and mortality in us adults. Am J Public Health. 2009;99(12):2289–2295. doi:10.2105/ajph.2008.157685
3. McWilliams JM. Health consequences of uninsurance among adults in the United States: recent evidence and implications. Milbank Q. 2009;87(2):443–494. doi:10.1111/j.1468-0009.2009.00564.x
4. Cohen SB. The concentration and persistence in the level of health expenditures over time: estimates for the U.S. population, 2012–2013. In: Statistical Brief (Medical Expenditure Panel Survey (Us)). Rockville (MD): Agency for Healthcare Research and Quality (US); 2015.
5. Syed S, Gerber B, Sharp L. Traveling towards disease: transportation barriers to health care access. J Community Health. 2013;38:976–993. doi:10.1007/s10900-013-9681-1
6. Zhang Y, Ancker J, Hall J, et al. Association between residential neighborhood social conditions and health care utilization and costs. Med Care. 2020;58(7):586–593. doi:10.1097/MLR.0000000000001337
7. Chan L, Hart LG, Goodman DC. Geographic access to health care for rural medicare beneficiaries. J Rural Health. 2006;22(2):140–146. doi:10.1111/j.1748-0361.2006.00022.x
8. Nemet GF, Bailey AJ. Distance and health care utilization among the rural elderly. Soc Sci Med. 2000;50(9):1197–1208. doi:10.1016/s0277-9536(99)00365-2
9. Probst JC, Laditka SB, Wang JY, Johnson AO. Effects of residence and race on burden of travel for care: cross sectional analysis of the 2001 US national household travel survey. BMC Health Serv Res. 2007;7:40. doi:10.1186/1472-6963-7-40
10. Rural Health Information Hub. Rural border health. Rural Health Information Hub; 2019. Available from: https://www.ruralhealthinfo.org/topics/border-health.
11. U.S. Department of Health & Human Services. The US-Mexico border region. U.S. Department of Health & Human Services; 2017. Available from: https://www.hhs.gov/about/agencies/oga/about-oga/what-we-do/international-relations-division/americas/border-health-commission/us-mexico-border-region/index.html.
12. Vargas Bustamante A. US-Mexico cross-border health visitors: how Mexican border cities in the state of baja California address unmet healthcare needs from US residents. J Ethn Migr Stud. 2020;46(20):4230–4247. doi:10.1080/1369183X.2019.1597473
13. Bastida E, Brown HS 3rd, Pagán JA. Persistent disparities in the use of health care along the US-Mexico border: an ecological perspective. Am J Public Health. 2008;98(11):1987–1995. doi:10.2105/ajph.2007.114447
14. Su D, Richardson C, Wen M, Pagán JA. Cross-border utilization of health care: evidence from a population-based study in South Texas. Health Serv Res. 2011;46(3):859–876. doi:10.1111/j.1475-6773.2010.01220.x
15. Agency for Healthcare Research and Quality. Part 4: health care of residents of the US-Mexico border. Agency for Healthcare Research and Quality; 2015. Available from: https://www.ahrq.gov/research/findings/nhqrdr/2014chartbooks/hispanichealth/part4.html.
16. Texas Health and Human Services. Map of DSHS border area. Texas Health and Human Services; 2021. Available from: https://www.dshs.texas.gov/borderhealth/border_health_map.shtm.
17. Gupta S, Zengul FD, Davlyatov GK, Weech-Maldonado R. Reduction in hospitals’ readmission rates: role of hospital-based skilled nursing facilities. Inquiry. 2019;56:46958018817994. doi:10.1177/0046958018817994
18. Herrin J, Kenward K, Joshi MS, Audet AM, Hines SC, Hines SC. Community factors and hospital readmission rates. Health Serv Res. 2015;50(1):20–39. doi:10.1111/1475-6773.12177
19. Shin DY, Weech-Maldonado R, Chang J. The relationship between nurse staffing, quality, and financial performance in hospitals. Arch Bus Res. 2020;8(7):513–532. doi:10.14738/abr.87.8745
20. Shin DY, Weech-Maldonado R, Chang J. The impact of market conditions on RN staffing in hospitals: using resource dependence theory and information uncertainty perspective. Risk Manag Healthc Policy. 2020;13:2103–2114. doi:10.2147/rmhp.S274529
21. van Walraven C, Bennett C, Jennings A, Austin PC, Forster AJ. Proportion of hospital readmissions deemed avoidable: a systematic review. CMAJ. 2011;183(7):E391–E402. doi:10.1503/cmaj.101860
22. Mull HJ, Chen Q, O’Brien WJ, et al. Comparing 2 methods of assessing 30-day readmissions: what is the impact on hospital profiling in the veterans health administration? Med Care. 2013;51(7):589–596. doi:10.1097/MLR.0b013e31829019a4
23. Agency for Healthcare Research and Quality. How CMS measures the “30-day all cause rehospitalization rate” on the hospital compare web site. Agency for Healthcare Research and Quality; 2013. Available from: https://www.ahrq.gov/patient-safety/settings/hospital/red/toolkit/redtool-30day.html.
24. McHugh MD, Ma C. Hospital nursing and 30-day readmissions among medicare patients with heart failure, acute myocardial infarction, and pneumonia. Med Care. 2013;51(1):52–59. doi:10.1097/MLR.0b013e3182763284
25. McHugh MD, Carthon JM, Kang XL. Medicare readmissions policies and racial and ethnic health disparities: a cautionary tale. Policy Polit Nurs Pract. 2010;11(4):309–316. doi:10.1177/1527154411398490
26. Krumholz HM, Merrill AR, Schone EM, et al. Patterns of hospital performance in acute myocardial infarction and heart failure 30-day mortality and readmission. Circ Cardiovasc Qual Outcomes. 2009;2(5):407–413. doi:10.1161/circoutcomes.109.883256
27. Joynt KE, Jha AK. Who has higher readmission rates for heart failure, and why? Implications for efforts to improve care using financial incentives. Circ Cardiovasc Qual Outcomes. 2011;4(1):53–59. doi:10.1161/circoutcomes.110.950964
28. Basu J, Hanchate A, Bierman A. Racial/ethnic disparities in readmissions in US hospitals: the role of insurance coverage. Inquiry. 2018;55:46958018774180. doi:10.1177/0046958018774180
29. Vivo RP, Krim SR, Liang L, et al. Short- and long-term rehospitalization and mortality for heart failure in 4 racial/ethnic populations. J Am Heart Assoc. 2014;3(5):e001134. doi:10.1161/jaha.114.001134
30. Birmingham LE, Oglesby WH. Readmission rates in not-for-profit vs. Proprietary hospitals before and after the hospital readmission reduction program implementation. BMC Health Serv Res. 2018;18(1):31. doi:10.1186/s12913-018-2840-4
31. Horwitz LI, Bernheim SM, Ross JS, et al. Hospital characteristics associated with risk-standardized readmission rates. Med Care. 2017;55(5):528–534. doi:10.1097/mlr.0000000000000713
32. Jung DH, DuGoff E, Smith M, Palta M, Gilmore-Bykovskyi A, Mullahy J. Likelihood of hospital readmission in medicare advantage and fee-for-service within same hospital. Health Serv Res. 2020;55(4):587–595. doi:10.1111/1475-6773.13315
33. Lemieux J, Sennett C, Wang R, Mulligan T, Bumbaugh J. Hospital readmission rates in medicare advantage plans. Am J Manag Care. 2012;18(2):96–104.
34. McHugh MD, Berez J, Small DS. Hospitals with higher nurse staffing had lower odds of readmissions penalties than hospitals with lower staffing. Health Aff. 2013;32(10):1740–1747. doi:10.1377/hlthaff.2013.0613
35. Zhao M, Bazzoli GJ, Clement JP, Lindrooth RC, Nolin JM, Chukmaitov AS, Hospital staffing decisions: does financial performance matter? Inquiry. 2008;45(3):293–307. doi:10.5034/inquiryjrnl_45.03.293
36. Weech-Maldonado R, Meret-Hanke L, Neff MC, Mor V, Nurse staffing patterns and quality of care in nursing homes. Health Care Manage Rev. 2004;29(2):107–116. doi:10.1097/00004010-200404000-00004
37. Gapenski LC. Understanding Healthcare Financial Management.
38. Reiter KL, Song PH, Gapenski LC. Gapenski’s Healthcare Finance: An Introduction to Accounting and Financial Management.
39. Lawrence PR, Lorsch JW. Organization and Environment; Managing Differentiation and Integration. Division of Research, Graduate School of Business Administration, Harvard University; 1967.
40. Duncan RB, Characteristics of organizational environments and perceived environmental uncertainties. Adm Sci Q. 1972;17(3):313–327. doi:10.2307/2392145
41. Barnard CI. The Functions of the Executive. Harvard University Press; 1938.
42. Robinson JC. Market structure, employment, and skill mix in the hospital industry. South Econ J. 1988;55(2):315–325. doi:10.2307/1059105
43. Nastars DR, Rojas JD, Ottenbacher KJ, Graham JE. Race/ethnicity and 30-day readmission rates in medicare beneficiaries with COPD. Respir Care. 2019;64(8):931–936. doi:10.4187/respcare.06475
44. Rodriguez-Gutierrez R, Herrin J, Lipska KJ, Montori VM, Shah ND, McCoy RG. Racial and ethnic differences in 30-day hospital readmissions among US adults with diabetes. JAMA Netw Open. 2019;2(10):e1913249. doi:10.1001/jamanetworkopen.2019.13249
45. Texas Health and Human Services. Office of border public health. Texas Department of State Health Services; 2021. Available from: https://www.dshs.texas.gov/borderhealth/.
46. StataCorp. Stata Statistical Software: Release 15. College Station, TX: StataCorp LLC; 2017.
 © 2022 The Author(s). This work is published and licensed by Dove Medical Press Limited. The
full terms of this license are available at https://www.dovepress.com/terms
and incorporate the Creative Commons Attribution
- Non Commercial (unported, 3.0) License.
By accessing the work you hereby accept the Terms. Non-commercial uses of the work are permitted
without any further permission from Dove Medical Press Limited, provided the work is properly
attributed. For permission for commercial use of this work, please see paragraphs 4.2 and 5 of our Terms.
© 2022 The Author(s). This work is published and licensed by Dove Medical Press Limited. The
full terms of this license are available at https://www.dovepress.com/terms
and incorporate the Creative Commons Attribution
- Non Commercial (unported, 3.0) License.
By accessing the work you hereby accept the Terms. Non-commercial uses of the work are permitted
without any further permission from Dove Medical Press Limited, provided the work is properly
attributed. For permission for commercial use of this work, please see paragraphs 4.2 and 5 of our Terms.