Back to Journals » Psychology Research and Behavior Management » Volume 19
Do You See the Difference Between Perfection and Excellence?
Authors Chreim M, Boivin T ![]() , Cousineau D
, Cousineau D ![]()
Received 3 August 2025
Accepted for publication 4 March 2026
Published 19 March 2026 Volume 2026:19 558002
DOI https://doi.org/10.2147/PRBM.S558002
Checked for plagiarism Yes
Review by Single anonymous peer review
Peer reviewer comments 2
Editor who approved publication: Professor Einar Thorsteinsson
Marilyn Chreim, Thomas Boivin, Denis Cousineau
School of Psychology, University of Ottawa, Ottawa, ON, Canada
Correspondence: Marilyn Chreim, School of Psychology, University of Ottawa, 136 Jean-Jacques Lussier, Ottawa, ON, K1N 6N5, Canada, Email [email protected] Denis Cousineau, School of Psychology, University of Ottawa, 136 Jean-Jacques Lussier, Ottawa, ON, K1N 6N5, Canada, Email [email protected]
Purpose: This research investigated factors affecting statistics anxiety in university students to find out whether perfectionists are at greater risk of experiencing it. This topic is known to be amongst the most anxiety-provoking matter among undergraduate students in the social sciences, humanities, and psychology. Herein, we sought to better characterize the aims and strivings of subgroups of students with regard to statistics.
Participants and Methods: A final sample of 210 participants answered questionnaires measuring statistics anxiety, perfectionism and excellencism, academic goals, emotion regulation strategies, attitude towards statistics, and statistical ability.
Results: The results show that participants better able to discriminate affirmations of flawlessness from affirmations of excellence report lower anxiety in interpreting statistics. Excellencists endorse more mastery-oriented academic goals, less avoidance-oriented goals, and favor adaptive emotion regulation strategies. Profile analysis shows that for the perfectionism-oriented profile, anxiety to interpret statistics correlates positively with avoidance goals whereas for excellencists, it correlates negatively with mastery goals. Further, excellencists who show high anxiety to interpret statistics tend to use less adaptive emotion regulations strategies while perfectionists tend to use more maladaptive emotion regulation strategies.
Conclusion: One outstanding result is that discriminating flawless wordings from wordings aiming at excellence is a main determinant in keeping positive attitude in anxiety-triggering courses.
Keywords: perfectionism, excellencism, emotion regulation, goals, statistics anxiety
Introduction
Statistics are increasingly necessary in everyday life and for professional and academic employments. Many professional fields require some knowledge of statistical methods.1–3 In the psychological sciences, for example, great importance is attributed to these skills in both clinical and experimental fields. It is judged essential enough that many education curriculums, most social science curriculums, and virtually all psychology curriculums include at least one statistics course.4,5 However, these students tend to face difficulties with statistical reasoning6,7 and display greater statistics anxiety.1,8–15 Its exact prevalence is debated but comprised between 25% and 75% of the students.16
Statistics anxiety is defined as a discomfort resulting from exposure to statistical concepts at any level or in any form.6,17,18 It is characterized by a feeling of anxiousness during statistical analysis or during a statistics course.19,20 Statistics anxiety is known to have consequences for learning and performance as it often strongly predicts lower grades in statistics classes;9,21,22 although discordant results were published.23,24
This form of anxiety subsumes three facets.22 Firstly, it contains an apprehension regarding statistics evaluations which correlates well with trait anxiety. Secondly, it also generates an anxiety to ask questions about statistics or to meet statistics instructors, resulting in an avoidance to ask for help. This form correlates well with social anxiety. Lastly, it has a facet related to interpreting statistics. This last aspect relates well with spatial skills and spatial anxiety.11,25
Given that university students are frequently high-achievers, and that this population can loosely be divided among people striving for excellence and people striving for perfection, we need to consider how these distinct strivings relate to statistics anxiety.26 Further, relations between statistics anxiety and achievement goals (mastery goals, performance goals, or avoidance goals) are commonly reported. As there may be a relation between perfectionism and emotion processing, cognitive emotion regulations strategies such as blaming oneself should also be examined.
Perfectionism, Excellencism, and Statistics Anxiety
Perfectionism is defined as the “tendency to aim and strive toward idealized, flawless, and excessively high standards in a relentless manner” (Gaudreau, 2019, p. 200).26,27 Perfectionists expect nothing but perfection from themselves which motivates them into putting a lot of effort into the things they do.28–30 However, the standards linked to perfectionism are idealistic, unrealistic, and unattainable. In addition, perfectionists often pursue these standards in a manner that is rigid and inflexible. This leads to dissatisfaction and distress alongside accomplishments.31–33
Recently, some27 argued that previous measures of perfectionism might be conflating perfectionism and the pursuit of excellence. That is, ambiguous items which do not clearly differentiate perfection from excellence striving are often found in measures of perfectionism.34 For instance, in life, some people strive for very high standards of performance without ever wanting to reach a state of perfection. Importantly, they often do so in a manner that is adaptable. This should not fall under perfectionism but rather under excellencism, which is defined as the “tendency to aim and strive toward very high yet attainable standards in an effortful, engaged, and determined yet flexible manner” (Gaudreau, 2019, p. 200).27
To our knowledge, only two studies investigated the relationship between perfectionism and excellencism with regard to anxiety in academia. In the first, the authors found that perfectionists expressed significantly more trait anxiety, fear of failure, and rumination than excellencists.35 Respondents also showed significantly more catastrophizing about small mistakes and seek more reassurance while having significantly worse grades than excellencists. The second focused on two aspects of perfectionism, self-critical perfectionist and rigid perfectionist, with regard to statistics anxiety.26 They found a positive relation between self-critical perfectionism and statistics anxiety but no relation involving rigid perfectionism or attitude. The results supported the idea that perfectionism is both unneeded and harmful compared to the pursuit of excellence. If perfectionism is simply detrimental, we would expect to find a positive association between perfectionism and all the subscales of statistics anxiety (and the opposite for excellencism). This hypothesis is labeled H1a hereafter.
Recent work observed that perfectionists and excellencists have quite different emotional reactions while performing creativity tasks.26–37 The excellencists endorsed fewer negative emotions and fewer worries while performing a divergent thinking task (a classic item is “Tell us all the different ways you could use a brick”) while being given three choices (eg, “During the creative task, I felt (select one): surprised, amazed, astonished”). The perfectionists, on the other hand, reported heightened levels of emotions, the increase being more pronounced for negative emotions and expressions of worries compared to positive emotions. One possible explanation is that perfectionists have difficulties discriminating between emotions. Also, when completing an emotional divergent thinking task, excellencists have better scores (eg, “Name all the things you can think of that can be frustrating”, tasks introduced in36) compared to a classic divergent thinking task. Both results suggest that perfectionists may have difficulty processing or discriminating emotions with the sufficient level of nuance. Based on this view of perfectionism, we would expect to find a positive association between perfectionism and the sole sub-scale of interpretation in statistics anxiety (hypothesis H1b). Further, we would expect to find associations with cognitive emotion regulation strategies, associations that would be more pronounced for poor emotion regulation strategies (see next).
Looking at the Scale of Perfectionism and Excellencism, the questionnaire used to distinguish perfectionism and excellencism (SCOPE)38, it can be observed that all the items are presented in two versions, with the second using a more extreme wording. For example, the first item is: [As a person, my general goal in life is to.] “have very good performance”, for which the second version is “have perfect performance” (items 1 and 12). All the other items use similar terms such as “competent” vs. “perfect” (items 2 and 13), “very productive” vs. “exceptionally productive” (items 4 and 15), “skillful” vs. “flawless” (items 5 and 16), “high-quality” vs. “error-free” (items 6 and 17), “difficult but realistic” vs. “perfect” (items 7 and 18), “very well” vs. “perfectly” (items 10 vs. 21) and “very hard” vs. “relentlessly” (items 11 vs. 22). Thus, the two versions of the items differ in how extreme the expressions are. Recognizing the difference implies some nuanced processing of the item content which, as we argued above, may be what is lacking in perfectionism. Hence, these two versions of each item will be contrasted in the present study.
Achievement Goals
Academic achievement goals are commonly divided into three subscales, mastery goals, performance goals, and avoidance goals.39,40 Mastery goals are characterized by wanting to acquire new skills and competencies and a tendency to be highly cognitively engaged in tasks. Performance goals are defined as wanting to outperform others. People adopting performance goals are preoccupied with their performance compared to others and want to obtain the highest marks. They are characterized by less perseverance and more superficial cognitive engagement. Finally, avoidance goals are defined as the desire to simply “get through” a given course with minimum effort. Two goals were found to be associated with statistics anxiety:12 Mastery goals reduce statistics anxiety while avoidance goals increase it.
Considering that anxiety in general – and statistics anxiety in particular – are incapacitating, we expect to replicate the findings that it positively associates with avoidance goals, while the opposite is expected for mastery goals. More critically, the associations between these two goals and statistics anxiety should be altered by excellencism vs. perfectionistic strivings (hypothesis H2).
Emotion Regulation Strategies
Poor emotion regulation strategies are common in anxiety-inducing contexts, and statistics courses are no exception to many students. Maladaptive strategies involve among other blaming ourselves or others; adaptive strategies involve refocusing or putting into perspective, for instance. Recent research supports the idea that maladaptive regulatory strategies are associated with statistics anxiety,13 a finding that we hope to replicate herein. However, the authors did not find relations between adaptive strategies and statistics anxiety. This negative result is surprising; it could tentatively be explained by a masking variable. Herein, we consider the type of strivings adopted by respondents. The relation between statistics anxiety and adaptive emotion regulation strategies could be influenced by strivings, with perfectionism negatively related to adaptive strategies and excellencism positively related to them, resulting in a net association close to zero. The notion of reduced abilities to process or discriminate emotions would explain enhanced used of maladaptive strategies among perfectionists. This hypothesis (H3) will be examined in the present study.
Attitudes and Ability Toward Statistics
Finally, two last factors that modulate the relation between statistics anxiety and strivings are considered. The first relates to students’ attitudes toward statistics. These subsume a multidimensional concept characterized by favorable or unfavorable responses in learning statistics.41–44 Aspects of attitude involve, among others, the value of statistics, its utility, or how competent we are in this area. The more one holds positive attitudes toward statistics, the better one’s experience in statistics courses should be.13 In turn, a better experience in statistics courses should be conductive to lower statistics anxiety.
The second factor relates to one’s ability in statistics. Participants with higher abilities in statistics might concurrently experience less anxiety with regard to statistics. Given that participants are not all enrolled in a statistic class at the time of the study and given how difficult it is to obtain grades from registrars or instructors, we opted for a self-reported estimate.
To our knowledge, no study has investigated all the above variables simultaneously in the context of statistics anxiety. The closest may be.26 Such research may be useful to develop interventions that reduce statistics anxiety in students. There is a need to have good understanding of the variables that hinder versus protect against statistics anxiety. The present study aims to increase understanding of the above issues.
Objectives
The primary goal of this research is to examine factors that influence university students’ statistics anxiety. The underlying assumption is that the relations involving statistics anxiety are altered by strivings, either towards perfectionism or towards excellencism. Consequently, some of the relations may be invisible when strivings are not considered. To do so, perfectionism and excellencism strivings were examined in relation to academic achievement goals and emotion regulation strategies. Two additional variables were included in the study, namely self-reported statistics ability and attitudes toward statistics. Finally, two potential covariates were also considered in the study. First, anxiety is known to be related to gender.45 In many studies examining mathematics anxiety, the gender effect is known to be mediated by spatial anxiety.46–48 The same effect was reported with respect to statistics anxiety.11 As we did not measure spatial anxiety, gender was used herein as a simple proxy in the analyses. Second, age was also included as a covariate. Age was not identified as influencing statistics anxiety in past research; however, given the current trends showing that general anxiety levels are rising in the population,49 it is worth giving a second look to this variable.
The hypotheses examined can be summarized as follows. Statistics anxiety is expected to be positively and significantly associated with perfectionism score for perfectionists, but the opposite is expected for excellencists. Whether this association is true to all sub-scales of statistics anxiety (H1a) or only to the interpretation anxiety (H1b) will be examined. It is also expected that mastery goals and avoidance goals will be associated to statistics anxiety only for excellencists and perfectionists, respectively (H2). Finally, maladaptive emotion regulation strategies should be positively associated to statistics anxiety, replicating past studies, but the relation involving adaptive emotion regulation strategies and statistics anxiety might depend on the type of strivings pursued, explaining the lack of relations reported in previous studies (H3).
As commonly found, statistics anxiety is expected to be negatively associated with attitudes towards statistics and statistics ability. The influence of gender will be examined, although this effect is most likely an artifact of spatial anxiety, a variable that we did not measure to minimize study duration. Both associations should be non-null if we are to replicate the most-common results reported in the literature.
Materials and Methods
Participants and Procedure
Participants were all French speaking and recruited online from an institutional subject pool regrouping students in an introduction to Psychology class. This course is open to all university students but mostly followed by social science students and biomedical students. All had previous training in statistics and those who will pursue in psychology are expected to take two more classes on that subject.
Effect sizes obtained from prior studies having statistics anxiety as a dependent variable suggest that relevant correlations could be in the .20 vicinity. An a priori power analysis recommended 193 participants to reach a statistical power of .80. We therefore aimed for 300 to take into account about 33% of unfinished questionnaires, questionnaires with missing responses on one scale or more, and where the completion time was too short. All pool members who registered to the study were allowed to complete it (which explain that we ended with a larger than anticipated sample).
Participation to this study was voluntary and anonymous, and participants had the option to withdraw at any time. They earned 0.5 credit course as compensation for their participation. This online study was carried out using Qualtrics (https://www.qualtrics.com). It has been approved by the institution’s Research Ethic Board (H-08-23-9413). The questionnaires described next were broken down into pages of 10 to 12 items. The order of the pages and the items on the pages were randomized across participants.
Measures
Demographic Questions
Participants answered demographic questions concerning their gender, age, and program of study.
Statistics Anxiety
Statistics anxiety was measured using the Statistics Anxiety Scale (SAS).9,22 The French version is composed of 21 items (broken into a page of 11 items and a page of 10 items) beginning with “Indicate the level of anxiety that each of the following situations provoke in you”. It is scored on a scale from 1 (no anxiety) to 5 (a lot of anxiety). The questionnaire has three subscales: anxiety about statistics evaluations (eg, “Studying for a statistics exam”), anxiety about asking for help (eg, “Ask my statistics teacher a question about the subject I am having trouble understanding”), and anxiety about committing and interpreting statistical results (eg, “Interpret the meaning of a table in a scientific article”). Reliability measured by the McDonald’s omega ranged from .83 (interpretation anxiety) to .97 (anxiety of asking for help).
Perfectionism and Excellencism
There exist a few scales to measure perfectionism, some of which aim at disentangling the content of perfectionism (eg, self-critical perfectionism vs. rigid perfectionism). Herein, we wished to distinguish perfectionistic strivings from a distinct but related concept, excellencism. To that end, strivings were measured using the French version of the Scale of Perfectionism and Excellencism (SCOPE).30 This questionnaire includes items rated on a scale from 1 (not at all) to 7 (totally) and questions refer to participants’ general life goals. The SCOPE contains 22 items which measure excellencism (eg, “As a person, my general goal in life is to perform very well”) and perfectionism (eg, “As a person, my general goal in life is to perform perfectly”). Items were divided randomly over two pages. Reliability as measured by the Cronbach’s alpha for excellencism is .96, while for perfectionism, it is .97.38
We also introduce a contrast measure derived from perfectionism and excellencism scores. As mentioned in the introduction, the items have two versions, one of which has extreme wordings affirming perfection and flawlessness, and one affirming high but realistic standards. Everything else being identical between the items, the influence of extreme wordings can be assessed by subtracting the score of both versions. To achieve this, a new variable, called ΔSCOPE, was calculated as follows:

This derived score is neither a measure of excellencism nor perfectionism. Indeed, a participant with low scores on the two subscales could have the same difference than a participant with high scores on both subscales. It is instead a measure of how well the difference in wording between the two sets of items is perceived. If the difference in the expressions is unnoticed, then participants are likely to have similar scores on both subscales and thus, a ΔSCOPE near zero. In a sense, this contrast is a measure of perceptibility, with the target being the detection of excessive intensity of expressions such as “flawless” relative to “skillful”.
Achievement Goals
Types of achievement goals were measured using the Questionnaire des Buts en Contexte Scolaire (QBCS).40 This questionnaire contains 22 items spread randomly over two pages of 11 items. They are scored on a scale of 1 (strongly disagree) to 6 (strongly agree). The QBCS contains three subscales: mastery goals (eg, “It’s important for me to master the knowledge and skills we are supposed to learn in this course”), performance goals (eg, “In this course, I am willing to work hard only when I am sure of getting high marks”), and work-avoidance goals (eg, “In this course, I do only what is necessary to avoid failure”). Reliability as measured by the Cronbach’s alpha ranged from .75 for performance goals and avoidance goals to .88 for mastery).
Cognitive Emotion Regulation Strategies
The Cognitive Emotion Regulation Questionnaire (CERQ;50 for the French version, see 51) measures the participant’s strategies used to regulate emotions in the face of negative or unpleasant situations. The items in this questionnaire are rated on a scale from 1 (almost never) to 5 (almost always) and comprise 36 items presented over three internet pages of 12 items. The CERQ contains two subscales. The first subscale is adaptive emotion regulation (eg, “When I experience negative or unpleasant events, I think I have to accept that they happened”) characterized by acceptance, positive focus, action focus, positive reappraisal and perspective. The second subscale is maladaptive regulation (eg, “When I experience negative or unpleasant moments, I feel that I am the one to blame for what has happened”) characterized by self-blame, blaming others, catastrophizing, as well as rumination. Cronbach’s alphas were .82 for maladaptive emotion-regulation strategies and .89 for adaptive strategies.50,51
Attitudes Toward Statistics
Attitude was measured by the Survey on Attitudes Towards Statistics (SATS-36;52 for the French version, see53). The SATS-36 comprises 36 items presented over three internet pages of 12 items. They are scored on a scale ranging from 1 (strongly disagree) to 7 (strongly agree). The questionnaire contains six subscales: affects towards statistics (eg, “I will like statistics”), perceived competency to use statistical tools and techniques (eg, “I will understand statistics equations”), perception of the usefulness, relevance and value of statistics in professional and personal life (eg, “I will have no application for statistics in my profession”), perceived difficulty of statistics as a subject of study (eg, “Learning statistics requires a great deal of discipline”), the level of interest in statistics (eg, “I am interested in using statistics”), and the amount of work the student plans to put into the statistics course (eg, “I plan to complete all of my statistics assignments”). Reliability for the French version, as measured by the Cronbach’s alpha, ranged from .59 (for the subscale difficulty) to .83 (for the subscale competency) whereas it was higher in the original English version (ranging from .76 for difficulty to .89 for interest).54
Self-Rated Ability in Statistics
Finally, participants were asked to self-rate their statistics ability on a scale from 0 to 100 using a slider. They were invited to base their judgments on their previous grade(s). This question about self-reported ability is similar to the Single-Item Math Anxiety (SIMA) measure in mathematics.55 Consequently, it is named hereafter the Single-Item Statistics Ability (SISA) measure. It is common in other studies to ask for self-reported grades (commonly using letters A to E); the current approach is thus very similar except that it uses a numeric scale (0 to 100). Actual grades were not measured; as such, the external validity of this self-reported measure cannot be assessed.
Plan of Analysis
All scores on the above scales (SAS, SATS, QBCS, CERQ and SCOPE) and their subscales were re-scaled on a range from 0 to 100 to facilitate comparisons. In this scale, 0 means that the participant chose the lowest response option all the time, and 100 means that the participant chose the highest response option all the time. Statistics are reported to two decimal places except where necessary.56 Cohen’s dp are b ased on the pooled standard deviation;57,58 a negative sign indicates a decrease. The profile analyses reported below estimated model parameters using Maximum Likelihood (ML) with Mplus 7.0. As the search for best-fitting parameters could be trapped in local minima, the number of random sets of starting values was 1000, with 100 of the highest log-likelihood results used as starting values in the final phase of optimization.
The full dataset as well as the resulting dataset after data screening (see below) are available on OSF (https://osf.io/5kyd6/overview). The scripts for data analysis (using SPSS, Mplus and R) and the scripts for data visualization (using R with the packages superb and corrplot) are also available there. This study was not pre-registered; all the measures collected were described above and no other measures were taken.
Results
Data Screening
The study reached 333 participants. After examination, several participants were removed for the following reasons. Firstly, 7 participants did not consent to the study and 48 participants did not answer the questionnaire to the end. Secondly, 28 participants did not answer the item concerning self-reported statistics ability. Thirdly, 39 participants completed the study in less than 8 minutes for 138 items plus the demographics (less than 3.5 seconds per items on average). Their answers were considered too quick and not necessarily adequate. The median duration of the remaining participants was 18.5 minutes.
After computing the scales and subscales scores, an additional participant with missing responses on at least one item of every subscale was identified and removed. The final sample is therefore composed of 210 participants. One hundred and seventy-eight had no missing subscale scores; 23 had a single subscale score missing; 5 had two subscale scores missing; 2 had three missing subscale scores; 1 had four; and 1 had five for a total of 48 missing subscale scores out of 3360 subscale scores (16 subscales times 210 participants). As the proportion of missing subscale scores is low (1.4%), the analyses were performed using pairwise deletion rather than imputing the missing scores.
Three quarter of the participants were from the social or psychological sciences (80) and from the biomedical sciences (75), 42 were from humanities or finance and 8 were from STEM disciplines. Finally, the program was unspecified for 5 participants.
Effect of Gender and Age
Of the final 210 participants, 163 participants identified themselves as female (77.6%) and 40 (19.0%) as male. Five participants responded “other” (2.4%) and 2 (1.0%) participants preferred not to answer this question. The majority of participants were female, which is to be expected as recruitment was predominantly in psychological sciences and biomedical sciences which are known to have more women than men.59,60 The 197 participants who reported their age were between 16 and 38 years-old, with a mean age of 19.3 (standard deviation of 2 years and 8 months; median of 19.0). Three respondents were above 30.
As commonly reported, we find that gender is a strong and reliable predictor of statistics anxiety,61–63 explaining 4.9% of the variance in the SAS total scores. The average score for men is 45.9 with a 95% confidence interval of [38.7, 53.2] (the square brackets will denote 95% confidence intervals in the remaining) and for women, 57.7 [54.7, 60.8]. This difference of 11.8 points (Cohen’s d of 0.59) is significant (t(193) = 3.3, p = 0.001).
Broken down by statistics anxiety subscales, gender is most impactful on evaluation anxiety, with females having on average 16.6 [9.5, 23.7] more points of anxiety than males (t(193) = 4.97, p < 0.001). Anxiety of asking for help is also impacted by gender, with females being 11.9 [1.7, 22.0] points higher than males (t(193) = 2.24, p = 0.026). Finally, there is a weak impact of gender with respect to interpretation of statistics (women have 7.3 [−0.9, +15.6] more points of anxiety over men on average; t(194) = 1.97, p = 0.092). The authors in11 reported a difference of 8.2 points, similar in magnitude, but which was significant, owing to a larger sample. The full unstandardized regression coefficients are reported in Table 1, left columns.
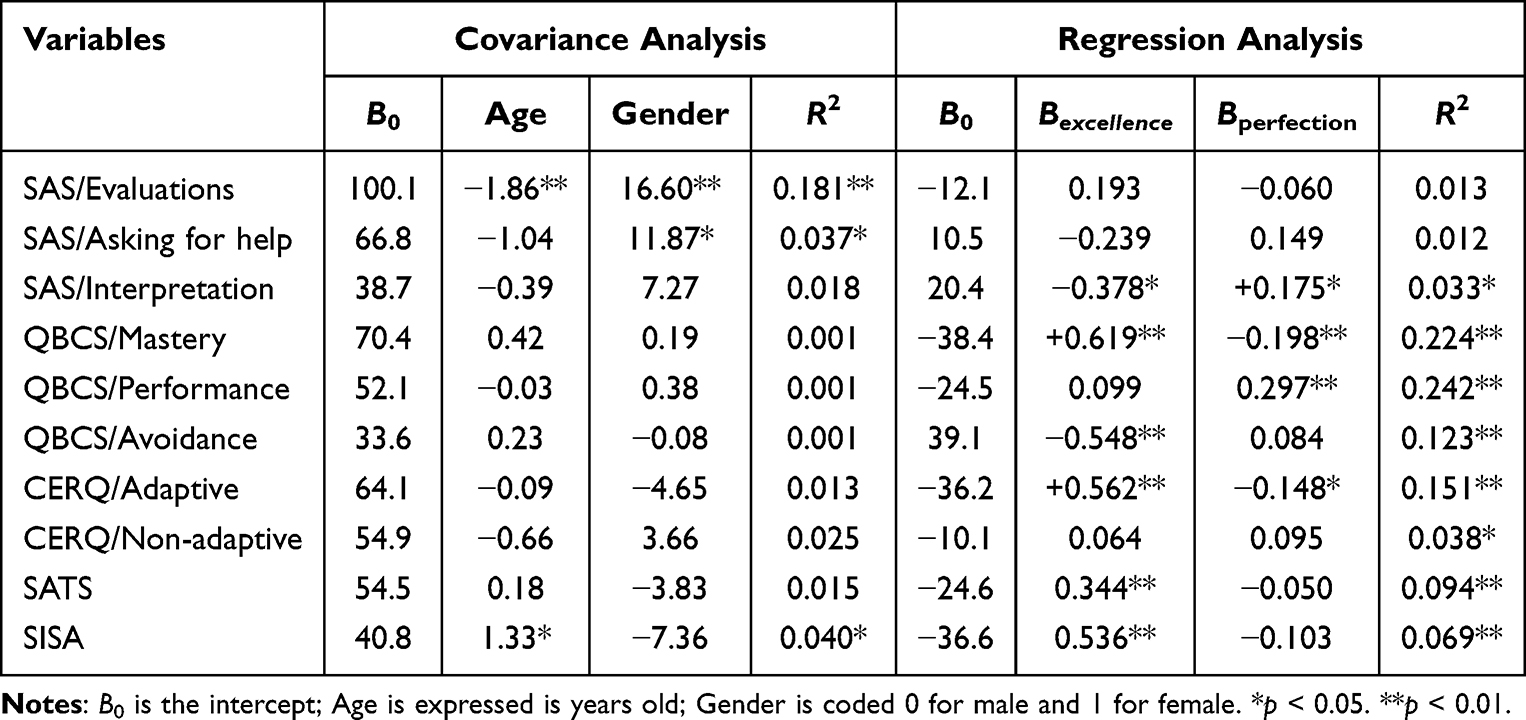 |
Table 1 Results of Covariance Analyses Using Age and Gender Complemented with Regression Analyses Using SCOPE Excellencism and Perfectionism Scores as Predictors Onto the Remaining Variables. The Bs are Unstandardized Regression Coefficients |
A significant relation with age was also found. A linear regression of age onto the SAS total score indicates that anxiety is stronger for younger participants (reducing by B = −1.21 points of anxiety per additional year of age; B is the unstandardized regression coefficient). Broken down by SAS subscales, the effect of age is only significant for evaluation anxiety (B = −1.86 points of anxiety per additional year of age). This relation is quite strong (t(193) = 3.82, p < 0.001), and together, age and gender explain 18.1% of the variance on this subscale.
The beneficial impact of age could be the result of more diverse experiences in and outside academia which would moderate evaluation anxiety. Alternatively, it could indicate that older participants feel more capable with statistics. This conjecture is supported by the inverse effect of age on self-reported ability in statistics (SISA; B = +1.33 points of ability per additional year of age, t(196) = 2.14, p = 0.034).
Descriptive Statistics
Table 2 provides the descriptive statistics as well as the reliability indices for all six scales and their sixteen subscales. A full description of the summary statistics is available on the OSF web site in the Appendix A located at https://osf.io/5kyd6/overview, subfolder Supplementary. It also shows the full correlation matrix in Figure A1
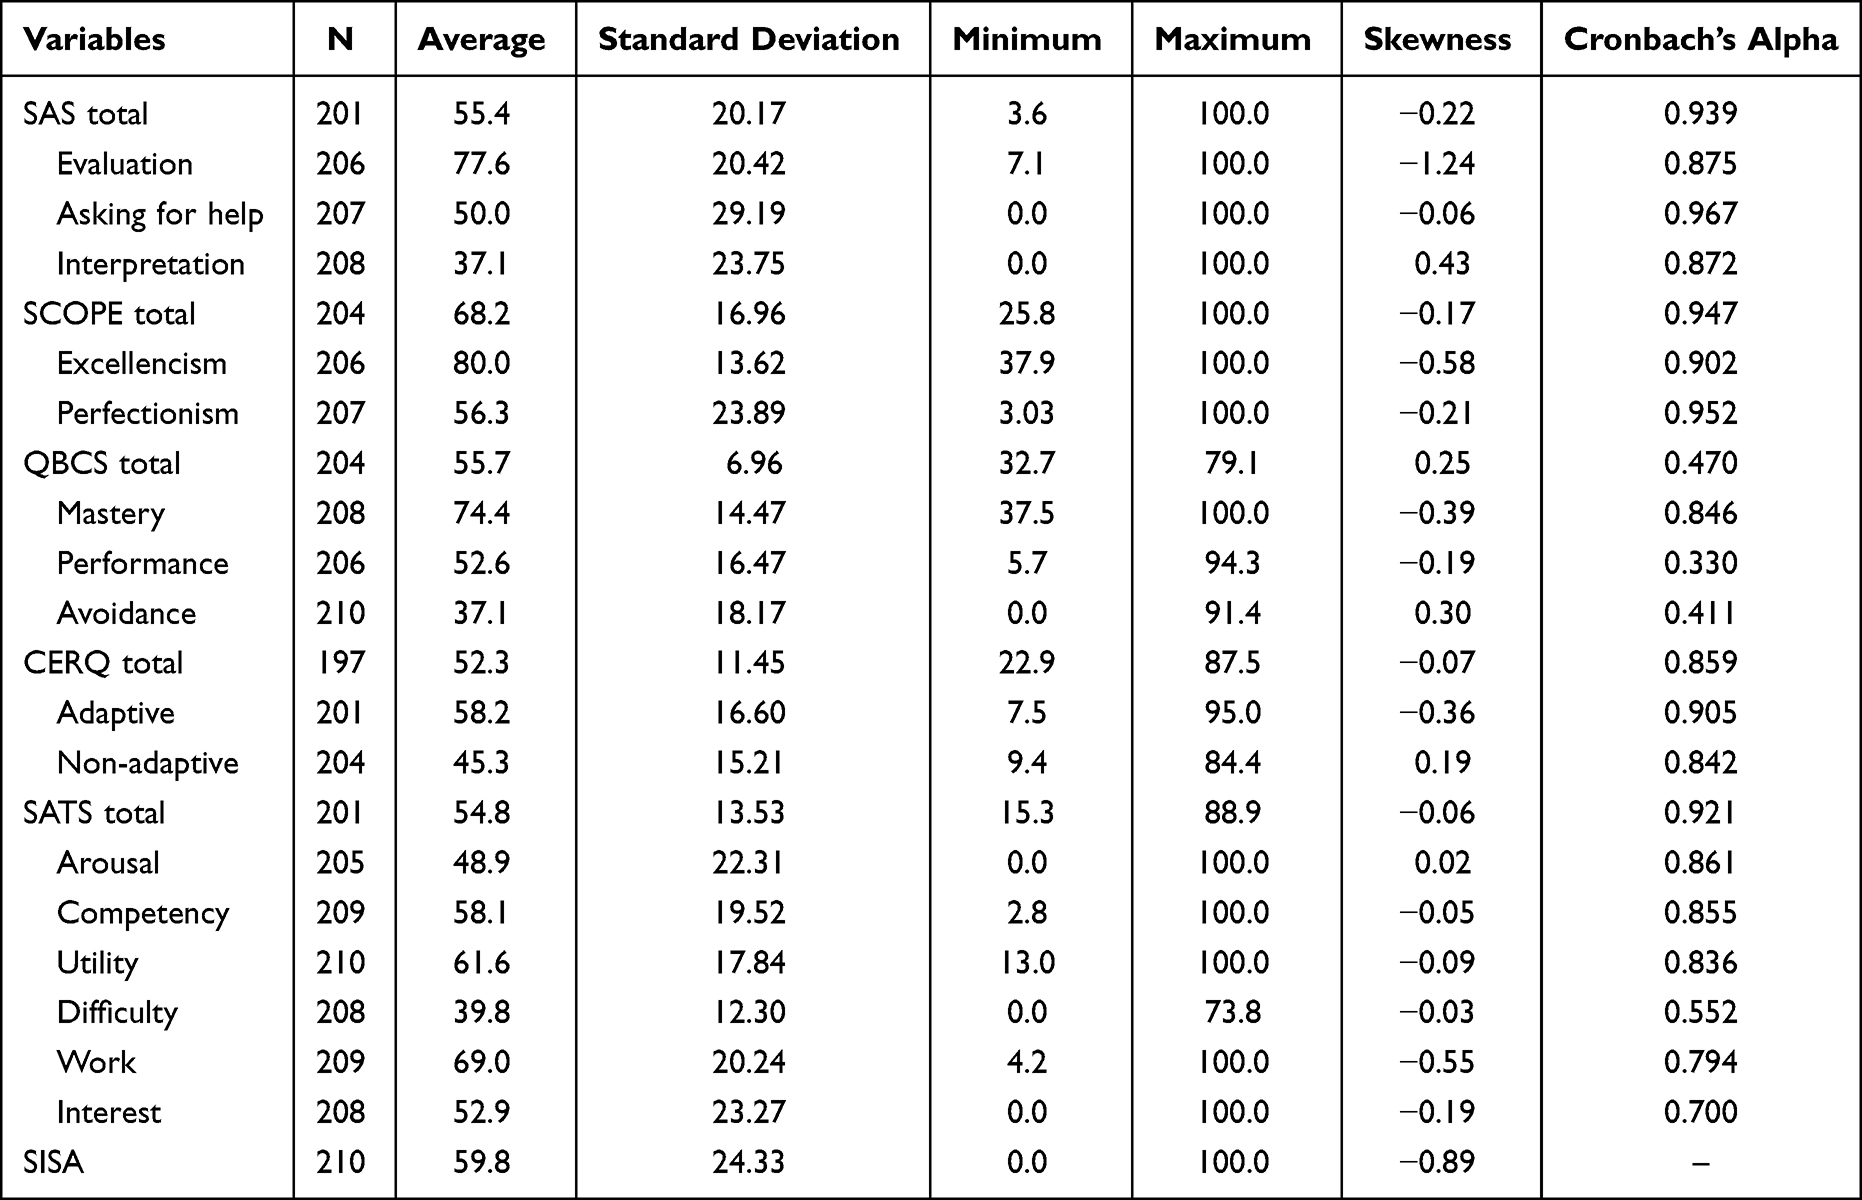 |
Table 2 Descriptive Statistics of the Variables |
Figure 1 shows the ΔSCOPE scores. The raw data are shown on the left panel and their differences on the right panel. As seen, the ratings for excellencism are high with a possible ceiling effect. However, when the participants responded to the items containing more extreme expressions, their ratings reduced markedly for most of them, with an average drop of 23.7 points on a scale from 0 to 100. This drop is present in the vast majority of participants; only 10 out of 210 (4.7%) had an increase from Excellencism to Perfectionism (shown with red lines), and 9 others (4.3%) had the same score on both subscales (7 of which had the maximum score of 100).
 |
Figure 1 Excellencism and Perfectionism scores illustrated using a corset plot (left panel), and their difference ΔSCOPE (right panel). Notes: Lines connect individual participants’ scores; the 10 red lines show participants whose scores increased. The green error bars show the correlation and difference-adjusted 95% confidence intervals of the mean. The correlation between Excellencism and Perfectionism is .60. Figures 1 and 3 in this manuscript were realized using superb for R (see https://osf.io/5kyd6/overview for the R scripts).64 |
Being based on the two SCOPE measures, ΔSCOPE ought to correlate with excellencism and perfectionism. Assuming that the perceptibility to excessive expression is a factor equally common to excellencism and perfectionism, then their correlations with ΔSCOPE should be split evenly. As the correlation between excellencism and perfectionism is about .60, the correlations between ΔSCOPE and each subscale should be approximately 0.45 (the exact formula being  ). The actual correlation between ΔSCOPE and excellencism is −0.04 whereas the correlation between ΔSCOPE and perfectionism is +0.83. Consequently, this contrast does not capture a common factor but a factor which loads preferentially onto perfectionism.
Pairwise Correlations Between Subscales
In order to examine the relations between the variables and statistics anxiety in depth, pairwise Pearson correlations between the different subscales of all questionnaires were carried out. The interrelations between the SATS subscales are generally good (average r of .400), the exceptions being the correlation between the perception of work and the perception of difficulty which is small (r = −0.01). Also, the correlations between subscales of SATS and the other variables are always of the same sign when they are significant. Therefore, we will report only SATS total score correlations for easier interpretation of the results. The interested reader can find an expanded correlation matrix in Figure A1 which includes all the SATS subscales in the Appendix on the OSF site, folder Supplementary, at https://osf.io/5kyd6/overview.
The correlation matrix is presented in Figure 2. As can be seen, SISA is correlated with half of the variables. It is negatively and significantly associated with the three subscales of statistics anxiety (rs between −0.17 and −0.32, all ps < 0.05; evaluation anxiety in statistics is the least correlated). SISA correlates positively with mastery goals and negatively with avoidance goals. Also, SISA correlates with the use of adaptive strategies to regulate emotions (r = 0.20) but weakly with maladaptive strategies (r = 0.09). Lastly, SISA is strongly correlated with SATS total score (r = 0.53): participants with a better perception of their ability to do statistics have more positive attitudes toward this subject.
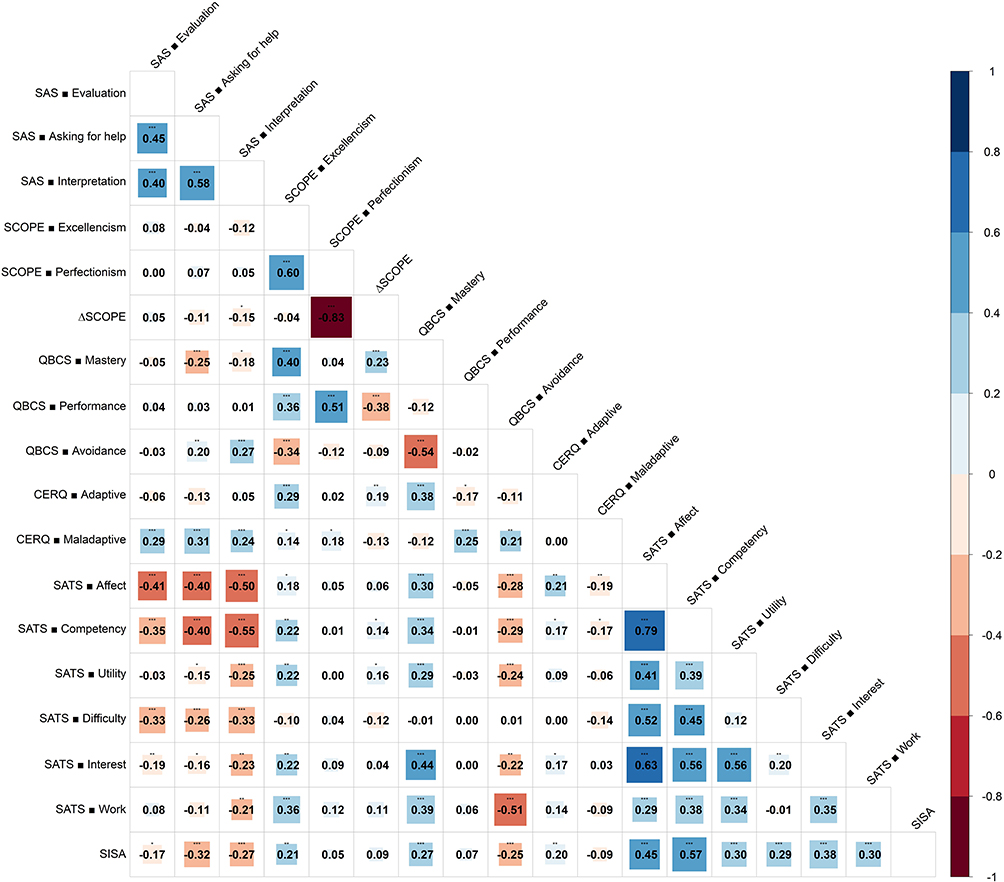 |
Figure 2 Bivariate correlation matrix plot obtained with the package corrplot for R (see https://osf.io/5kyd6/overview for the R scripts).65 The variable Δ SCOPE is the difference between the SCOPE or excellencism and the SCOPE of perfectionism (Eq. 1). Notes: *p < 0.05; **p < 0.01; ***p < 0.001. |
We will examine the subsequent correlations in accordance with the hypotheses. From H1, we wanted to determine if Perfectionism is related to some or all the subscales of statistics anxiety. Figure 2 shows that little correlation is to be found between SCOPE and SAS subscales. However, Perfectionism and Excellencism are strongly interrelated (r = 0.60). The variable ΔSCOPE hints to the fact that anxiety of interpretation may behave differently with regard to strivings. Indeed, participants who can perceive the extreme nature of expressions (high ΔSCOPE score) have significantly less anxiety in interpreting statistics (r = −0.15, p = 0.020). We here have a strong indication that perfectionist strivings may be obscuring some relations involving statistics anxiety.
In Table 1, top three lines, we presented regressions where the two strivings were entered simultaneously (and so put into competition to capture variance). It shows that Perfectionism increases interpretation anxiety (B = +0.175 of anxiety per point of Perfectionism, p = 0.05) but not the two other forms of anxiety (B = −0.06 and +0.15 for evaluation and asking for help, ps > 0.17). Conversely, Excellencism reduces interpretation anxiety significantly (B = −0.378, p = 0.02). It has a weak and not statistically noteworthy impact on the other two forms of anxiety (B = 0.19 and −0.24, ps > 0.12). The results therefore favor H1b over H1a.
Regarding H2 and H3, we considered an interaction involving strivings for the impact of QBCS and CERQ on statistics anxiety. A prerequisite before we examine these hypotheses is that there are non-null correlations between strivings and QBCS/CERQ. With regard to strivings, Excellencism is positively correlated with Mastery and performance goals whereas it is negatively correlated with avoidance goals (rs of .40, 0.36 and −0.34, respectively, all ps < 0.001). Excellencism is also strongly and moderately correlated with the use of adaptive and maladaptive strategies (r = 0.29, p < 0.001 and r = 0.14, p = 0.04 respectively). The results with Perfectionism are markedly different. It correlates with performance goals but not with mastery goals and negatively with avoidance goals (r = 0.51, p < 0.001; r = 0.04, p = 0.60; and r = −0.12, p = 0.08, respectively). Perfectionism also does not correlate with the use of adaptive strategies but does with the use of maladaptive strategies (r = 0.02, p = 0.83; and r = 0.18, p = 0.01 respectively). The numerous significant correlations warrant that we examine strivings in subgroups of participants in the next subsection.
Because ΔSCOPE tells a different story than Perfectionism and Excellencism, this variable is examined more carefully. A subsidiary aim of this study was to find out whether the ability to detect more extreme expressions could improve understanding of the relations between perfectionism and statistics anxiety. As mentioned above, ΔSCOPE correlates with interpretation anxiety in statistics but not with the other two subscales of the SAS. As anxiety to interpret statistics (rather than social anxiety or trait anxiety) subsumes committing with nuanced concepts, it may underlie a cognitive limitation common to both (interpreting statistics and interpreting affirmations of flawlessness).
When examining ΔSCOPE, we see that participants who discriminate extreme expressions more also have a more mastery-goal orientation and a less performance-goal orientation, or vice versa (rs of +0.23 and −0.38, respectively, both ps < 0.001). ΔSCOPE is unrelated to avoidance goals (r = −0.09, p = 0.188). Participants with high ΔSCOPE may realize that the extreme wordings are targeting “performance-only” goals; they may also realize that these are not realistic goals, or at least that they are not under their control.
Congruent with this interpretation, ΔSCOPE was weakly and negatively associated with maladaptive emotion regulation strategies (r = −0.13, p = 0.073), while being positively and significantly associated with adaptive emotion regulation strategies (r = +0.19, p = 0.008).
Also seen in Figure 2, ΔSCOPE is unrelated to SISA (r = 0.09, p = 0.206). Again, this supports the idea that ΔSCOPE may be related to emotion processing. It is also weakly related to SATS (r = 0.10).
With regard to statistics anxiety, those with higher levels of anxiety tend to report the least positive attitudes toward statistics (correlations between −0.28 and −0.49 for the three subscales of SAS, all ps < 0.01). This reiterates commonly obtained results. Interpretation anxiety is the subscale that correlates the most with SATS (r = −0.49).
In the online Appendix B (https://osf.io/5kyd6/overview, file APPENDICES), we performed the interpretational framework analyses recommended in3,5 to better characterize the expected scores of a perfectionist, an excellencist and a non-excellence/non-perfection striver on statistics anxiety and the other variables examined. The methodology is described in Appendix B and illustrated in Figure B1.
Classifying the Participants
To better understand the results, verify their robustness, and test H2 and H3, an alternative analysis was done based on an automatic classification of the participants. This analysis is motivated by the assumption that excellencists are presumably a distinct population from the perfectionists. Including both populations into analyses may mask effects, as the resulting statistics are a mixture of the statistic of both populations. When the two populations have opposite behavior, the result may wrongly point to an absence of relation.
Performing a classification of the participants informed by a subset of the variables (the indicator variables) should help visualize the impact of these variables on the remaining variables. The classes obtained are commonly called profiles.66 One drawback is that the resulting subsets are smaller (fewer participants than in the whole sample), resulting in a loss of statistical power. The outcome variables (the variables not used as indicators) are not involved in the classification and therefore, the classification has no influence on type-II error rate regarding the analyses of these variables.
To classify the participants, Latent Profile Analyses (LPA) were used.67 In the analyses, SATS total score, SISA, the three SAS subscales, excellencism, perfectionism, and ΔSCOPE scores were used as indicator variables. A two-profile solution was sought but as described below, a three-profile solution was best. In the analyses, the number of profiles was manipulated from two to four. Three variance-covariance models were also examined, one where the variance is a constant for all indicator variables (although inspection of Table 2 shows that this assumption is dubious); one where the variances are free to vary between the indicator variables but constant across profiles; and a third model with free variances as well as non-null covariances, all constant across profiles (the last two are called Models A and B, respectively).68 For example, in the two-profile solution, Model A has 8 means per profile to estimate, 8 variances and one classification threshold, resulting in 25 free parameters.
As expected, the model with constant variances performed poorly (with weak entropy between .74 and .83 for two and four profiles, respectively; entropy is an indicator of uncertainty in classification).69 With regards to Model A, the Lo-Mendell-Rubin test indicated that the three-profile solution surpasses the two-profile solution (LRT = 119.6, p = 0.025)70 but the solution with four profiles did not surpass the solution with three profiles (LRT = 88.9, p = 0.610). Entropies varied between .85 and .86. Within Model B, the three-profile solution surpasses the two-profile solution (LRT = 140.7, p = 0.017) but a four-profile solution did not surpass the three-profile solution (LRT = 124.0, p = 0.102). Entropies varied between .89 and .92 from two to four classes, respectively. The solution of Model A with three profiles was preserved, although according to AIC, this is not the most parsimonious model (AIC of Model A is 14,353 whereas it is 14,041 for Model B; this is not surprising as the indicator variables are correlated, as was seen in a previous section). Both models produced similar classes.
The profiles generated from the three-profile solution with Model A are shown in Figure 3. The top panel shows the mean indicator variables, and the bottom one shows the mean outcome variables for each profile. As can be seen, one profile, the green one, is characterized by very low attitudes towards statistics and low self-reported ability; it is called hereafter the Low ability profile. This profile contains close to one-quarter of the sample (23.33% or 49 participants). The other two profiles have comparable ability and attitude scores as well as anxiety but diverged considerably with regard to the SCOPE measures. The purple profile scores were the lowest on average on perfectionism, whereas the red profile scores were the highest. Therefore, these profiles were qualified as Excellencist (purple lines; 29.1% or 61 participants) and Perfectionist (red lines; 47.6% or 100 participants).
 |
Figure 3 Scores on the indicator (top panel) and outcome (bottom panel) for three profiles obtained from LPA. Notes: The semi-transparent circles show the position of individual participants; the large dots show the mean and the error bars show the difference adjusted 95% confidence intervals. The asterisks are the results of post-hoc Welch tests71 at the .05 level (*) and .01 level (**). |
It is surprising to see more perfectionists than members of the other two profiles (the frequencies are significantly different, G(2) = 19.6, η2 = 0.085, p < 0.001; the frequency of the low ability is not significantly different than the Excellencist frequency; G(1) = 1.31, η2 = 0.012, p = 0.253).72 Yet, looking at Figure 3, the perfectionism scores show a very clear separation between the Excellencist profile (purple line) and the Perfectionist profile (red line). When a frequency plot of the Perfectionist scores is examined over the entire sample, we see a hint of bimodality (see Figure S1 in the APPENDICES of the folder Supplementary on the OSF site https://osf.io/5kyd6/overview) which seems well split by the present profile analysis. Some authors, using a different classification procedure, also observed more numerous perfectionists than excellencists in an academic sample,30 so that this result is not surprising.
The Low-ability profile exhibits lower attitudes (Cohen’s dp = −3.11 [−3.67, −2.55]; in this section, all the Cohen’s dp are relative to the Excellencist profile), lower self-reported ability (dp = −1.36 [−1.79, −0.93]), and a higher level of statistics anxiety (dp = 0.39, 1.14, and 1.01 for evaluation, asking for help, and interpretation respectively). For the SCOPE, the low-ability profile is located approximately in-between the other two profiles (dp = 0.05, 1.65 and −1.76 for excellencism, perfectionism, and ΔSCOPE). This profile shows the weakest aim for mastery (dp = −0.76 [−1.15, −0.37]) and the highest aim for avoiding failure (dp = 054 [0.15, 0.92]). Its members are low on adaptive emotion regulation strategies (dp = −0.58 [−0.97, −0.18]) and high on maladaptive strategies (dp = 0.54 [0.14, 0.93]).
The perfectionist profile is difficult to distinguish from the excellencist profile with regard to attitude, self-reported ability, and the three statistics anxiety scores when we examine only mean values, as there is no discernable difference between the two profiles (dp = −0.03, −0.02, −0.13, 0.13, and 0.15 for these variables in that order). Here, we note that —not surprisingly— there is a difference on excellencism (dp = 0.80 [0.47, 1.13]) and major differences on perfectionism and ΔSCOPE (dp = 3.15 [2.67, 3.63]; and dp = −2.56 [−2.99, −2.12] respectively). The perfectionist profile also differs little from the excellencist profile regarding mastery (dp = 0.01 [−0.31, +0.33]) and avoidance (dp = −0.15 [−0.47, +0.17]) but aims more strongly for performance goals (dp = 0.80 [0.47, 1.14]). Finally, no visible mean difference with the excellencist profile is seen on the Cognitive Emotion regulation strategies scales (dp = −0.13 [−0.45, +0.19] and dp = 0.27 [−0.06, +0.59] for adaptive and maladaptive, respectively).
Differential Correlation Patterns Across Profiles
Finally, we are in a position to test H2. It holds that the association between interpretation of statistics anxiety and avoidance goals will be different for the Excellencists (null) than for the Perfectionists (positive). Similarly, the association between statistics anxiety and mastery goals will be negative for Excellencists but null for Perfectionists.
Figure 4 shows the relation between the QBCS goals and interpretation anxiety for the three profiles. The profiles are shown across columns whereas the three goals are shown across rows. All the scores have been standardized so that the means are zero; a positive correlation is visible when high scores on one variable co-occur with high scores on the other variable. As seen, for mastery goals (top row), its relation with statistics anxiety is significantly negative only for the Excellencist profile (r = −0.15, p = 0.03). It is near null for the other profiles. On the other hand, the relation involving avoidance goals and interpretation anxiety (bottom row) is positive for the Perfectionists and the low ability profiles (r = 0.23, p < 0.01; and r = 0.26, p < 0.01 respectively) but near null for the Excellencists (r = 0.09, p = 0.19). With regard to performance goals (central row), no discernable correlations are visible. The hypothesis H2 is supported by the results.
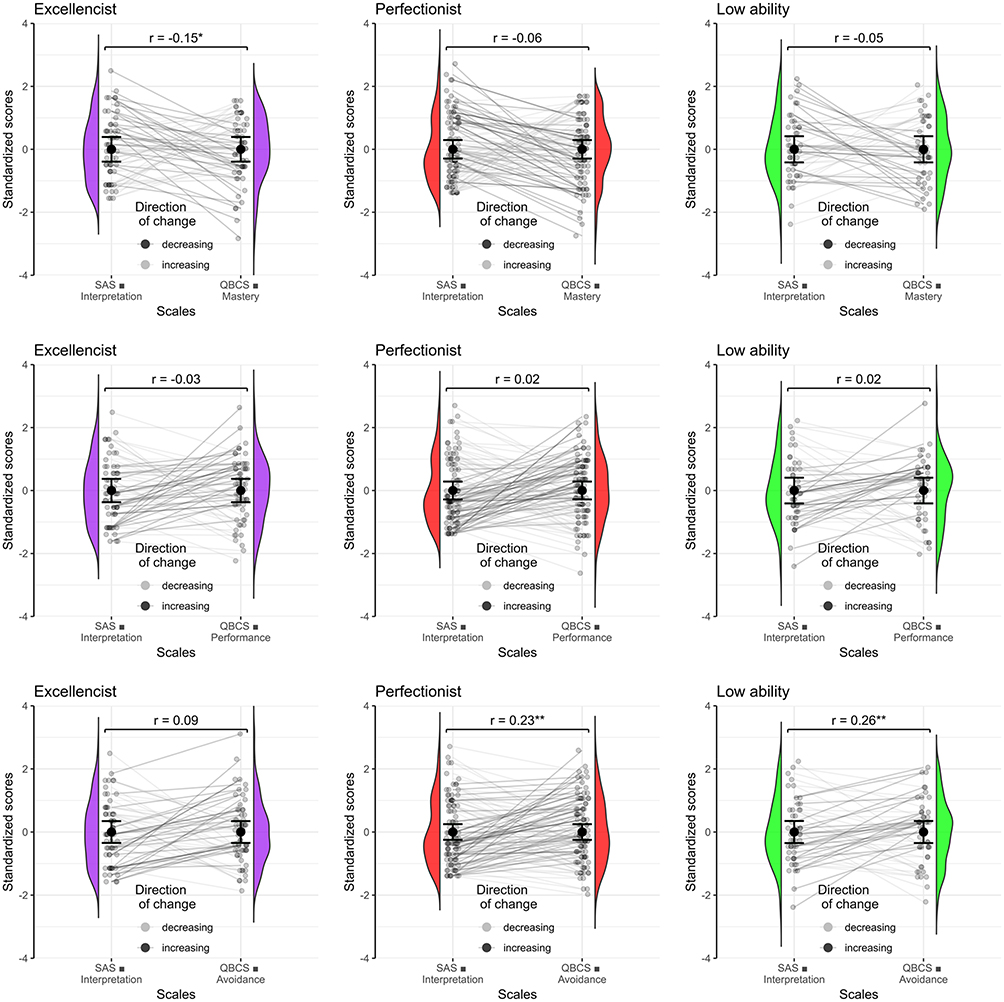 |
Figure 4 Relation of interpretation of statistics anxiety onto QBCS subscales (rows) for the three profiles (columns). Notes: The scores were standardized so that a negative correlation is visible when scores on one variable are high, the scores on the other variables are low. Colors of the profiles are the same as in Figure 3. The asterisks are the results of post-hoc Welch tests71 at the .05 level (*) and .01 level (**). |
As was seen in Figure 2, the correlations between interpretation anxiety in statistics and the two subscales of CERQ (adaptive and maladaptive) are .05 and .25, congruent with those reported in.13 We suggested in the Introduction that the near zero correlation for adaptive regulation strategies may in fact be hiding disparities between the profiles. When examined across profiles, the correlations vary substantially. Figure 5 presents the scores across profiles (columns) for the two subscales of CERQ (rows). Regarding maladaptive strategies, there is no notable relation for excellencists, but a strong positive relation for the Perfectionist profile (r = 0.35, p < 0.01) and a moderate association for the low ability profile (r = 0.14, p = 0.04). Thus, perfectionists who tend to be more anxious to interpret statistics report using more maladaptive emotion regulation strategies.
 |
Figure 5 Relation of interpretation of statistics anxiety onto CERQ subscales (rows) for the three profiles (columns). Notes: The scores were standardized so that a negative correlation is visible when scores on one variable are high, the scores on the other variables are low. Colors of the profiles are the same as in Figure 3. The asterisks are the results of post-hoc Welch tests71 at the .05 level (*) and .01 level (**). |
For adaptive regulation strategies, the correlation is weak and negative for Excellencists (r = −0.13, p = 0.09). Excellencists that are less anxious to interpret statistics are using more adaptive strategies. For the other two profiles, the more anxious they are to interpret statistics, the more they report using adaptive strategies (r = 0.24, p < 0.01; and r = 0.18, p < 0.01 for perfectionist and low ability profiles, respectively).
Over the two CERQ subscales, we see that Perfectionists use more strategies, whether they are adaptive or maladaptive. This result may sound awkward as one strategy should be reducing anxiety and the other, increasing anxiety. However, they are also the ones with large ΔSCOPE scores, that is, there may be something unsettled in the way they process emotions.
General Discussion
We examined the associations involving statistics anxiety with a special emphasis on anxiety of interpretation as it seems the aspect most related to understanding.11 We introduced measurements of perfectionism, with a special care to distinguish two sorts of high achievers, the excellencists and the perfectionists. A novel measure, ΔSCOPE suggests that the second type of high achievers may have difficulty with discriminating extreme wordings. This relates to other research where perfectionists were less capable of discerning emotions, and less apt to perform divergent thinking about emotions.25
A profile analysis suggested three profiles. These profiles suggest that excellencists and perfectionists can be distinguished on their mean scores on one outcome variable only (performance goals). Otherwise, participants with higher self-reported ability and higher interests toward statistics can be from either profile and report comparable levels of statistics anxiety.
Examining associations, it was possible to make further distinctions between the two profiles. Excellencists with lower anxiety to interpret statistics tend to seek more mastery goals. Perfectionists with higher anxiety to interpret statistics tend to seek avoidance goals more even though they score high on performance goals. Finally, excellencists that are anxious are the ones using less adaptive emotion regulation strategies. The anxious perfectionists on the other hand report more use of any sorts of strategies (adaptive as well as maladaptive).
In the present study, some correlations involving statistics anxiety subscales were expected. For example, those with higher scores on attitudes toward statistics also had lower statistics anxiety on all its subscales. The exception among the SATS subscales is the amount of work which is not related to evaluation and asking for help anxieties.41–44
The Single-Item Self-reported Statistics Ability (SISA) that was introduced herein behaved in a similar fashion to SATS: participants with higher self-reported ability reported having less anxiety. It was found in past research that the actual grade (an objective measure of ability) was likewise negatively correlated with statistics anxiety (Cantinotti et al9 reported almost identical correlations with final grades than what was obtained here with SISA). Not surprisingly, SISA positively correlated with mastery goals and negatively with avoidance goals. Surprisingly, SISA correlated with an enhanced use of adaptive emotion regulation strategies but was uncorrelated with maladaptive emotion regulation strategies (unlike statistic anxiety subscales which correlated with enhanced use of these strategies).
The novelty of the present study was to add measures of perfectionism and excellencism and examine their relations with statistics anxiety. Contradicting expectations, there was no relation that directly linked them to statistics anxiety. Mackinnon et al26 examined a larger sample (thus had higher statistical power), yet they likewise failed to uncover an association between rigid perfectionism and statistics anxiety. Excellencism was positively correlated with adaptive regulation strategies. However, and contrary to expectations, it was also positively associated with maladaptive regulation strategies.
Using ΔSCOPE, it was found that the ability to discriminate extreme wordings is negatively related to only interpretation anxiety in statistics. This may be due to the fact that interpretation is the only component of statistics learning needing nuanced wordings. The ability to discriminate extreme wordings is also negatively related to performance goals while being positively related to the goals which emphasize learning (ie, mastery goals). Previous research on academic motivation indicates that students who adopt mastery goals evaluate themselves in terms of their own progress rather than that of others, resulting in greater intrinsic motivation.47 Mastery goals also lead to a more positive and adaptive behavior than performance goals, which is known to provoke maladjustment.73–76 These relations are observed herein when examining the relations between CERQ and QBCS. Also, not surprisingly, ΔSCOPE is positively associated with adaptive emotion regulation strategies. According to previous research, maladaptive emotion regulation strategies are linked to higher statistics anxiety,13 which was corroborated in the present study.
Implications
The main message to retain is that striving is a bifurcation. For members of the perfectionist profile, many relations are opposite of what we find for excellencists. A preliminary assessment prior to any interventions aimed at reducing statistics anxiety should therefore first identify what profile best characterizes the student. Perfectionists seek to fulfill different goals (less mastery, more performance; less adaptive) and this is modulated by the strength of their anxiety. Mendes et al76 reviewed 11 studies using psychological intervention in trying to reduce statistics anxiety. They were unable to find a single study succeeding in this endeavor. It was possible to alter the attitudes towards statistics but not anxiety. It might have been useful to characterize the student’s profile with more nuances.
Speaking of nuance, weak ΔSCOPE scores could be implicated in the different relations observed. What exactly is measured by this variable remains an open question. It could reflect some verbal ability. However, it was associated with interpretation anxiety which was shown to relate to visual abilities.11,25 Another hypothesis is that it would measure discrimination of subtle concepts such as emotions. Congruent with this interpretation, Goulet-Pelletier et al37 found that participants high on the perfectionism measure had more difficulties generating creative responses in creativity tasks involving emotions. As a last alternative, it might be an indirect measure of general ability which would be involved in the interpretation of statistics. A fourth alternative that can be rejected is that ΔSCOPE would be related to reduce emotional reactions to words that generate arousal because there was no correlation with the affect subscale of SATS. Additional work is required to disentangle the possible explanations.
Whether an intervention might succeed in improving discrimination of emotions and identification of emotionallycharged situations is an open question. The results reiterate that striving for high standards commonly comes with high ability. However, one must strive for excellence rather than perfection, as there are clear downsides for engaging in performance goals, which come with perfectionism.30 Further, excellencists are significantly better at regulating their emotions by using adaptive strategies and this is supported by previous research that showed they are more adaptable than perfectionists.31
The third profile found in the analyses is possibly ill-defined. Gaudreau et al35 unearthed non-strivers, a category of individuals who exhibited low intrinsic motivation and little desire to perform. The present profile analysis identified low-ability participants. These low-ability individuals may be low strivers. However, given that we did not measure academic motivation, it is impossible to determine if they are a single profile or two distinct profiles.
Limitations
A limitation of this study is that a previously validated measure of statistics ability was not used. Indeed, it is unknown if the SISA is a valid measure of ability. How it correlated with SATS and SAS would suggest that it is a good proxy for actual abilities, but an external criterion is needed in future studies.
Also, the sample was composed of 210 participants, which is a rather small sample. However, the wide array of significant results suggests that it was a sufficient sample. It is noteworthy to mention that many of the effect sizes were large (with Cohen’s dp occasionally exceeding 1.0). Further, the profile analysis proposed a large proportion of perfectionists (almost half of the sample). The current sample is composed of university students mostly in social sciences (including psychological sciences) and biomedical sciences. It would be useful to compare the profiles obtained from a complementary sample with a larger representation of STEM disciplines. The contrasting, low-ability, profile was characterized by weak self-reported abilities in statistics which might be characteristic of social sciences. In a sample of STEM students, this profile would presumably be far less prevalent. It would be interesting to see what profiles would emerge from an LPA analysis.
Finally, it should be noted that this study is correlational. To better understand and ascertain the associations between the different variables and statistics anxiety, studies examining cause-and-effect relations would have been necessary. As it may be difficult to experimentally manipulate measures such as attitude towards statistics, another option would have been to do a longitudinal study to examine the relations between all variables and possible changes through time. However, mathematics anxiety, which often precedes statistics anxiety and is often preceded by spatial anxiety, appears as early as age 12.77,78 A longitudinal study is therefore difficult to envision if statistics anxiety has its root at such a young age.
Conclusion
Despite these limitations, this study offers new perspectives on statistics anxiety which provides novel avenues for potential future interventions. For example, to reduce statistics anxiety, students taking statistical methods courses should be advised to aim for realistic goals, and to strive for excellence rather than perfection. It would also be recommended to foster positive and favorable attitudes towards statistics, to aim for mastery rather than performance or avoidance goals and try to face anxiety with a problem-solving approach in order to implement adaptive rather than maladaptive emotion regulation strategies.
Keeping a positive attitude in anxiety-triggering courses might be easier to do for excellencists than for perfectionists, owing to their ability to detect extreme wordings. Again, this puts perfectionists at greater risk of experiencing distress in school. This might be more visible in statistics classes as this course generates higher levels of anxiety in social and psychological sciences. Whether these relations are the same in other, less anxiety-inducing, courses remains an open question.
Data Sharing Statement
The data and analysis scripts used for this article can be accessed on OSF (https://osf.io/5kyd6/overview).
Acknowledgments
The authors wish to thank Rose-Marie Gibeau for her comments on an earlier version of this text. This research was funded by research grants from the Conseil pour la Recherche en Sciences Naturelles et en Génie (RGPIN-2024-03733) and the Conseil pour la recherche en sciences humaines (430-2021-00037) granted to Denis Cousineau.
Author Contributions
All authors made a significant contribution to the work reported, whether that is in the conception, study design, execution, acquisition of data, analysis and interpretation, or in all these areas; took part in drafting, revising or critically reviewing the article; gave final approval of the version to be published; have agreed on the journal to which the article has been submitted; and agree to be accountable for all aspects of the work.
Disclosure
The authors report no conflicts of interest in this work.
References
1. Chew PK, Dillon DB. Statistics anxiety update: refining the construct and recommendations for a new research agenda. Perspect Psychol Sci. 2014;9(2):196–20. doi:10.1177/1745691613518077
2. Maat SM, Rosli MK. The Rasch model analysis for statistical anxiety rating scale (STARS). Creat Educ. 2016;7(18):2820–2828. doi:10.4236/ce.2016.718261
3. Siew CSQ, McCartney MJ, Vitevitch MS. Using network science to understand statistics anxiety among college students. Scholarsh Teach Learn Psychol. 2019;5(1):75–89. doi:10.1037/stl0000133
4. Messer WS, Griggs RA, Jackson SL. A national survey of undergraduate psychology degree options and major requirements. Teach Psychol. 1999;26(3):164–171. doi:10.1207/S15328023TOP260301
5. Stoloff M, McCarthy M, Keller L, et al. The undergraduate psychology major: an examination of structure and sequence. Teach Psychol. 2010;37(1):4–15. doi:10.1080/00986280903426274
6. Hellemans C. Stress, anxiety and adjustment processes in the face of an upcoming statistics exam. A comparative study of first- and second-year university students. L’orientation scolaire et professionnelle. 2004;33(1):141–170. doi:10.4000/osp.2253
7. Gaudreau P, Schellenberg BJ, Quesnel M. From theory to research: interpretational guidelines, statistical guidance, and a shiny app for the model of excellencism and perfectionism. Eur J Pers. 2024;38(5):839–860. doi:10.1177/08902070231221478
8. Cui S, Zhang J, Guan D, Zhao X, Si J. Antecedents of statistics anxiety: an integrated account. Pers Individ Differ. 2019;144:79–87. doi:10.1016/j.paid.2019.02.036
9. Cantinotti M, Lalande D, Ferlatte MA, Cousineau D. Validation de la version francophone du Questionnaire d’anxiété statistique (SAS-F-24). Can J Behav Sci. 2017;49(2):133–142. doi:10.1037/cbs0000074
10. Cousineau D, Harding B. Pourquoi les statistiques sont-elles difficiles à enseigner et à comprendre? Quelques réflexions. Revue de psychoéducation. 2017;46(2):397–419. doi:10.7202/1042257ar
11. Gibeau RM, Maloney EA, Béland S, et al. The correlates of statistics anxiety: relationships with spatial anxiety, mathematics anxiety and gender. J Numer Cogn. 2023;9(1):16–43. doi:10.5964/jnc.8199
12. Lalande D, Cantinotti M, Williot A, Gagnon J, Cousineau D. Three pathways from achievement goals to academic performance in an undergraduate statistics course. Stat Educ Res J. 2019;18(1):94–105. doi:10.52041/serj.v18i1.152
13. McIntee SE, Goulet-Pelletier JC, Williot A, et al. (Mal)adaptive cognitions as predictors of statistics anxiety. Stat Educ Res J. 2022;21(1):5. doi:10.52041/serj.v21i1.364
14. Field AP. Non-sadistical methods for teaching statistics. In: Upton D, Trapp A, editors. Teaching Psychology in Higher Education. New York: Blackwell publishing; 2010:134–163.
15. Trassi AP, Leonard SJ, Rodrigues LD, Rodas JA, Santos FH. Mediating factors of statistics anxiety in university students: a systematic review and meta-analysis. Ann N Y Acad Sci. 2022;1512(1):76–97. doi:10.1111/nyas.14746
16. March JJ, Hamilton D, McCormack D, Brisco R, Grech A. A network analysis of statistics anxiety symptoms and their antecedents in UK higher education students. Ann N Y Acad Sci. 2025;1547(1):220–232. doi:10.1111/nyas.15350
17. Onwuegbuzie AJ, Daley CE. Daley CE Perfectionism and statistics anxiety. Pers Individ Differ. 1999;26(6):1089–1102. doi:10.1016/S0191-8869(98)00214-1
18. Onwuegbuzie AJ, Da Ros D, Ryan JM. The components of statistics anxiety: a phenomenological study. Focus Learn Probl Math. 1997;19(4):11–35.
19. Baloğlu M. Individual differences in statistics anxiety among college students. Pers Individ Differ. 2003;34(5):855–865. doi:10.1016/S0191-8869(02)00076-4
20. Cruise RJ, Cash RW, Bolton DL. Development and validation of an instrument to measure statistical anxiety. In
21. Fullerton JA, Umphrey D. Statistics anxiety and math aversion among advertising students. J Advert Educ. 2016;20(1–2):135–143. doi:10.1177/10980482160201-216
22. Vigil-Colet A, Lorenzo-Seva U, Condon L. Development and validation of the statistical anxiety scale. Psicothema. 2008;20(1):174–180.
23. Birenbaum M, Eylath S. Who is afraid of statistics? Correlates of statistics anxiety among students of educational sciences. Educ Res. 1994;36(1):93–98. doi:10.1080/0013188940360110
24. Hoegler S, Nelson M. The influence of anxiety and self-efficacy on statistics performance: a path analysis. Psi Chi J Psychol Res. 2018;23(5):364–375. doi:10.24839/2325-7342.JN23.5.364
25. Gibeau RM, Béland S, Maloney EA, et al. The relation of spatial skills and spatial memory span with statistics anxiety. Br J Educ Psychol. 2026, In press. doi:10.1111/bjep.70063
26. Mackinnon SP, Alexander SM, Chen R, Cribbie RA, Flett GL, Hill TG. Perfectionism, anxiety sensitivity, and statistics anxiety: a test of the vulnerability-stress model using a 2-wave longitudinal study. J Res Pers. 2025;116:104611. doi:10.1016/j.jrp.2025.104611
27. Gaudreau P. On the distinction between personal standards perfectionism and excellencism: a theory elaboration and research agenda. Perspect Psychol Sci. 2019;14(2):197–215. doi:10.1177/1745691618797940
28. Hill AP, Witcher CSG, Gotwals JK, Leyland AF. A qualitative study of perfectionism among self-identified perfectionists in sport and the performing arts. Sport Exerc Perform Psychol. 2015;4(4):237–253.
29. Molnar DS, Blackburn M, Tacuri N, Zinga D, Flett GL, Hewitt PL. “I need to be perfect or else the world’s gonna end”: a qualitative analysis of adolescent perfectionists’ expression and understanding of their perfectionism. Can Psychol. 2023;64(4):320–334. doi:10.1037/cap0000357
30. Gaudreau P, Schellenberg BJI, Gareau A, Kljajic K, Manoni-Millar S. Because excellencism is more than good enough: on the need to distinguish the pursuit of excellence from the pursuit of perfection. J Pers Soc Psychol. 2022;122(6):1117–1145. doi:10.1037/pspp0000411
31. Gaudreau P, Boileau L, Schellenberg BJI. Peur de l’Échec à l’École et dans les Sports: apport du Modèle de l’Excellencisme et du Perfectionnisme. Revue québécoise de psychologie. 2021;42(3):173–194. doi:10.7202/1084584ar
32. Madigan DJ, Hill AP, Mallinson-Howard SH, Curran T, Jowett GE. Perfectionism and performance in sport, education, and the workplace. In: Oxford Research Encyclopedia of Psychology. Oxford: Oxford University Press; 2018.
33. Hewitt PL, Flett GL, Mikail SF. Perfectionism: A Relational Approach to Conceptualization, Assessment, and Treatment. New York: Guilford Press; 2017.
34. Blasberg JS, Hewitt PL, Flett GL, Sherry SB, Chen C. The importance of item wording: the distinction between measuring high standards versus measuring perfectionism and why it matters. J Psychoeduc Assess. 2016;34(7):702–717. doi:10.1177/0734282916653701
35. Gaudreau P, Racine P, Boivin T, Parent G, Boileau L, Schellenberg BJI. Striving for excellence or chasing perfection? Differential association with test anxiety for students in tertiary education [Manuscript submitted for publication]. School of psychology, University of Ottawa; 2024.
36. Goulet-Pelletier J-C, Cousineau D. The profiles of creative students. Think Skills Creat. 2022;44:101007. doi:10.1016/j.tsc.2022.101007
37. Goulet-Pelletier J-C, Beaudin M-F, Cousineau D. Investigating the negative link between perfectionism and emotional divergent thinking. Discov Psychol. 2025;5(1):9. doi:10.1007/s44202-025-00330-x
38. Gaudreau P, Schellenberg BJI. Scale of perfectionism and excellencism (SCOPE); 2018.
39. Elliot AJ. Approach and avoidance motivation and achievement goals. Educ Psychol. 1999;34(3):169–189. doi:10.1207/s15326985ep3403_3
40. Bouffard T, Vezeau C, Romano G, Chouinard R, Bordeleau L, Filion C. Élaboration et validation du Questionnaire des buts en contexte scolaire (QBCS). Can J Behav Sci. 1998;30(3):203. doi:10.1037/h0087063
41. Chiesi F, Primi C. Assessing statistics attitudes among college students: psychometric properties of the Italian version of the Survey of Attitudes toward Statistics (SATS). Learn Individ Differ. 2009;19(2):309–313. doi:10.1016/j.lindif.2008.10.008
42. Gal I, Ginsburg L, Schau C. Monitoring attitudes and beliefs in statistics education. In: Gal I, Garfield JB, editors. The Assessment Challenge in Statistics Education. New York: IOS Press; 1997:37–51.
43. Schau C, Stevens J, Dauphinee TL, Vecchio AD. The development and validation of the survey of attitudes toward statistics. Educ Psychol Meas. 1995;55(5):868–875. doi:10.1177/0013164495055005022
44. Vanhoof S, Kuppens S, Sotos AEC, Verschaffel L, Onghena P. Measuring statistics attitudes: structure of the survey of attitudes toward statistics (SATS-36). Stat Educ Res J. 2011;10(1):35–51. doi:10.52041/serj.v10i1.354
45. Bui NH, Alfaro MA. Statistics anxiety and science attitudes: age, gender, and ethnicity factors. Coll Stud J. 2011;45(3):573–585.
46. Delage V, Trudel G, Retanal F, Maloney EA. Spatial anxiety and spatial ability: mediators of gender differences in math anxiety. J Exp Psychol Gen. 2022;151(4):921–933. doi:10.1037/xge0000884
47. Danan Y, Ashkenazi S. The influence of sex on the relations among spatial ability, math anxiety and math performance. Trends Neurosci Educ. 2022;29:100196. doi:10.1016/j.tine.2022.100196
48. Voyer D, Voyer S, Bryden MP. Magnitude of sex differences in spatial abilities: a meta-analysis and consideration of critical variables. Psychol Bull. 1995;117(2):250–270. doi:10.1037/0033-2909.117.2.250
49. Haidt J. The Anxious Generation: How the Great Rewiring of Childhood Is Causing an Epidemic of Mental Illness. New York: Random House; 2024.
50. Garnefski N, Kraaij V, Spinhoven P. Negative life events, cognitive emotion regulation and emotional problems. Pers Individ Differ. 2001;30(8):1311–1327. doi:10.1016/S0191-8869(00)00113-6
51. Jermann F, Van der Linden M, d’Acremont M, Zermatten A. Cognitive emotion regulation questionnaire (CERQ). Eur J Psychol Assess. 2006;22(2):126–131. doi:10.1027/1015-5759.22.2.126
52. Schau C. Survey of Attitudes Toward Statistics (SATS-36); 2003.
53. Carillo K, Galy N, Guthrie C, Vanhems A. “J’aime pas les stats!” Mesure et analyse de l’attitude à l’égard du cours de statistique dans une école de management. Statistique et enseignement. 2016;7(1):3–31. doi:10.3406/staso.2016.1329
54. Schau C, Emmioğlu E. Do introductory statistics courses in the United States improve students’ attitudes? Stat Educ Res J. 2012;11(2):86–94. doi:10.52041/serj.v11i2.331
55. Núñez-Peña MI, Guilera G, Suárez-Pellicioni M. The single-item math anxiety scale: an alternative way of measuring mathematical anxiety. J Psychoeduc Assess. 2014;32(4):306–317. doi:10.1177/0734282913508528
56. Cousineau D. How many decimals? Rounding descriptive and inferential statistics based on measurement precision. J Math Psychol. 2020;97:102362. doi:10.1016/j.jmp.2020.102362
57. Jané MB, Xiao Q, Yeung SK, Ben-Shachar MS, Caldwell AR, Feldman G. Guide to effect sizes and confidence intervals; 2024.
58. Goulet-Pelletier J-C, Cousineau D. A review of effect sizes and their confidence intervals, Part I: the Cohen’s d family. Quant Meth Psych. 2018;14(4):242–265. doi:10.20982/tqmp.14.4.p242
59. Gruber J, Mendle J, Lindquist KA, et al. The future of women in psychological science. Perspect Psychol Sci. 2021;16(3):483–516. doi:10.1177/1745691620952789
60. American Psychological Association, Committee on Women in Psychology. The changing gender composition of psychology: update and expansion of the 1995 task force report; 2017. Available from: http://www.apa.org/women/programs/gender-composition/index.aspx.
61. King DA, Buchwald AM. Sex differences in subclinical depression: administration of the Beck Depression Inventory in public and private disclosure situations. J Pers Soc Psychol. 1982;42(5):963–969. doi:10.1037/0022-3514.42.5.963
62. Olff M, Langeland W, Draijer N, Gersons BP. Gender differences in posttraumatic stress disorder. Psychol Bull. 2007;133(2):183–204. doi:10.1037/0033-2909.133.2.183
63. Suarez EC. Sex differences in the relation of depressive symptoms, hostility, and anger expression to indices of glucose metabolism in nondiabetic adults. Health Psychol. 2006;25(4):484–492. doi:10.1037/0278-6133.25.4.484
64. Cousineau D, Goulet M-A, Harding B. Summary plots with adjusted error bars: the superb framework with an implementation in R. Adv Meth Pract Psych. 2021;4(3):25152459211035109.
65. Wei T, Simko V. R package ‘corrplot’: visualization of a Correlation Matrix (Version 0.95); 2024. Available from: https://github.com/taiyun/corrplot.
66. Huang F, Zheng S, Fu P, et al. Distinct classes of statistical anxiety: latent profile and network psychometrics analysis of university students. Psychol Res Behav Ma. 2023;16:2787–2802. doi:10.2147/PRBM.S417887
67. Bakk Z, Tekle FB, Vermunt JK. Estimating the association between latent class membership and external variables using bias-adjusted three-step approaches. Sociol Methodol. 2013;43(1):272–311. doi:10.1177/0081175012470644
68. Pastor DA, Barron KE, Miller BJ, Davis SL. A latent profile analysis of college students’ achievement goal orientation. Contemp Educ Psychol. 2007;32(1):8–47. doi:10.1016/j.cedpsych.2006.10.003
69. Wang M-C, Deng Q, Bi X, Ye H, Yang W. Performance of the entropy as an index of classification accuracy in latent profile analysis: a Monte Carlo simulation study. Acta Psychol Sin. 2017;49(11):1473–1482. doi:10.3724/SP.J.1041.2017.01473
70. Lo Y, Mendell NR, Rubin DB. Testing the number of components in a normal mixture. Biometrika. 2001;88(3):767–778. doi:10.1093/biomet/88.3.767
71. Delacre M, Lakens D, Leys C. Why psychologists should by default use Welch’s t-test instead of Student’s t-test. Int Rev Soc Psychol. 2017;30(1):92–101. doi:10.5334/irsp.82
72. Laurencelle L, Cousineau D. Analysis of frequency data: the ANOFA framework. Quant Meth Psych. 2023;19(2):173–193. doi:10.20982/tqmp.19.2.p173
73. Darnon B, Butera F. Buts d’accomplissement, stratégies d’étude, et motivation intrinsèque: présentation d’un domaine de recherche et validation française de l’échelle d’Elliot et McGregor. L’année psychologique. 2005;105(1):105–131. doi:10.3406/psy.2005.3821
74. Dweck CS. Motivational processes affecting learning. Am Psychol. 1986;41(10):1040–1048. doi:10.1037/0003-066X.41.10.1040
75. Elliot AJ, McGregor HA. A 2×2 achievement goal framework. J Pers Soc Psychol. 2001;80(3):501–519. doi:10.1037/0022-3514.80.3.501
76. Mendes RA, Loxton NJ, Browning NG, Lawrence RK. The effect of psychological interventions on statistics anxiety, statistics self-efficacy, and attitudes toward statistics in university students: a systematic review. Educ Psychol Rev. 2025;37(1):3. doi:10.1007/s10648-024-09979-7
77. Ramirez G, Shaw ST, Maloney EA. Math anxiety: past research, promising interventions, and a new interpretation framework. Educ Psychol. 2018;53(3):145–164. doi:10.1080/00461520.2018.1447384
78. Paechter M, Macher D, Martskvishvili K, Wimmer S, Papousek I. Mathematics anxiety and statistics anxiety. Shared but also unshared components and antagonistic contributions to performance in statistics. Front Psychol. 2017;8:1196. doi:10.3389/fpsyg.2017.01196
 © 2026 The Author(s). This work is published and licensed by Dove Medical Press Limited. The
full terms of this license are available at https://www.dovepress.com/terms
and incorporate the Creative Commons Attribution
- Non Commercial (unported, 4.0) License.
By accessing the work you hereby accept the Terms. Non-commercial uses of the work are permitted
without any further permission from Dove Medical Press Limited, provided the work is properly
attributed. For permission for commercial use of this work, please see paragraphs 4.2 and 5 of our Terms.
© 2026 The Author(s). This work is published and licensed by Dove Medical Press Limited. The
full terms of this license are available at https://www.dovepress.com/terms
and incorporate the Creative Commons Attribution
- Non Commercial (unported, 4.0) License.
By accessing the work you hereby accept the Terms. Non-commercial uses of the work are permitted
without any further permission from Dove Medical Press Limited, provided the work is properly
attributed. For permission for commercial use of this work, please see paragraphs 4.2 and 5 of our Terms.