Back to Journals » Clinical Interventions in Aging » Volume 12
Do older drivers with bilateral cataract self-regulate their driving while waiting for first eye cataract surgery?
Authors Agramunt S ![]() , Meuleners LB, Fraser ML, Chow KC, Ng JQ
, Meuleners LB, Fraser ML, Chow KC, Ng JQ ![]() , Raja V, Morlet N
, Raja V, Morlet N
Received 2 August 2017
Accepted for publication 22 September 2017
Published 8 November 2017 Volume 2017:12 Pages 1911—1920
DOI https://doi.org/10.2147/CIA.S148037
Checked for plagiarism Yes
Review by Single anonymous peer review
Peer reviewer comments 2
Editor who approved publication: Dr Richard Walker
Seraina Agramunt,1 Lynn B Meuleners,1 Michelle L Fraser,1 Kyle C Chow,1 Jonathon Q Ng,2,3 Vignesh Raja,4 Nigel Morlet2,3
1Curtin-Monash Accident Research Centre (C-MARC), Curtin University, Faculty of Health Sciences, Perth, Australia; 2Eye & Vision Epidemiology Research (EVER) Group, Perth, Australia; 3School of Population and Global Health, The University of Western Australia, Perth, Australia; 4Sir Charles Gairdner Hospital, Perth, Australia
Objectives: To analyze the association between visual impairment and driver self-regulation among a cohort of older drivers waiting for first eye cataract surgery.
Methods: Ninety-six drivers with bilateral cataract aged 55+ years were assessed before first eye cataract surgery. Data collection consisted of a researcher-administered questionnaire, objective visual measures (visual acuity, contrast sensitivity and stereopsis), a visual attention test (the useful field of view test) and a cognitive test (the Mini-Mental State Examination). Driver self-regulation practices were collected using the Driving Habits Questionnaire and were also measured with an in-vehicle monitoring device. Characteristics of self-regulators and non-self-regulators were compared and a logistic regression model was used to examine the association between 3 objective visual measures and driver self-regulation status.
Results: After controlling for potential confounding factors, only binocular contrast sensitivity (p=0.01), age (p=0.03) and gender (p=0.03) were significantly associated with driver self-regulation status. The odds of participants with better contrast sensitivity scores (better vision) self-regulating their driving in at least 1 driving situation decreased (odds ratio [OR]: 0.01, 95% CI: 0.00–0.28) while those of increasing age reported an increased odds of self-regulating their driving (OR: 1.08, 95% CI: 1.01–1.15). The odds of males self-regulating their driving was decreased compared with females (OR: 0.28, 95% CI: 0.09–0.86).
Conclusions: Worse binocular contrast sensitivity scores, increasing age and being female were significantly associated with driver self-regulation. The study highlighted that while self-regulation was common among cataract patients, a proportion of those with poor vision did not self-regulate. Further research should determine how cataract patients could benefit from self-regulation strategies while waiting for cataract surgery.
Keywords: driver self-regulation, older drivers, naturalistic data, cataract, contrast sensitivity, driving, visual impairment
Introduction
The aging population1 has seen an increase in the number of older drivers on Australian roads, with a 44% rise in the number of licensed drivers aged 65+ between 2005 and 2013.2 Recent research from the UK also showed that 11% of older drivers aged 65+ purchased a new vehicle and 14% purchased a second-hand vehicle in the last 2 years.3 As private transportation is the preferred mode of travel among the 65+ age group, it is predicted that >95% of people who will be aged 65+ in the next decade, will be active drivers.4 Driving contributes to older drivers’ quality of life, sense of independence5 and social participation,6 and driving cessation has been linked to depressive symptoms, mortality and admission to extended care institutions.7
Driver self-regulation refers to the situation in which older drivers modify their driving behaviours and avoid driving in situations that they usually find challenging, to compensate for age-related decline.8 This strategy allows older drivers to remain mobile while reducing their crash risk through lower exposure to difficult driving situations.9 Driver self-regulation has also been shown to be associated with gender (females), increasing age, poorer health, cognitive impairment, previous crashes, driving confidence and ability, as well as visual impairment.9–13
Driving is a complex activity that involves many aspects of visual function.14 Age-related cataract can affect these visual functions, therefore impacting on driving performance and crash risk.15 Despite an increase in the number of studies examining the self-regulation practices of older drivers in the last decade, only a few studies have analyzed the specific effects of cataract on driver self-regulation practices. One study using self-reported information found that older drivers with cataract were more likely to modify their driving exposure, in terms of the number of days and destinations traveled per week, compared with older drivers without cataract.16 However, there were no significant differences between groups in terms of kilometers traveled per week.16 Another study using self-reported information found that 48% of older drivers with bilateral cataract avoided driving in at least 1 challenging situation while waiting for cataract surgery.17 The most commonly avoided situation was driving at night time (40%), followed by driving on the freeway (12%), in the rain (9%) and parallel parking (8%).17 This study also examined the association between objective measures of visual impairment and driver self-regulation practices among cataract patients. It found that older drivers who self-regulated had poorer contrast sensitivity (the ability to distinguish between light versus dark contrast) in the worse eye and that visual acuity and stereopsis were not associated with self-regulation.17 Similarly, other studies examining the general older population also found that contrast sensitivity impairment was associated with driver self-regulation practices,18–20 driving exposure18,21 and crash involvement.22,23
It is now possible, due to technological advances, to objectively measure the naturalistic driving behavior of drivers. In-vehicle driver monitoring devices are small electronic devices that can be easily connected to a participant’s car in order to collect time-tagged global positioning system (GPS) data that provides a variety of driving information, including speed, location, distance, date of travel and start/stop times of trips. They can also be used to assess driver self-regulation practices.24 These devices have advantages over self-reported questionnaires or travel diaries as they provide objective measures of driving outcomes25 and participants consider them to be more convenient and practical to use than self-reported travel diaries or questionnaires.26–27 In-vehicle monitoring also overcomes the limitations of self-reported information/diaries such as recall bias.26
A growing body of evidence has found a lack of consistency between self-reported questionnaires and naturalistic driving data. For example, while some studies found that older drivers actually self-regulated their driving more than they reported,28,29 other studies found they self-regulated less than they reported.26 These findings suggest that using self-reported data from questionnaires alone is not a reliable method.
It is important to better understand whether older adults with cataract self-regulate their driving while waiting for first eye cataract surgery and how this relates to their visual impairment. Therefore, the aim of this study is to examine the association between objective visual measures and self-regulation practices in bilateral cataract patients using a combination of naturalistic driving methods and self-reported data, as they wait for first eye cataract surgery.
Methods
Participants
One hundred and eleven older drivers with bilateral cataract were recruited through 3 public ophthalmology clinics in Western Australia. Participants were recruited through direct contact by the ophthalmologists at the clinic or by an invitation letter. Eligible participants were drivers aged 55+ years, (53% males/47% females) diagnosed with bilateral cataract, who had never had cataract surgery previously and who did not have any other eye comorbidities (eg, macular degeneration, glaucoma, and retinopathy). They were also required to speak and understand English, to drive at least twice-weekly and have no cognitive or physical impairment (eg, dementia, Alzheimer’s disease, Parkinson’s disease, wheelchair user). Recruitment occurred from December 2014 to February 2017 and the assessments were undertaken in the month prior to first eye cataract surgery. The human research ethics committees of Curtin University and the participating hospitals granted ethics approval, and following the tenets of the Declaration of Helsinki, written informed consent was obtained from each participant before collecting any data.
Data collection
This study is part of a larger study titled “The Cataract Extraction and Driving Ability Research Study – The CEDAR study”.30 Participants completed a researcher-administered questionnaire (the Driving Habits Questionnaire [DHQ]16) and naturalistic driving data were collected by an in-vehicle monitoring device that was provided to each participant at the assessment. Three objective visual assessments were also administered to all participants. The assessment took place at Curtin University.
Measures
Objective visual measures
Three different objective visual tests were administered to the participants under standard conditions, constant luminance and without mydriasis. Participants wore their habitual correction for visual testing.
Visual acuity (monocular and binocular) was measured using an Early Treatment Diabetic Retinopathy Study31 acuity chart. The chart was standardized for a 3 m distance, used a letter by letter scoring method and scores were expressed on a logarithm of the minimum angle of resolution (logMAR) scale.
Contrast sensitivity (monocular and binocular) was measured using the Mars Letter Contrast Sensitivity Test,32 calibrated for a distance of 50 centimeters and scores were expressed in log units.
Stereopsis was assessed with the Titmus Fly Stereotest,33 which measures stereopsis from 4,800 to 20 seconds of arc. Scores were expressed as log seconds of arc.
Cognitive assessments
The useful field of view (UFOV) test34
Visual attention was measured using the UFOV test.34 This computer-based test is divided into 3 subtests assessing visual processing speed, divided attention and selective attention (Figure 1). It is a valid and reliable predictor of crash risk.35 In the first subtest (processing speed), participants had to identify a stimuli (either a car or a truck), which was briefly presented in the center of the screen. In the second subtest (divided attention), participants were required to look at 2 different targets at the same time and were requested to determine which target was presented in the center of the screen (a car or a truck) and then identify on which 1 of the 8 cardinal directions the other target was presented. The third subtest (selective attention) was similar to the second subtest. However, the 8 cardinal directions were surrounded by 47 small triangles, which were distractors. Participants had to use a mouse to select the stimuli. A raw score was calculated for each test based on the duration a participant took to identify correctly the objects presented at an accuracy level of 75%.
 | Figure 1 The useful field of view test, which includes assessing processing speed (A), divided attention (B) and selective attention (C). |
Mini-mental state examination (MMSE)
The MMSE36 was used to assess general cognitive function. It is a screening tool for cognitive impairment and scores range from 0 to 30 with higher scores indicating better cognitive function. The inclusion criterion was a score ≥24 on the MMSE, which indicates normal cognitive function.
Driving patterns and self-regulation
Self-reported driving measures
A researcher-administered questionnaire collected general information about participants’ socio-demographic characteristics and self-reported measures of driving patterns and self-regulation were collected using the DHQ.16 This questionnaire has been previously validated among a population of older drivers with bilateral cataract in Western Australia.37 Information collected included participants’ driving exposure, driving difficulty and avoidance, driving dependence and previous crashes. The driving difficulty and avoidance part of the questionnaire was used to collect information about participants’ self-regulation practices in 8 specific situations: “driving in the rain”, “driving alone”, “parallel parking”, “turning across oncoming traffic”, “driving on highways/freeways”, “on heavy traffic roads”, “in peak hour traffic” and “at night time”.
Only 4 of these driving situations obtained from the self-reported DHQ could be directly compared with the information obtained from the in-vehicle monitoring device. These 4 situations were used to classify participants as either self-regulating or non-self-regulating their driving in each of the driving situations. These situations included “driving on highways/freeways”, “on heavy traffic roads”, “in peak hour traffic” and “at night time”.
Naturalistic driving measures
All participants were provided with an in-vehicle monitoring device (Geotab GO6™, Oakville, Canada). (Figure 2).
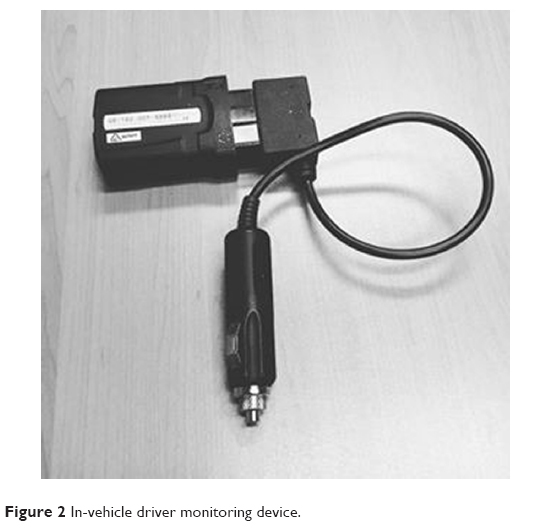 | Figure 2 In-vehicle driver monitoring device. |
Participants were asked to use it for a period of 7 days and to drive as they normally would. They were also instructed to only use it when they were the driver of the vehicle and were asked to move the device from one vehicle to another when using multiple vehicles or remove it if they were not the driver of the vehicle for that specific trip. The devices were manually connected to the On Board Diagnostic II port for vehicles manufactured from 2006 or the cigarette lighter for vehicles manufactured prior to 2006 (Figure 3). Participants were also provided with a travel diary that they were asked to complete after each trip. The following information was collected: date, start and finish time of a trip, kilometers traveled, age and position of the passengers (whether they sat in the front seat or the back passenger seat), make, model and year of the vehicle driven, and purpose of the trip. The diary was also used to validate that they had been the driver of the motor vehicle.
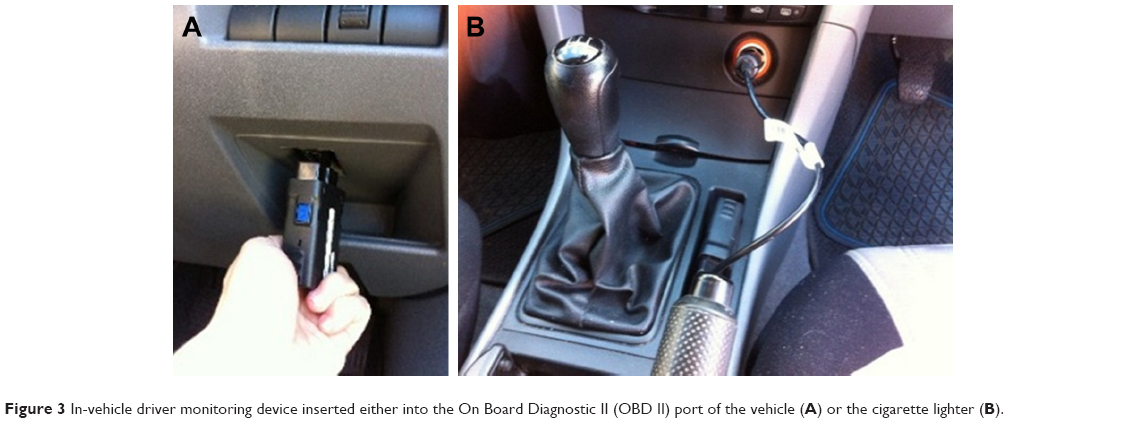 | Figure 3 In-vehicle driver monitoring device inserted either into the On Board Diagnostic II (OBD II) port of the vehicle (A) or the cigarette lighter (B). |
Participants were instructed to return the travel diary and the in-vehicle monitoring device at the end of the 7-day period in a pre-paid envelope. Participants were then interviewed to verify that there were no issues while using the device and that they were the only driver of the vehicle while using the device. The data from the devices was then read by Fleet management Software (MyGeotab, Oakville, Canada) and uploaded by the researchers to a secure server at the University. The data was cleaned in order to exclude trips made from the University, as they were not part of the participants’ typical driving behavior. Trips that lasted fewer than 10 seconds or 200 meters were also excluded in order to avoid “false trips”. The devices collected a variety of time stamped second-by-second GPS data, such as date of travel, location, type of roads used, start/stop times of trips, and distance traveled. Night time was defined as the period between sunset and sunrise. Peak hour was defined as driving between 6 and 9 am or between 4 and 7 pm, Monday to Friday. Each of the routes driven by participants were represented on an interactive map provided by Geotab, which identified whether participants drove on highways/freeways and/or heavy traffic roads. Heavy traffic roads were defined as roads where there were >4,000 vehicles per day per lane38 (Figure 4).
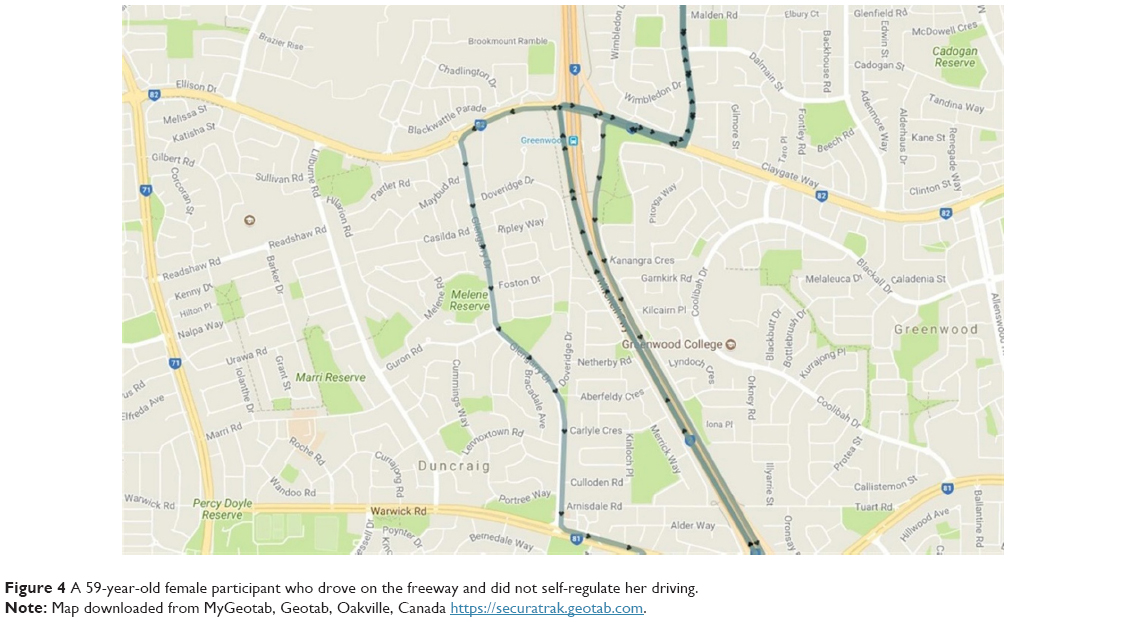 | Figure 4 A 59-year-old female participant who drove on the freeway and did not self-regulate her driving. |
Classification criteria for driver self-regulation
Each of the 4 challenging driving situations obtained from the DHQ and the in-vehicle monitoring devices were examined separately. For example: if a participant responded that they had not driven during peak hour traffic in the DHQ and this was confirmed by the data obtained from the in-vehicle monitoring device, then the participant was classified as a self-regulator for peak hour driving. Otherwise, they were considered to be a non-self-regulator for peak hour driving. This same procedure was undertaken for all 4 challenging driving situations. Finally, all 4 driving situations were examined for each participant. Participants were classified as a self-regulator if they had self-regulated their driving on at least 1 of the challenging driving situations.
Statistical analysis
Descriptive statistics were used to summarize the socio-demographic, visual characteristics and driving patterns of the cohort. Independent sample t-tests and chi-squared tests were initially used to compare the 2 groups. Cohen’s kappa coefficient was used to measure the relative agreement between the information obtained from the self-reported DHQ and the in-vehicle monitoring devices. A multivariate logistic regression model was then undertaken to analyze the association between driver self-regulation status and the 3 objective measures of vision (binocular visual acuity, binocular contrast sensitivity and stereopsis). The main outcome of interest was driver self-regulation status (did not drive in 1 or more driving situations due to vision: yes or no). The 3 objective measures of vision (binocular visual acuity, binocular contrast sensitivity and stereopsis) were entered as explanatory variables in the model, as well as age, gender, marital status, comorbidities, and the scores obtained from the MMSE. These variables were chosen as they have shown to be associated with driver self-regulation in the literature.9–13 Only the divided attention subtest was entered in the model as an explanatory variable due to multicollinearity among the 3 subtests of the UFOV.39 This subtest was selected as it was the strongest predictor of crash involvement among all subtests of the UFOV in previous research.19 The 3 measures of vision, the MMSE scores and the divided attention subtest were entered as continuous variables. Gender and marital status (single/de-facto or married) were entered as categorical variables in the model. All statistical analyses were performed with IBM SPSS Statistics 22.0 (SPSS Inc., Chicago, IL, USA).
Results
The final sample consisted of 96 participants. Fifteen of the 111 participants were excluded from the analysis due to poor data integrity from the in-vehicle monitoring device caused by faulty cigarette lighters and the loss of the monitoring devices. There was no significant difference between those who undertook the in-vehicle monitoring and those who did not in terms of age (p=0.45), gender (p=0.77), contrast sensitivity (p=0.74), visual acuity (p=0.65) and stereopsis (p=0.62).
Table 1 compares the characteristics of the drivers classified as self-regulators (n=39, 40.6%) and non-self-regulators (n=57, 59.4%). Self-regulators were older than non-self-regulators with an average age of 75.7 years (SD =8.9) and 71.9 years (SD =8.2), respectively (p<0.05). There were no significant differences between the 2 groups for any other socio-demographic characteristics. Fifty-six percent of self-regulators and 42.1% of non-self-regulators were female. For self-regulators, 46.2% were married/de-facto and 48.7% did not live alone and for non-self-regulators, 64.9% were married/de-facto and did not live alone. In addition, the majority of self-regulators (51.3%) and non-self-regulators (66.7%) had completed higher education. Self-regulators were also very similar to non-self-regulators in terms of years of driving experience (51.7 years [SD =13.4] and 51.1 years [SD =8.3], respectively), MMSE scores (27.9 [SD =2.0] and 27.6 [SD =2.2], respectively), number of co-morbidities (5.1 [SD =3.0] and 5.6 [SD =2.8], respectively), and number of medications taken (3.7 [SD =3.2] and 3.2 [SD =2.8], respectively). Co-morbidities included respiratory, musculoskeletal, endocrine and circulatory conditions. While self-regulators scored worse than non-self-regulators on the divided attention subtest of the UFOV (123.4 [SD =151.3] and 76.6 [SD =98.2], respectively), this difference was not significant.
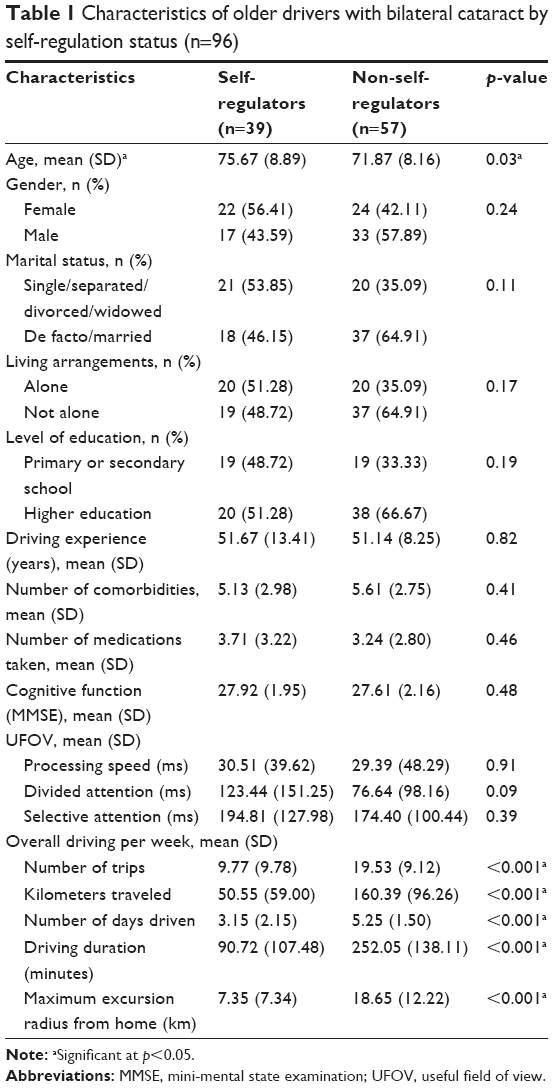 | Table 1 Characteristics of older drivers with bilateral cataract by self-regulation status (n=96) |
According to the information obtained from the in-vehicle monitoring devices, participants who were classified as self-regulators drove fewer days, less kilometers and made fewer trips per week than non-self-regulators (p<0.001). The duration of trips and the maximum excursion radius from home for the non-self-regulators were also longer than for the self-regulators (p<0.001) (Table 1).
Drivers who were classified as self-regulators had worse binocular contrast sensitivity scores, seeing approximately 2 letters less than drivers who were classified as non-self-regulators (p<0.05). There were no significant differences between the 2 groups in any of the other visual measures that included visual acuity and stereopsis (Table 2).
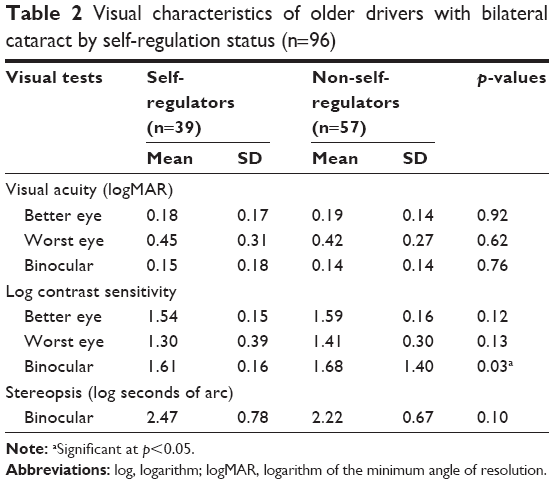 | Table 2 Visual characteristics of older drivers with bilateral cataract by self-regulation status (n=96) |
Overall, 11.5% of participants (n=11) did not meet Australian visual acuity standards for driving.40 These 11 participants had a visual acuity poorer than 6/12 (0.30 logMAR) when measured with each eye alone and with both eyes together (with the aid of spectacles or lenses if needed). More specifically, among the 39 participants classified as self-regulators, 15.4% of participants did not meet Australian visual acuity standards for driving (n=6). However, among the 57 older drivers classified as non-self-regulators, 8.8% of participants (n=5) did not meet Australian visual acuity standards for driving.
Forty-one percent of the cohort (n=39) were classified as self-regulators since they self-regulated their driving on at least one of the four challenging driving situations as confirmed by the DHQ and driver monitoring device. For each of the four situations specifically, 31.3% (n=30) of participants self-regulated their driving at night, 10.4% (n=10) did not drive in peak hour traffic, 9.4% (n=9) did not drive on heavy traffic roads, and 8.3% (n=8) avoided freeway/highway driving. Overall, 25.0% (n=24) of participants self-regulated their driving on 1 challenging driving situation only, 12.5% (n=12) on 2 driving situations, 1.0% (n=1) on 3 driving situations, and 2.0% (n=2) self-regulated on all 4 driving situations.
When comparing the agreement between the DHQ self-reported information and the in-vehicle monitoring device data for each of the challenging driving situations there was minimal agreement for peak hour driving (Kappa 0.17, p=0.09), driving on the freeway/highway (Kappa 0.07, 0=0.30), and driving on heavy traffic roads (Kappa 0.13, p=0.16). However, for night time driving, there was agreement between the self-reported DHQ and the in-vehicle monitoring device (Kappa 0.30, p<0.001).
Multivariate analysis
Table 3 presents the results of the multivariate logistic regression model analyzing the association between visual measures and self-regulation status. The model explained 30.90% of the variance (R2). After controlling for potential confounding factors, only binocular contrast sensitivity (p=0.01), age (p=0.03) and gender (p=0.03) were significantly associated with driver self-regulation status. The odds of participants with better contrast sensitivity scores (better vision) self-regulating their driving in at least 1 driving situation decreased (odds ratio [OR]: 0.01, 95% CI: 0.00–0.28) while those of increasing age reported an increased odds of self-regulating their driving (OR: 1.08, 95% CI: 1.01–1.15). The odds of males self-regulating their driving was decreased compared with females (OR: 0.28, 95% CI: 0.09–0.86). Neither binocular visual acuity (p=0.270), nor stereopsis (p=0.135) were significantly associated with self-regulation status.
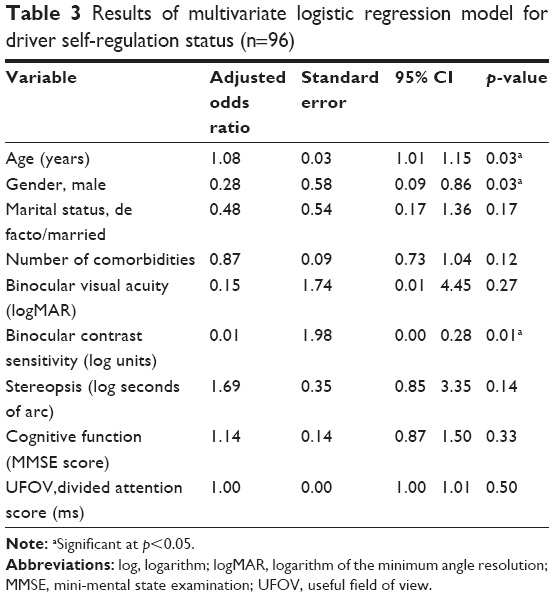 | Table 3 Results of multivariate logistic regression model for driver self-regulation status (n=96) |
Discussion
This is one of the first studies to specifically examine whether older drivers with cataract self-regulate their driving while waiting for first eye surgery using a combination of naturalistic driving data and self-reported information from the DHQ. The study found that 40.60% of participants were classified as self-regulating their driving prior to first eye cataract surgery in at least 1 challenging driving situation. This is consistent with Fraser et al17 who found that 47.5% of older drivers with bilateral cataract waiting for cataract surgery in Western Australia were also classified as self-regulators. While that study also used the DHQ and a comparable definition of self-regulation, it relied on self-reported information only to assess self-regulation practices, which may be subject to recall and social desirability bias.
Our study also found that older drivers aged 55+ years with worse binocular contrast sensitivity scores were more likely to self-regulate their driving than those who had better contrast sensitivity scores. This finding is consistent with previous research among cataract patients, which found that there was a significant difference in worse eye contrast sensitivity scores between self-regulators and non-self-regulators.17 Similarly, other studies among the general population of older drivers, also found an association between contrast sensitivity impairment and self-regulation practices.18,20 Contrast sensitivity is important for driving as many objects on the road are represented in low contrast41 and contrast sensitivity is frequently impaired among people with cataract.14 No significant association between visual acuity and driver self-regulation was found, which is consistent with previous research.17 This is of importance for road safety policy makers and licensing authorities who mainly rely on visual acuity for assessing fitness to drive, despite the significance of contrast sensitivity being highlighted in a large body of research.17,20,21,23,42 As the population is aging,1 there will be an increased number of older drivers on the roads. It is therefore a priority to investigate how licensing authorities could benefit from using additional measures of vision, such as contrast sensitivity tests to improve road safety.
In this study, the likelihood of self-regulating was associated with increasing age. This is consistent with previous research using self-report methods, which showed that older age was associated with driving less kilometers.12 This may be due to lower mobility, frailty, poor health43 and lower levels of function44 associated with aging.
Females were also more likely to self-regulate their driving than males, which is consistent with previous research.5,13,45,46 This may be explained by the fact that men report more confidence in their driving abilities, find driving more enjoyable and important to them46 and have less driving difficulties than women.13
A strength of the study was the large sample size (n=96) compared with similar studies24,26,29 as well as the use of a combination of naturalistic and self-reported data in order to gain an accurate picture of driver self-regulation due to cataract. Naturalistic driving data provide valid information on driving outcomes,25 which can be of higher quality and accuracy than self-reported data.47 For example, 9 participants did not drive at all in any of the challenging driving situations according to the naturalistic data, but the self-reported data revealed that only 3 people reported that they were deliberately self-regulating in all driving situations. It was also not possible to determine, using naturalistic data alone, whether participants deliberately self-regulated their driving in a particular situation or they simply have no need or desire to drive. While naturalistic information may be superior to self-report in terms of objective measurement of variables such as driving exposure, it does not provide contextual information about the driving situation itself. This study demonstrated that to better understand the context of driver self-regulation, there may be a role for self-report information, particularly when used in conjunction with objective naturalistic data.
There were limitations to this study. Participants consisted of a convenience sample who volunteered for the study. In addition, it is possible that some participants with poorer vision did not wish to take part in the study, fearing that their drivers license might be suspended. The definition of “self-regulator” in this study was based on only 4 challenging driving situations in the DHQ as it was not possible to determine whether participants avoided situations such as driving alone or in the rain from the naturalistic data. Therefore, the results of the study may have underestimated the true number of people who self-regulate their driving while waiting for first eye cataract surgery. Future research should include a wider range of challenging situations that are known to be problematic for older drivers such as intersections45 and long-distance driving,8 which can be obtained from in-vehicle monitoring devices. Furthermore, participants’ driving exposure was measured over a period of 7 days, which might not be representative of their usual driving patterns, due to specific circumstances such as health issues or environmental conditions such as the weather.48 However, other naturalistic studies have used a 7-day time period, which is the same as our study.24,26,29
Overall, this study highlighted that 40.6% of bilateral cataract patients awaiting cataract surgery self-regulated their driving in at least 1 challenging driving situation and that this self-regulation was associated with poorer vision (contrast sensitivity). While this is promising, nearly 10% of those who did not meet the minimum visual standards for driving in Western Australia, did not self-regulate their driving. This suggests that while self-regulation is common among cataract patients, a proportion with poor vision do not self-regulate. Therefore, promoting the use of self-regulation strategies could be a way to enhance road safety among older drivers while they are waiting for cataract surgery.
Conclusion
This study found that worse binocular contrast sensitivity scores, increasing age and being female were significantly associated with driver self-regulation among bilateral cataract patients awaiting first eye surgery. It also highlighted that while driver self-regulation was common, a proportion of those with poor vision did not self-regulate. Further research should determine how cataract patients could benefit from educational intervention programs promoting the use of self-regulation strategies while waiting for cataract surgery.
Acknowledgments
The authors thank all participants who volunteered. Financial support was provided by Curtin University, through an International Postgraduate Research Scholarship (#52423).
Disclosure
The authors report no conflicts of interest in this work.
References
United Nations, Department of Economic and Social Affairs, Population Division. World Population Prospects: The 2015 Revision, Volume I: Comprehensive Tables. UNDESA, USA; 2015. | ||
Bureau of Infrastructure, Transport and Regional Economics (BITRE). Road Safety of Older Australians: Recent Statistics. BITRE, Canberra; 2014. | ||
Statista. Cars Bought in the UK by Gender and Age, 2016. Available from: http://www.statista.com/statistics/300027/cars-bought-inunited-kingdom-by-gender-and-age/. Accessed July 30, 2017. | ||
Rosenbloom S. Roadblocks Ahead for Seniors Who Don’t Drive. Washington DC: Urban Institute; 2013. | ||
Gwyther H, Holland C. The effect of age, gender and attitudes on self-regulation in driving. Accid Anal Prev. 2012;45:19–28. | ||
Pristavec T. Social participation in later years: the role of driving mobility. J Gerontol B Psychol Sci Soc Sci. Epub 2016 May 12. | ||
Chihuri S, Mielenz TJ, DiMaggio CJ, et al. Driving cessation and health outcomes in older adults. J Am Geriatr Soc. 2016;64(2):332–341. | ||
Sullivan KA, Smith SS, Horswill MS, Lurie-Beck JK. Older adults’ safety perceptions of driving situations: towards a new driving self-regulation scale. Accid Anal Prev. 2011;43(3):1003–1009. | ||
Ball K, Owsley C, Stalvey B, Roenker DL, Sloane ME, Graves M. Driving avoidance and functional impairment in older drivers. Accid Anal Prev. 1998;30(3):313–322. | ||
Baldock MR, Mathias JL, McLean AJ, Berndt A. Self-regulation of driving and its relationship to driving ability among older adults. Accid Anal Prev. 2006;38(5):1038–1045. | ||
Barrett AE, Gumber C, Douglas R. Explaining gender differences in self-regulated driving: what roles do health limitations and driving alternatives play? Ageing Soc. 2017;1–24. | ||
Braitman KA, Williams AF. Changes in self-regulatory driving among older drivers over time. Traffic Inj Prev. 2011;12(6):568–575. | ||
Conlon EG, Rahaley N, Davis J. The influence of age-related health difficulties and attitudes toward driving on driving self-regulation in the baby boomer and older adult generations. Accid Anal Prev. 2017;102:12–22. | ||
Owsley C, McGwin G Jr. Vision and driving. Vision Res. 2010;50(23):2348–2361. | ||
Anstey KJ, Wood J, Lord S, Walker JG. Cognitive, sensory and physical factors enabling driving safety in older adults. Clin Psychol Rev. 2005;25(1):45–65. | ||
Owsley C, Stalvey B, Wells J, Sloane ME. Older drivers and cataract: driving habits and crash risk. J Gerontol A Biol Sci Med Sci. 1999;54(4):M203–M211. | ||
Fraser ML, Meuleners LB, Ng JQ, Morlet N. Driver self-regulation and depressive symptoms in cataract patients awaiting surgery: a cross-sectional study. BMC Ophthalmol. 2013;13(1):45. | ||
Freeman EE, Muñoz B, Turano KA, West SK. Measures of visual function and their association with driving modification in older adults. Invest Ophthalmol Vis Sci. 2006;47(2):514–520. | ||
Rubin GS, Ng ES, Bandeen-Roche K, Keyl PM, Freeman EE, West SK. A prospective, population-based study of the role of visual impairment in motor vehicle crashes among older drivers: the SEE study. Invest Ophthalmol Vis Sci. 2007;48(4):1483–1491. | ||
Molnar LJ, Charlton JL, Eby DW, et al. Factors affecting self-regulatory driving practices among older adults. Traffic Inj Prev. 2014;15(3):262–272. | ||
Sandlin D, McGwin G Jr, Owsley C. Association between vision impairment and driving exposure in older adults aged 70 years and over: a population-based examination. Acta Ophthalmol. 2014;92(3):e207–e212. | ||
Owsley C, Stalvey BT, Wells J, Sloane ME, McGwin G Jr. Visual risk factors for crash involvement in older drivers with cataract. Arch Ophthalmol. 2001;119(6):881–887. | ||
Huisingh C, Levitan EB, Irvin MR, MacLennan P, Wadley V, Owsley C. Visual sensory and visual-cognitive function and rate of crash and near-crash involvement among older drivers using naturalistic driving data. Invest Ophthalmol Vis Sci. 2017;58(7):2959–2967. | ||
Blanchard RA, Myers AM. Examination of driving comfort and self-regulatory practices in older adults using in-vehicle devices to assess natural driving patterns. Accid Anal Prev. 2010;42(4):1213–1219. | ||
Huebner KD, Porter MM, Marshall SC. Validation of an electronic device for measuring driving exposure. Traffic Inj Prev. 2006;7(1):76–80. | ||
Blanchard RA, Myers AM, Porter MM. Correspondence between self-reported and objective measures of driving exposure and patterns in older drivers. Accid Anal Prev. 2010;42(2):523–529. | ||
Marshall SC, Wilson KG, Man-Son-Hing M, et al. The Canadian Safe Driving Study-Phase I pilot: examining potential logistical barriers to the full cohort study. Accid Anal Prev. 2013;61:236–244. | ||
Hanson TR, Hildebrand ED. Are age-based licensing restrictions a meaningful way to enhance rural older driver safety? The need for exposure considerations in policy development. Traffic Inj Prev. 2011;12(1):24–30. | ||
Thompson JP, Baldock MR, Mathias JL, Wundersitz LN. A comparison of reported driving self-regulation by older adults and GPS-based measurements of their actual driving exposure. Road Transp Res. 2016;25(3):16. | ||
Meuleners LB, Agramunt S, Ng JQ, et al. The Cataract Extraction and Driving Ability Research Study Protocol: characterisation of deficits in driving performance and self-regulation among older drivers with bilateral cataract. Inj Prev. 2015;21(6):424–429. | ||
Ferris FL 3rd, Kassoff A, Bresnick GH, Bailey I. New visual acuity charts for clinical research. Am J Ophthalmol. 1982;94(1):91–96. | ||
Dougherty BE, Flom RE, Bullimore MA. An evaluation of the Mars letter contrast sensitivity test. Optometry Vision Sci. 2005;1;82(11):970–975. | ||
Paudel N. Longitudinal development of binocular visual acuity, stereopsis and global motion perception in preschool children born at risk of neonatal hypoglycaemia. Doctoral dissertation, ResearchSpace. Auckland: University of Auckland Research Repository; 2016. | ||
Ball K, Owsley C. The useful field of view test: a new technique for evaluating age-related declines in visual function. J Am Optom Assoc. 1993;64(1):71–79. | ||
Clay OJ, Wadley VG, Edwards JD, Roth DL, Roenker DL, Ball KK. Cumulative meta-analysis of the relationship between useful field of view and driving performance in older adults: current and future implications. Optom Vis Sci. 2005;82(8):724–731. | ||
Folstein MF, Folstein SE, McHugh PR. “Mini-mental state”. A practical method for grading the cognitive state of patients for the clinician. J Psychiatr Res. 1975;12(3):189–198. | ||
Fraser ML, Meuleners LB, Lee AH, Ng JQ, Morlet N. Which visual measures affect change in driving difficulty after first eye cataract surgery? Accid Anal Prev. 2013;58:10–14. | ||
Mainroads. Traffic Management at Roadworks on State Roads. Policy and application guidelines. D15#486558. Mainroads, Western Australia. 2015. | ||
Tabachnick BG, Fidell LS. Using multivariate statistics. 6th ed. Boston: Pearson Education; 2013. | ||
Austroads. Assessing fitness to drive for commercial and private vehicle drivers. Medical standards for licensing and clinical management guidelines a resource for health professionals in Australia. As amended up to August 2017. Sydney: Austroads Ltd; 2017. | ||
van Rijn LJ, Nischler C, Michael R, et al. Prevalence of impairment of visual function in European drivers. Acta Ophthalmol. 2011;89(2):124–131. | ||
Wood JM, Horswill MS, Lacherez PF, Anstey KJ. Evaluation of screening tests for predicting older driver performance and safety assessed by an on-road test. Accid Anal Prev. 2013;50:1161–1168. | ||
Dickerson AE, Molnar LJ, Eby DW, et al. Transportation and aging: a research agenda for advancing safe mobility. Gerontologist. 2007;47(5):578–590. | ||
Coxon K, Chevalier A, Lo S, Ivers R, Brown J, Keay L. Behind the wheel: predictors of driving exposure in older drivers. J Am Geriatr Soc. 2015;63(6):1137–1145. | ||
Oxley J, Fildes B, Corben B, Langford J. Intersection design for older drivers. Transp Res Part F Traffic Psychol Behav. 2006;9(5):335–346. | ||
Wong IY, Smith SS, Sullivan KA. Psychosocial factors significantly predict driving self regulation in Australian older adults. Australas J Ageing. 2016;35(2):133–138. | ||
Bohte W, Maat K. Deriving and validating trip purposes and travel modes for multi-day GPS-based travel surveys: a large-scale application in the Netherlands. Transport Res C Emer. 2009;17(3):285–297. | ||
Kilpeläinen M, Summala H. Effects of weather and weather forecasts on driver behaviour. Transp Res Part F Traffic Psychol Behav. 2007;10(4):288–299. |
 © 2017 The Author(s). This work is published and licensed by Dove Medical Press Limited. The
full terms of this license are available at https://www.dovepress.com/terms
and incorporate the Creative Commons Attribution
- Non Commercial (unported, 3.0) License.
By accessing the work you hereby accept the Terms. Non-commercial uses of the work are permitted
without any further permission from Dove Medical Press Limited, provided the work is properly
attributed. For permission for commercial use of this work, please see paragraphs 4.2 and 5 of our Terms.
© 2017 The Author(s). This work is published and licensed by Dove Medical Press Limited. The
full terms of this license are available at https://www.dovepress.com/terms
and incorporate the Creative Commons Attribution
- Non Commercial (unported, 3.0) License.
By accessing the work you hereby accept the Terms. Non-commercial uses of the work are permitted
without any further permission from Dove Medical Press Limited, provided the work is properly
attributed. For permission for commercial use of this work, please see paragraphs 4.2 and 5 of our Terms.