Back to Journals » International Journal of Chronic Obstructive Pulmonary Disease » Volume 13
Distinct pain profiles in patients with chronic obstructive pulmonary disease
Authors Bentsen SB, Miaskowski C, Cooper BA, Christensen VL ![]() , Henriksen AH, Holm AM, Rustøen T
, Henriksen AH, Holm AM, Rustøen T
Received 28 August 2017
Accepted for publication 28 December 2017
Published 6 March 2018 Volume 2018:13 Pages 801—811
DOI https://doi.org/10.2147/COPD.S150114
Checked for plagiarism Yes
Review by Single anonymous peer review
Peer reviewer comments 3
Editor who approved publication: Prof. Dr. Richard Russell
Signe B Bentsen,1 Christine Miaskowski,2 Bruce A Cooper,3 Vivi L Christensen,4,5 Anne H Henriksen,6 Are M Holm,7,8 Tone Rustøen5,9
1Department of Quality and Health Technology, Faculty of Health Sciences, University of Stavanger, Stavanger, Norway; 2Department of Physiological Nursing, University of California, San Francisco, CA, USA; 3Department of Community Health Systems, University of California, San Francisco, CA, USA; 4Department of Master and Postgraduate Studies, Lovisenberg Diaconal University College, Oslo, Norway; 5Department of Research and Development, Division of Emergencies and Critical Care, Oslo University Hospital, Oslo, Norway; 6Department of Circulation and Medical Imaging, St Olav’s University Hospital, Trondheim, Norway; 7Department of Respiratory Medicine, Oslo University Hospital, Oslo, Norway; 8Institute of Clinical Medicine, Faculty of Medicine, University of Oslo, Oslo, Norway; 9Department of Nursing Science, Institute of Health and Society, University of Oslo, Oslo, Norway
Background: Few studies have examined changes in the pain experience of patients with COPD and predictors of pain in these patients.
Objectives: The objectives of the study were to examine whether distinct groups of COPD patients could be identified based on changes in the occurrence and severity of pain over 12 months and to evaluate whether these groups differed on demographic, clinical, and pain characteristics, and health-related quality of life (HRQoL).
Patients and methods: A longitudinal study of 267 COPD patients with very severe COPD was conducted. Their mean age was 63 years, and 53% were females. The patients completed questionnaires including demographic and clinical variables, the Brief Pain Inventory, and the St Georges Respiratory Questionnaire at enrollment, and 3, 6, 9, and 12 months follow-up. In addition, spirometry and the 6 Minute Walk Test were performed. Latent class analysis was used to identify subgroups of patients with distinct pain profiles based on pain occurrence and worst pain severity.
Results: Most of the patients (77%) reported pain occurrence over 12 months. Of these, 48% were in the “high probability of pain” group, while 29% were in the “moderate probability of pain” group. For the worst pain severity, 37% were in the “moderate pain” and 39% were in the “mild pain” groups. Females and those with higher body mass index, higher number of comorbidities, and less education were in the pain groups. Patients in the higher pain groups reported higher pain interference scores, higher number of pain locations, and more respiratory symptoms. Few differences in HRQoL were found between the groups except for the symptom subscale.
Conclusion: Patients with COPD warrant comprehensive pain management. Clinicians may use this information to identify those who are at higher risk for persistent pain.
Keywords: chronic obstructive pulmonary disease, patient-reported outcomes, pain, pain occurrence, worst pain severity, latent profile analysis
Introduction
Pain is a common symptom in patients with COPD, but there is a high variation in the estimates of both the occurrence and the severity of pain in individuals with COPD.1–5 Across two studies,1,6 the occurrence of pain ranged from 34% to 53% in patients with moderate COPD, from 24% to 31% in those with severe COPD, and from 16% to 42% in those with very severe COPD. Similarly, between 21% and 96% of COPD patients report pain with severity scores in the moderate to severe range.1–5
While cross-sectional studies provide insights about pain in COPD patients, only three studies have evaluated longitudinal changes in pain occurrence and severity.7–9 In a community sample of COPD patients,7 46% reported pain at enrollment and 48% after two years. In another study,8 the occurrence of pain was 74% before hospitalization and decreased to 54% two weeks after discharge. Finally, in a sample of COPD patients admitted to hospice,9 82% had pain on admission and 28% had pain control within 24 hours. Across these three studies,7–9 16%–31% of the patients reported mild pain and 20%–63% reported moderate to severe pain. While these findings suggest that pain persists in COPD patients, none of these studies evaluated for changes in the occurrence and severity of pain and in patients at different stages of their disease. Therefore, longitudinal studies are needed to characterize changes over time in the occurrence and severity of pain in COPD patients in various stages of the disease.
Eight studies evaluated the relationships between demographic and clinical characteristic and pain in COPD patients.1,2,6,10–14 While no sex and age differences were found in two studies,13,14 in other studies females had a higher prevalence of pain.1 Moreover, younger patients reported more severe pain.2,10 Regarding the relationships between pain and body mass index (BMI) and comorbidities, previous findings are inconclusive. While three studies found no association between pain and BMI,10,13,14 other studies of COPD patients found that pain was associated with higher BMI,12 as well as with a higher number of comorbidities.6,12 While no associations were found between lung function or smoking and pain in two studies,6,10 in a recent study1 patients with better lung function reported more severe pain. In addition, COPD patients with pain had lower levels of physical function.12
Health-related quality of life (HRQoL) provides insights into the disease as well as patients’ health status.15–18 Three studies have evaluated the relationship between pain and HRQoL in patients with COPD.6,13,19 One study6 found a significant association between pain occurrence and respiratory symptoms, while another study found a significant association between pain occurrence and pain severity, and overall health status,13 by contrast, in another study19 no association was found between worst pain severity and overall health status.
In several studies,1,10,11,20–22 the authors commented that the occurrence, severity, and risk factors for pain in patients with COPD were rather heterogeneous. Although two studies reported changes over time in the occurrence and severity of pain,7,8 neither of these studies evaluated demographic and clinical characteristics, and HRQoL associated with this variability. These limitations highlight the need for additional research on changes in and characteristics associated with the occurrence and severity of pain in patients with COPD. Therefore, the purposes of the present study were to examine whether distinct groups of COPD patients could be identified based on changes in self-reports of pain occurrence and severity over 12 months and to evaluate whether these groups differed on a number of demographic, clinical, and pain characteristics, as well as HRQoL.
Patients and methods
Patients, settings, and study procedures
This longitudinal study is a follow-up study of 267 COPD patients (ClinicalTrials.gov identification: NCT01016587).1 In brief, patients were enrolled from three outpatient clinics and one referral hospital in the Norwegian Health Region Southeast from December 2009 until October 2012. A research nurse explained the purpose of the study at enrollment, and written informed consent was obtained from all patients. The inclusion criteria were >18 years of age; diagnosed with moderate (grade II), severe (grade III), or very severe (grade IV) COPD according to the Global Initiative for Chronic Obstructive Lung disease (GOLD);23 able to read and understand Norwegian; and had no cognitive impairments. The patient’s cognitive function was assessed by the nurse during the enrollment process. Exclusion criteria were receiving ongoing treatment for a pulmonary infection, COPD exacerbation, or cancer diagnosis at enrollment.
A total of 363 patients were asked to participate in this study. Of these, 16 did not meet the inclusion criteria and 55 declined to participate. Of the 292 patients who wanted to participate, eight withdrew from the study and 17 did not return the questionnaire at enrollment. The final sample for this study consisted of 267 patients (response rate 76.9%). To evaluate for the changes in pain occurrence and severity, patients completed questionnaires at enrollment (n=267), and at three (n=234), six (n=225), nine (n=202), and 12 (n=202) months after enrollment.
This study was approved by the privacy ombudsman at Oslo University Hospital, and recommended by the Regional Committees for Medical and Health Research Ethics (reference no S-09102a).
Instruments
Patients completed all of the self-report questionnaires. Research nurse reviewed the patients’ medical records for clinical data.
Demographic and clinical characteristics
At enrollment, patients provided information on age, sex, education, and cohabitation. The research nurse collected data on BMI, smoking history, and number of years since diagnosis of COPD. Pack-years smoking was calculated as the average number of cigarettes smoked per day divided by 20 and multiplied by the total number of years smoking.24
Comorbidity
Comorbidities were assessed using the Self-Administered Comorbidity Questionnaire (SCQ-19),25 which includes 16 common and three optional medical conditions. Patients were asked to indicate whether they had the comorbid condition (yes/no), if they received treatment for it (yes/no), and whether it limited their activities (yes/no). The SCQ total score can range from 0 to 57. A higher score indicates a more severe comorbidity profile.25 The SCQ-19 has well-established validity and reliability with patients with chronic medical conditions.25
Pain
Pain occurrence, worst pain severity, pain inference, and number of pain locations were examined using the Brief Pain Inventory (BPI).26 Patients were asked to indicate whether they generally were bothered by pain (yes/no). If they were generally bothered by pain, they rated worst pain severity using a numeric rating scale (NRS) that ranged from 0 (no pain) to 10 (worst pain imaginable). In addition, patients rated how much pain interfered with general activity, mood, walking ability, normal work and housework, relations with other people, sleep, enjoyment of life using a NRS that ranged from 0 (does not interfere) to 10 (completely interferes). A total interference score was calculated as the mean of these seven items. Total number of pain locations was calculated using a body outline diagram. The body outline diagram is divided into 30 different areas. Each area that was marked was counted and summed to create the total number of pain locations. Scores could range from 0 to 30.27 The Norwegian version of BPI has satisfactory validity and reliability and sensitivity to change in longitudinal studies.28,29 The BPI was used in studies of COPD patients.1,10–13,22
HRQoL
The St George’s Respiratory Questionnaire (SGRQ) during the last three months was used to evaluate the overall HRQoL.30 The total SGRQ score can range from 0 to 100, with higher scores indicating lower HRQoL.30,31 The SGRQ is a valid and reliable measure of HRQoL in patients with COPD.32–34
Lung function
At enrollment, patients underwent a spirometry. Data were collected on forced expiratory volume in one second (FEV1) and forced vital capacity (FVC), and predicted values were calculated according to the guidelines of the European Respiratory Society.35 FVC, FEV1, and FEV1 as a percentage of the predicted value (FEV1% predicted) were used as measures of lung function. Disease severity was classified using the GOLD guidelines23 and was graded as mild (FEV1 ≥80% predicted), moderate (FEV1 50%–79% predicted), severe (FEV1 30%–49% predicted), or very severe (FEV1 <30% predicted).
Physical function
Physical function was evaluated using the 6 Minute Walk Test (6MWT).36,37 Distance covered was measured to the closest meter. A greater distance indicates better physical function. The 6MWT has satisfactory validity and reliability in COPD patients.37,38
Data analysis
In this study, patients who indicated that they were generally bothered by pain or who completed information on two of the four dimensions of the BPI (ie, intensity, location, interference, relief)26 were categorized into the pain group.
The profile for pain across five assessments was evaluated. Because trajectory for pain across the assessments was complex, latent class analysis (LCA) for the occurrence rates, and latent profile analysis (LPA) for the severity ranges were performed rather than growth mixture modeling.39–42 To accommodate expected serial covariation over time, covariances between adjacent assessments were included in the model (ie, baseline with three months, three months with six months, etc.). Patients who did not report pain at any of the five measurements were classified as the no pain group. These patients were not included in the LCA or LPA. Separate analyses were done for pain occurrence (LCA) and severity (worst pain; LPA) to identify groups of patients (ie, latent classes) with distinct pain experiences over the five assessments.
Estimation was carried out with full information maximum likelihood (FIML) with standard errors and a chi-square test that are robust to non-normality and non-independence of observations (estimator = multiple linear regression analysis). Model fit was evaluated using the Bayesian Information Criterion (BIC), entropy, the Vuong Lo Mendell Rubin (VLMR) likelihood ratio test for the K vs K-1 model, and latent class sizes (percentages) that were large enough to be reliable.43,44 Missing data were accommodated with the use of FIML and the Expectation Maximization algorithm.
Mixture models such as LPA are known to produce solutions at local maxima. Therefore, our models were fit with from 1,000 to 2,400 random starts. This approach ensured that the selected model was replicated many times and not due to a local maximum. The LPAs were conducted using Mplus Version 7.2.43
After identifying the latent class solution that best fits the data for each outcome, the patients who did not report pain at any of the five assessments were added in the subsequent analyses as the no pain group. Differences in demographic and clinical characteristics as well as HRQoL among the pain groups were evaluated using analysis of variance, chi-square tests, or Kruskal–Wallis tests using SPSS version 21.45 A p-value of <0.05 was considered statistically significant. Multiple comparisons of differences between groups were Bonferroni adjusted.
Results
Patient characteristics
Of the 267 patients in this study, 52.8% were females, with a mean age of 63.2 (SD 9.0, range 37–84) years. A total of 24% were current smokers. The mean numbers of years since the diagnosis of COPD was 7.6 (SD 6.3, range 0–35). In addition, 31.1% of the patients had moderate COPD, 22.8% had severe COPD, while 46.1% had very severe COPD. Characteristics of the participants at enrollment are summarized in Table 1.
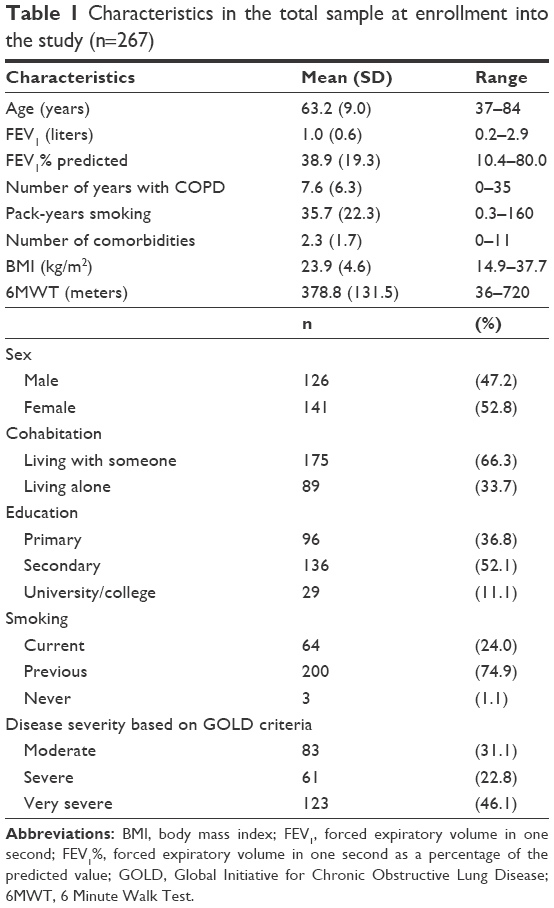 | Table 1 Characteristics in the total sample at enrollment into the study (n=267) |
LCA for pain occurrence
After removing patients who did not report any occurrence of pain across the five assessments, the LCA was performed. A 2-class solution fits the data best. The 2-class solution was selected because the BIC was smallest for the 2-class solution, the VLMR was significant for the 2-class but not for the 3-class solution, and because one of the classes in the 3-class solution was too small (14 cases, or 7% of the sample examined in the latent profile models) to be reliable (Table 2).
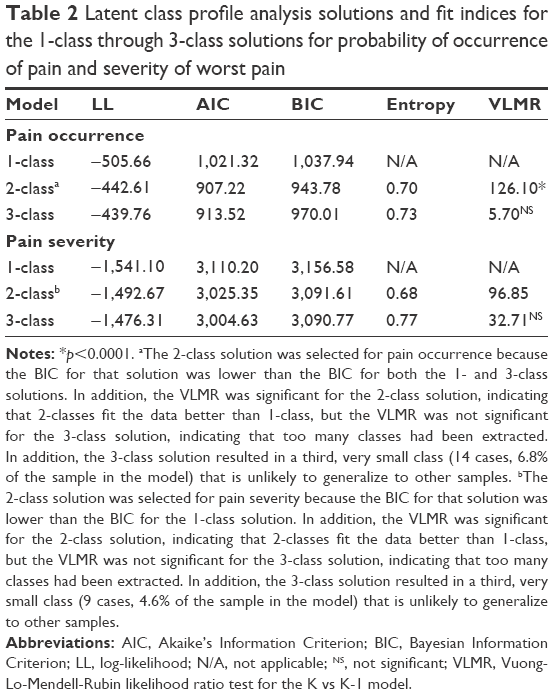 | Table 2 Latent class profile analysis solutions and fit indices for the 1-class through 3-class solutions for probability of occurrence of pain and severity of worst pain |
As shown in Figure 1, 62 patients (23.2%) did not report any pain across the five assessments (ie, no pain group). The largest group of patients (n=128; 47.9%), with the highest pain occurrence rates, was named the “high probability of pain” group. The second largest group (n=77; 28.8%) was named the “moderate probability of pain” group.
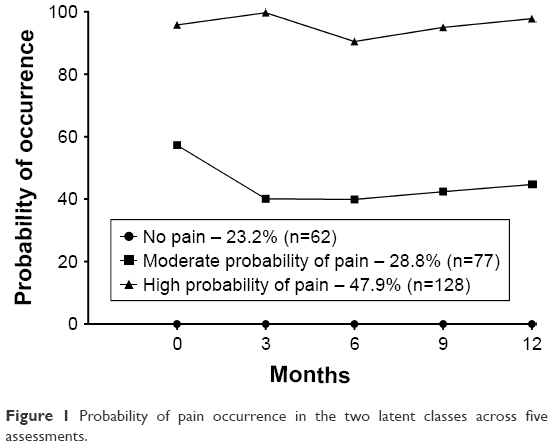 | Figure 1 Probability of pain occurrence in the two latent classes across five assessments. |
Differences in demographic and clinical characteristics and HRQoL among the pain occurrence groups
As shown in Table 3, compared to the “no pain” group, patients in the “high probability of pain” group were more likely to be female; were less likely to have a university education; had a higher BMI; had a higher FEV1% predicted; and were less likely to have very severe COPD. In addition, these patients reported a higher number of comorbidities and a higher total SCQ score, and were more likely to report heart disease, headache, depression, osteoarthritis, back and neck pain, and disease of muscle and connective tissue. Compared to the “no pain” group, patients in the “moderate probability of pain” group reported a higher number of comorbidities and were more likely to report back and neck pain. Compared to the “moderate probability of pain” group, patients in the “high probability of pain” group reported more pain locations and a higher pain interference score. For the SGRQ symptom component, patients in the “high probability of pain” group had a significantly higher score than the patients in the “no pain” group. In addition, there was a significant difference in the SGRQ total score, but no significant pairwise group differences were found.
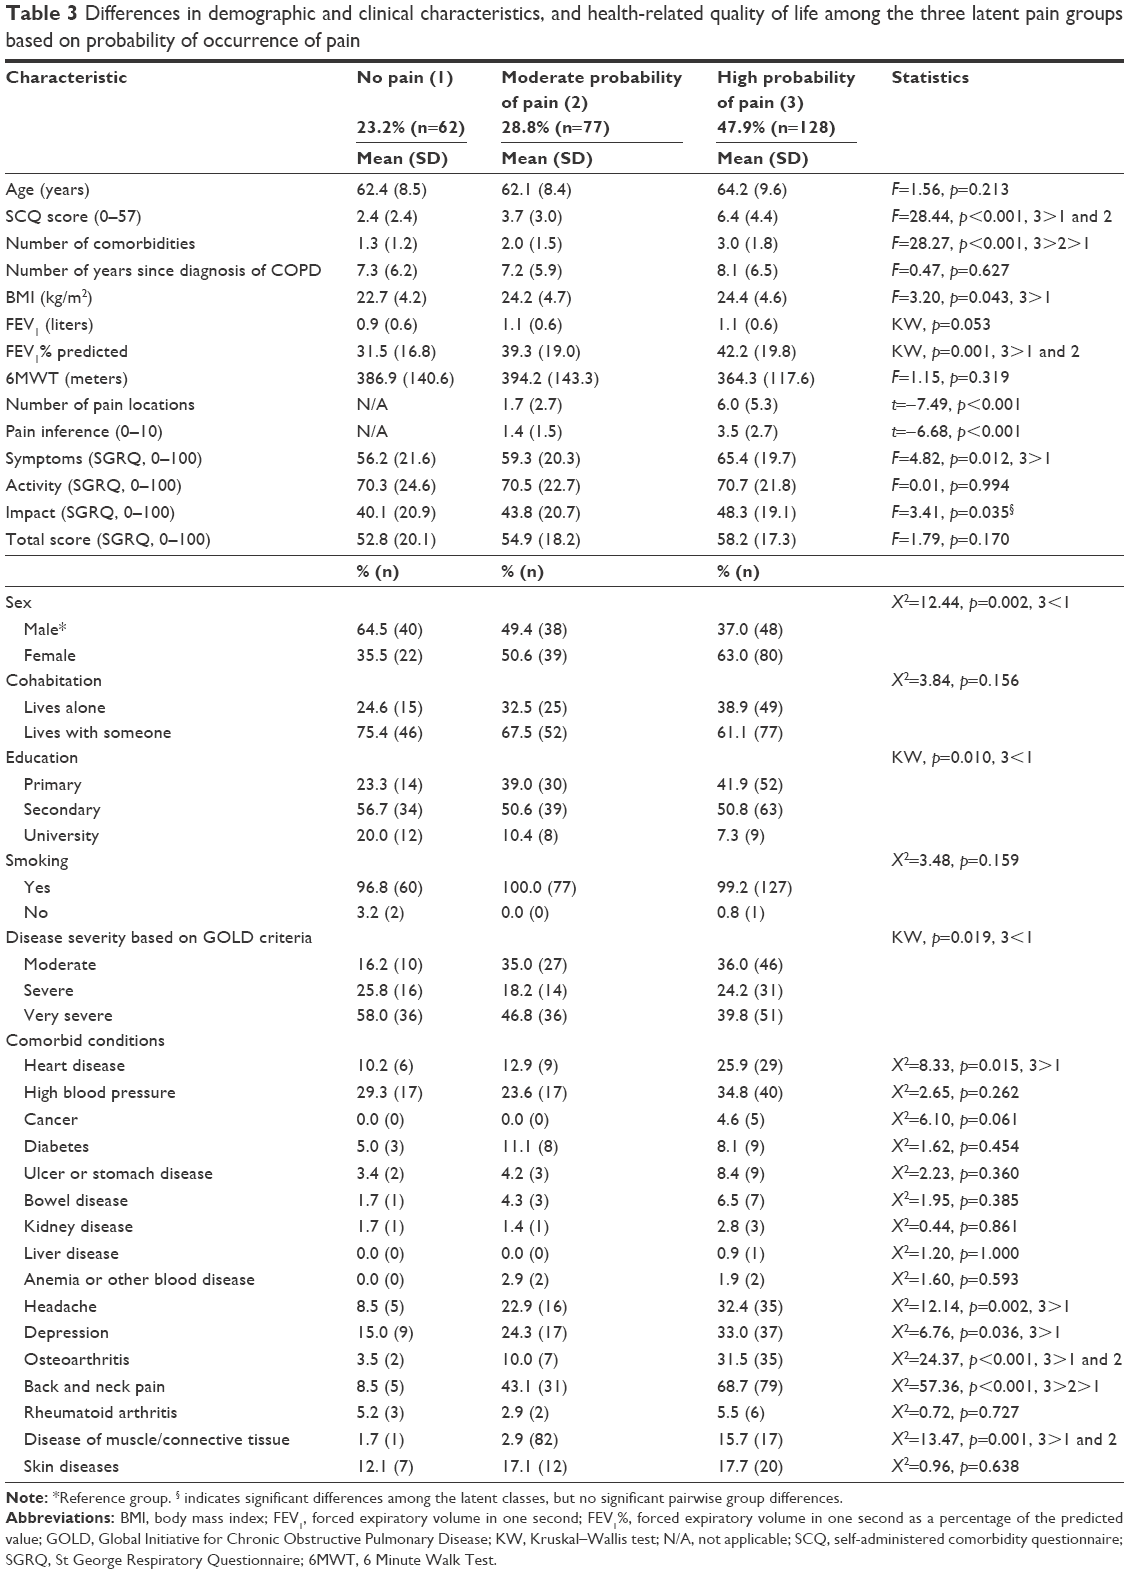 | Table 3 Differences in demographic and clinical characteristics, and health-related quality of life among the three latent pain groups based on probability of occurrence of pain |
LPA for worst pain severity
After removing patients who did not report any severity ratings for pain across the five assessments, the LPA of worst pain scores was performed. Again, a 2-class solution fits the data best. The 2-class solution was selected because the VLMR was significant for the 2-class but not for the 3-class solution and one of the classes in the 3-class solution was too small (9 cases, or 4% of the sample examined in the latent profile models) to be reliable (Table 2). In addition, although the BIC was slightly larger for the 2-class solution compared to the 3-class solution, the difference was trivial (3,091.61 compared to 3,090.77).46,47 Therefore, the 3-class solution did not provide a better fit than the 2-class solution using the BIC as a criterion.
As shown in Figure 2, 64 patients (24.0%) reported worst pain scores of 0 across the five assessments (ie, no pain group). The largest group of patients (n=105, 39.3%) reported worst pain scores in the mild range (ie, mild pain group). The second largest group (n=98, 36.7%) reported worst pain scores in the moderate range (ie, moderate pain group).
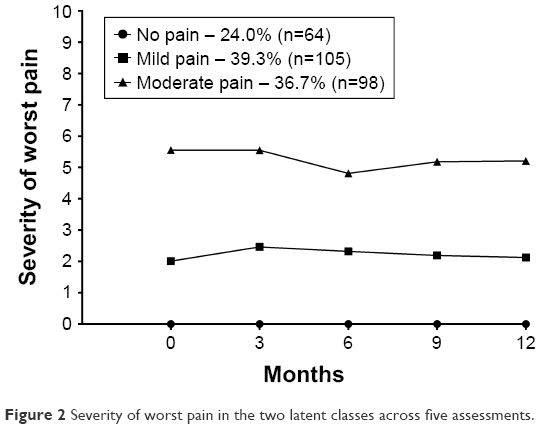 | Figure 2 Severity of worst pain in the two latent classes across five assessments. |
Differences in demographic and clinical characteristics and HRQoL among the worst pain severity groups
As shown in Table 4, compared to the “no pain” group, patients in the “moderate pain” group were more likely to be female, were less likely to have a university education, had a higher BMI, had a higher FEV1 (liters) and FEV1% predicted, and were less likely to have very severe COPD. In addition, these patients reported a higher number of comorbidities and a higher SCQ score. They were more likely to report heart disease, headache, osteoarthritis, back and neck pain, and disease of muscle and connective tissue. Compared to the “no pain” group, the patients in the “mild pain” group reported a higher number of comorbidities, had a higher SCQ score, and were more likely to report back and neck pain. Compared to the “mild pain” group, patients in the “moderate pain” group reported more pain locations and higher pain interference score. There was a significant difference in SGRQ symptoms score (p=0.047), but no significant pairwise group difference was found.
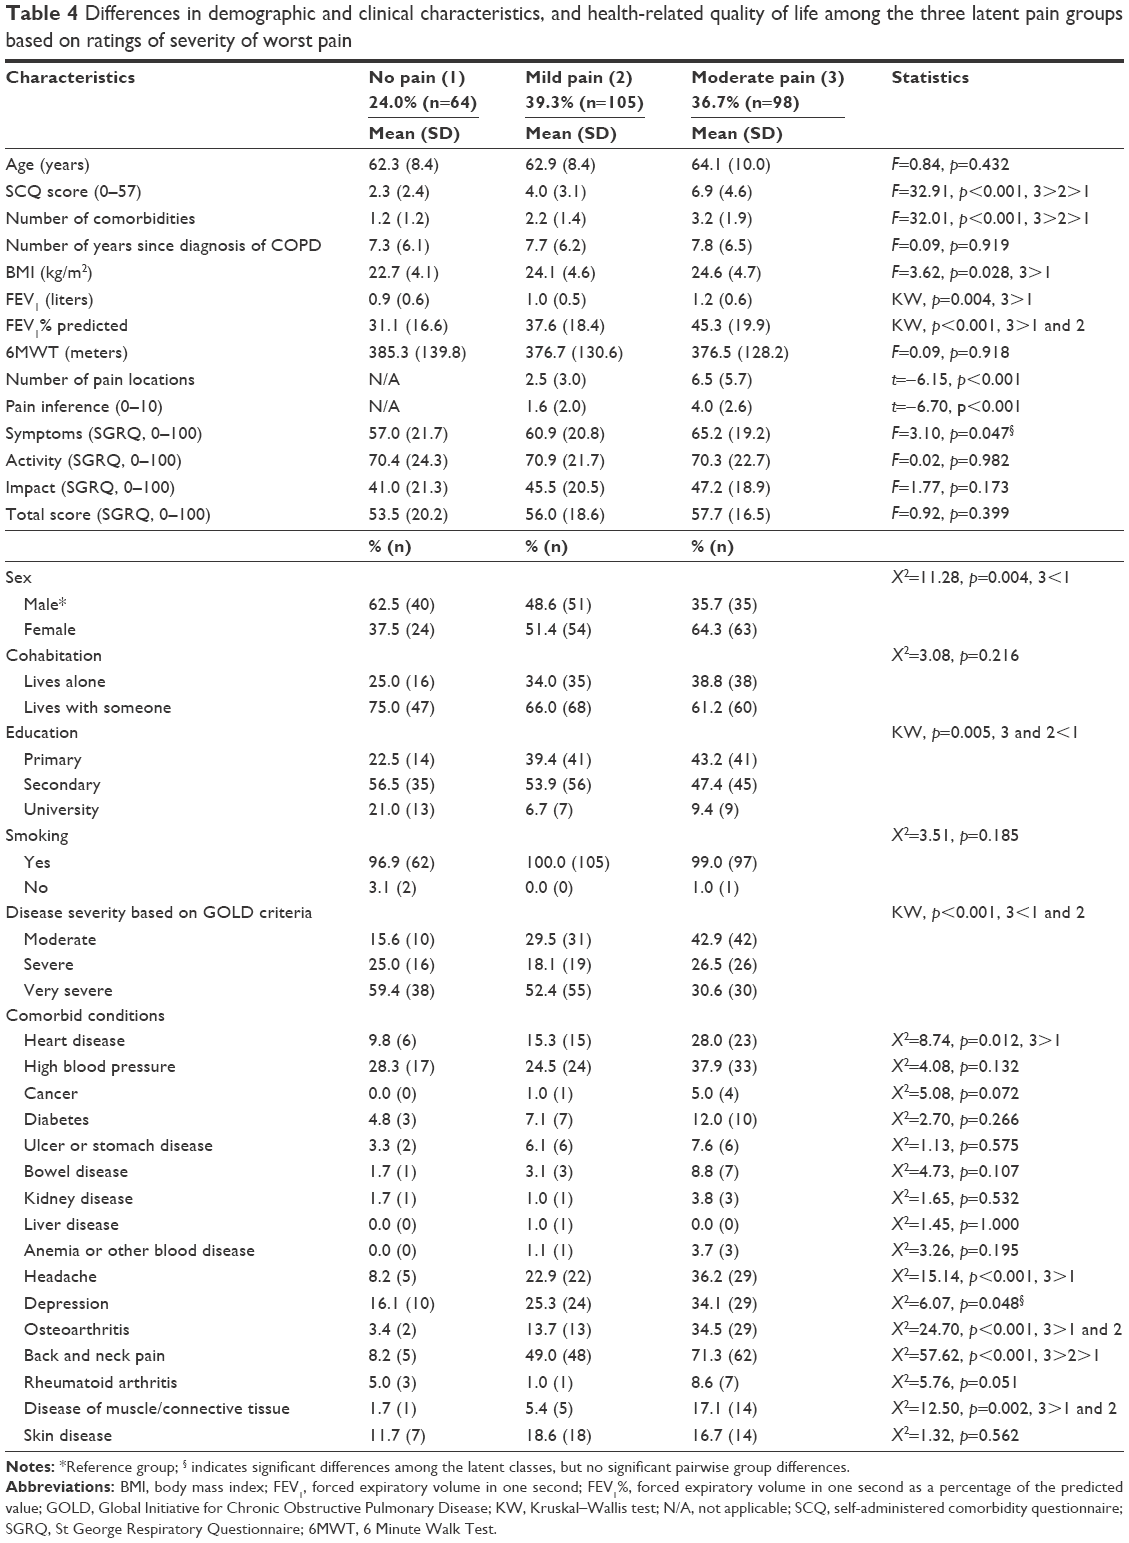 | Table 4 Differences in demographic and clinical characteristics, and health-related quality of life among the three latent pain groups based on ratings of severity of worst pain |
Discussion
The present study is the first to identify specific groups of patients with COPD who are characterized by distinct trajectories of pain based on reports of occurrence and severity over a 12-month period. Using LCA, two distinct groups of pain could be identified among those COPD patients who reported pain, one with high probability and one with moderate probability of pain. A similar pattern was found when severity scores were used in the LPA. When analyzing the occurrence of pain, we found that 77% of the patients had pain at least once during the five assessments done over one year. Of these, 29% of the patients were in the “moderate probability of pain” group and 48% were in the “high probability of pain” group. Moreover, when analyzing pain severity, we found that the overall percentage of patients with pain scores in the mild and moderate range was 76%. This finding is higher than the 38% found in terminally ill COPD patients.5 Taken together, our findings suggest that persistent pain is a significant problem for COPD patients.
In addition, we found that those who reported pain had less severe COPD as measured by FEV1% predicted. These findings are consistent with a previous study that found that patients with moderate COPD reported a higher pain prevalence rate and worse pain severity scores than patients with severe or very severe disease.3 There may be several explanations for this somewhat unexpected finding. One potential explanation is that patients with more severe COPD are more likely to report respiratory phenomena (eg, chronic cough, sputum production, breathlessness, wheezing)10,48,49 that are experienced as more severe and distressing than pain.
Despite the fact that the patients with higher probability of pain occurrence had less severe COPD as measured by FEV1% predicted, they reported more respiratory symptoms. This finding is consistent with a previous study.20 In addition, in a qualitative study22 it was found that COPD patients described their pain as “tying up their body” making it impossible to breathe, which in turn resulted in increased pain. This finding may be a confirmation of the notion that the sensation of pain and respiratory symptoms may be related.50
Regarding the specific descriptions of pain, our study showed that painful conditions including headache, heart diseases, osteoarthritis, back and neck pain, rheumatoid arthritis, and diseases of muscle and connective tissue were reported in relatively high percentages of patients in the two highest pain groups compared to the no pain groups. This finding is consistent with previous research.51 It is conceivable that some of these conditions may be causally related to the COPD. Headache may result from chronic hypoxemia.52 In addition, osteoporosis-related vertebral fractures are common in COPD53 and the resulting pain is often reported to be severe.54,55 Moreover, the high rates of back and neck pain in the COPD patients could be explained by changes in respiratory function and remodeling of the thorax often associated with COPD.56,57 The main muscles of respiration are the diaphragm and the intercostal muscles.58 However, in patients with COPD, a range of muscles located in the neck (ie, sternocleidomastoid, scalene muscles, pectoralis major and minor) and back (erector spinae and levatores costarum) are overused,59 which may lead to increased pain.56,57 Also, there is evidence to suggest that the systemic inflammation associated with COPD may contribute to the sensation of pain.8,51 Finally, the back and neck pain may be related to a higher BMI.11,13 The BMIs of the patients in the “high probability of pain” (ie, 24–29) and “moderate pain” (ie, 25–29) groups are classified as overweight by the World Health Organization.60 Moreover, being overweight is associated with increased pain in the elderly,61 as well as with a number of painful musculoskeletal conditions (eg, osteoarthritis, and neck back, hip and knee pain).62,63
Additional factors are associated with reports of pain in patients with COPD. Compared to the “no pain” group, patients in the “high probability of pain” and “moderate pain” groups were more likely to be female, to report depression, and to have only a primary school education. Of note, painful musculoskeletal disorders (eg, back and neck pain, osteoarthritis) are more common in females.64–66 In addition, population-based studies,67,68 as well as previous studies of COPD patients,2,69 found that females and depressed patients report higher occurrence and severity of pain. The reasons for this association are not clear. However, evidence suggests that sex differences in pain occurrence and severity may be explained by differences in sex steroid hormones.70 While causal association between depression and pain is not clear, it may be of interest that the same neurological mechanisms are involved in the perception of both depression and pain.71,72 Finally, why the occurrence and severity of pain was associated with a lower level of education is not clear, but our finding is consistent with a previous study.73
Limitations
Some limitations need to be acknowledged. The exact etiologies for the pain and the use of pain medications were not evaluated. Our observations suggest that a detailed characterization of the causes of and treatment for pain should be evaluated in future studies. A further limitation of this study is that approximately 50% of our patients had very severe COPD and were recruited from a tertiary referral hospital. Hence, the results from the present study may not generalize to all COPD patients. Strengths of the study include its high response rate and the large sample of COPD patients evaluated, particularly those COPD patients in the more severe stages of the disease.6,11,13
Conclusion and clinical implications
Our study demonstrates a high occurrence of pain in COPD patients and that this pain persists over time and is often associated with certain comorbidities. The results from this study suggest that more effective interventions are needed to manage pain in COPD patients, particularly among the overweight and poorly educated women in the milder disease groups of COPD. Clinicians may be able to use this information to identify patients who are at higher risk for more severe and persistent pain.
Acknowledgments
We want to thank all the patients and clinicians who contributed to this study, especially the research nurses Gunilla Solbakk, Mari-Ann Øvreseth and Britt Drægni.
Disclosure
The authors report no conflicts of interest in this work.
References
Christensen VL, Holm AM, Kongerud J, et al. Occurrence, characteristics, and predictors of pain in patients with chronic obstructive pulmonary disease. Pain Manag Nurs. 2016;17(2):107–118. | ||
Janssen D, Wouters E, Parra Y, Stakenborg K, Franssen F. Prevalence of thoracic pain in patients with chronic obstructive pulmonary disease and relationship with patient characteristics: a cross-sectional observational study. BMC Pulm Med. 2016;16:47. | ||
van Dam van Isselt EF, Groenewegen-Sipekama KH, Spruit-van Eijk M, et al. Pain in patients with COPD: a systematic review and meta-analysis. BMJ Open. 2014;4(9):e005898. | ||
Lee AL, Harrison SL, Goldstein RS, Brooks D. Pain and its clinical associations in individuals with COPD: a systematic review. Chest. 2015;147(5):1246–1258. | ||
Wysham NG, Cox CE, Wolf SP, Kamal AH. Symptom burden of chronic lung disease compaed with lung cancer at time of refferral for palliative care consultation. Ann Am Thorac Soc. 2015;12(9):1294–1300. | ||
Bentsen SB, Rustøen T, Miaskowski C. Differences in subjective and objective respiratory parameters in patients with chronic obstructive pulmonary disease with and without pain. Int J Chron Obstruct Pulmon Dis. 2012;7:137–143. | ||
Walke LM, Byers AL, Tinetti ME, Dubin JA, McCorkle R, Fried TR. Range and severity of symptoms over time among older adults with chronic obstructive pulmonary disease and heart failure. Arch Intern Med. 2007;167(22):2503–2508. | ||
Pantilat SZ, O’Riordan DL, Dibble SL, Langfeld CS. Longituidinal assessment of symptom severity among hospitalized elders diagnosed with cancer, heart failure, and chronic obstructive pulmonary disease. J Hosp Med. 2012;7(7):567–572. | ||
Romem A, Tom SE, Beauchene M, Babington L, Scharf SM, Romen A. Pain management at the end of life: a comparative study of cancer, dementia, and chronic obstructive pulmonary disease. Palliat Med. 2015;29(5):464–469. | ||
Borge CR, Wahl AK, Moum T. Association of breathlessness with multiple symptoms in chronic obstructive pulmonary disease. J Adv Nurs. 2010;66(12):2688–2700. | ||
HajGhanbari B, Holsti L, Road JD, Ried DW. Pain in people with chronic obstructive pulmonary disease (COPD). Respir Med. 2012;106(7):998–1005. | ||
HajGhanbari B, Garland SJ, Road JD, Reid WD. Pain and physical performance in people with COPD. Respir Med. 2013;107(11):1692–1699. | ||
Borge CR, Wahl AK, Moum T. Pain and quality of life with chronic obstructive pulmonary disease. Heart Lung. 2011;40(3):E90–E101. | ||
HajGhanbari B, Yamabayashi C, Garland SJ, Road JD, Reid WD. The relationship between pain and comorbid health conditions in people with chronic obstructive pulmonary disease. Cardiopulm Phys Ther J. 2014;25(1):25–35. | ||
Anderson KL, Burckhardt CS. Conceptalization and measurement of quality of life as an outcome variable for health care intervention and research. J Adv Nurs. 1999;29(2):298–306. | ||
Cazzola M, MacNee W, Martinez FJ, et al; American Thoracic Society; European Respiratory Society Task Force on outcomes of COPD. Outcomes for COPD pharmacological trials: from lung function to biomarkers. Eur Respir J. 2008;31(2):416–468. | ||
Wilke S, Janssen DJ, Wouters EF, Schols JM, Franssen FM, Spruit MA. Correlations between disease-specific and generic health status questionnaires in patients with advanced COPD: a one-year observational study. Health Qual Life Outcomes. 2012;10:98. | ||
Wood-Dauphniee S. Assessing quality of life in clinical research: from where have we come and where are we going? J Clin Epidemiol. 1999;52(4):355–363. | ||
Bentsen SB, Miaskowski C, Rustoen T. Demographic and clinical characteristics associated with quality of life in patients with chronic obstructive pulmonary disease. Qual Life Res. 2014;23(3):991–998. | ||
Bentsen SB, Rustoen T, Miaskowski C. Prevalence and characteristics of pain in patients with chronic obstructive pulmonary disease compared to the Norwegian general population. J Pain. 2011;12(5):539–545. | ||
Janssen DJ, Spruit MA, Uszko-Lencer NH, Schols JM, Wouters EF. Symptoms, comorbidities, and health care in advanced chronic obstructive pulmonary disease or chronic heart failure. J Palliat Care Med. 2011;14(6):735–743. | ||
Lohne V, Heer HC, Andersen M, Miaskowski C, Kongerud J, Rustoen T. Qualitative study of pain in patients with chronic obstructive pulmonary disease. Heart Lung. 2010;39(3):225–234. | ||
GOLD. Global strategy for the diagnosis, management and prevention of chronic obstructive pulmonary disease. Portland, OR: Global Initiative for Chronic Obstructive Lung Disease; 2017. | ||
Larsson K. KOL – Kronisk Obstruktiv Lungsjukdom. 2nd ed. Lund: Studentlitteratur; 2006. Swedish. | ||
Sangha O, Stucki G, Liang MH, Fossel AH, Katz JN. The self administered comorbidity questionnaire: a new method to assess comorbidity for clinical and health services research. Arthritis Rheum. 2003;49(2):156–163. | ||
Cleeland CS, Ryan KM. Pain assessment: global use of the Brief Pain Interventory. Ann Acad Med Singapore. 1994;23(2):129–138. | ||
Puntillo K. Pain in the Critically Ill: Assessment and Management. Gaithersburg, MD: Aspen Publishers; 1991. | ||
Klepstad P, Loge JH, Borchgrevink PC, Mendoza TR, Cleeland CS, Kaasa S. The Norwegian Brief Pain Inventory Questionnaire: translation and validation in cancer pain patients. J Pain Symptom Manage. 2002;24(5):517–525. | ||
Tan G, Jensen MP, Thornby JI, Shanti BF. Validation of the Brief Pain Inventory for chronic nonmalignant pain. J Pain. 2004;5(2):133–137. | ||
Jones PW, Quirk FH, Baveystock CM. The St George’s Respiratory Questionnaire. Respir Med. 1991;85 Suppl B:25–35. | ||
Jones PW. St. George’s Respiratory Questionnaire: MCID. COPD. 2005;2(1):75–79. | ||
Barr JT, Schumacher GE, Freeman S, LeMoine M, Bakst AW, Jones PW. American translation, modification, and validation of the St. George’s Respiratory Questionnaire. Clin Ther. 2000;22(9):1121–1145. | ||
Engström CP, Persson LO, Larsson S, Sullivan M. Reliability and validity of the Swedish version of the St George’s Respiratory Questionnaire. Eur Respir J. 1998;11(1):61–66. | ||
Ferrer M, Alonso J, Prieto L, et al. Validity and reliability of the St. George’s Respiratory Questionnaire after adaptation to a different language and culture: the Spanish example. Eur Respir J. 1996;9(6):1160–1166. | ||
Quanjer PH, Tammeling GJ, Cotes JE, Pedersen OF, Peslin R, Yernault JC. Lung volums and forced ventilatory flows. Report working party standardization of lung function tests European community for steel and coal. Official statment of the European respiratory society. Eur Respir J Suppl. 1993;16:5–40. | ||
Butland RJ, Pang J, Gross ER, Woodcock AA, Geddes DM. Two-, six-, and twelve-minute walking tests in respiratory disease. Br Med J (Clin Res Ed). 1982;284(6329):1607–1608. | ||
Guyatt GH, Sullivan MJ, Thompson PJ, et al. The 6-minute walk: a new measure of exercise capcity in patients with chronic heart failure. Can Med Assoc J. 1985;132(8):919–923. | ||
Solway S, Brooks D, Lacasse Y, Thomas S. A qualitative systematic overview of the measurement properties of functional walk test used in cardiorespiratory domain. Chest. 2001;119(1):256–270. | ||
Geiser C. Data Analysis with Mplus. New York, NY: Guilford Press; 2012. | ||
Jung T, Wickrama KAS. An introduction to latent class growth analysis and growth mixture modeling. Soc Personal Psychol Compass. 2008;2:302–317. | ||
Muthèn B. Second-generation structural equation modeling with a combination of categorical and continuous latent variables: new opportunities for latent-class growth modeling. In: Colins LM, Sayer AG, editors. New Methods for the Analysis of Change. Washington, DC: American Psychological Association; 2001:291–322. | ||
Muthèn L. Personal Communication, Mplus Product Support. Los Angeles: CA. Muthèn & Muthèn; 2014. | ||
Muthen L, Muthen B. Mplus User’s Guide. 7th ed. Los Angeles, CA: Muthen & Muthen; 1998–2014. | ||
Nylund K, Asparouhov T, Muthen B. Deciding on the number of classes in latent class analysis and growth mixture modeling: a Monte Carlo simulation study. Struct Equ Model. 2007;14:535–569. | ||
SPSS. IBM SPSS for Windows (version 21). Armonk, NY: SPSS, Inc.; 2016. | ||
Muthèn B. Mplus Discussion: Latent Variable Mixture Modelling: Latent Transition Analysis (LTA). Available from: http://www.statmodel.com/discussion/messages/13/278.html. Accessed August 31, 2010. | ||
Muthèn B. Mplus Discussion: Using BIC for SEM. Available from: http://www.statmodel.com/discussion/messages/11/5682.html. Accessed July 14, 2010. | ||
Bentsen SB, Henriksen AH, Wentzel-Larsen T, Hanestad BR, Wahl AK. What determines subjective health status in patients with chronic obstructive pulmonary disease: importance of symptoms in subjective health status of COPD patients. Health Qual Life Outcomes. 2008;6:115. | ||
Blinderman CD, Homel P, Billings JA, Tennstedt S, Portenoy RK. Symptoms, distress and quality of life in patients with advanced chronic obstructive pulmonary disease. J Pain Symptom Manage. 2009;38(1):115–123. | ||
Lansing RW, Gracely RH, Banzet RB. The multiple dimensions of dyspnea: review and hypotheses. Respir Physiol Neurobiol. 2009;167(1):53–60. | ||
Roberts MH, Mapel DW, Hartry A, vonWorley A, Thomson H. Chronic pain and pain medication use in chronic obstructive pulmonary disease. A cross-sectional study. Ann Am Thorac Soc. 2013;10(4):290–298. | ||
Ozge A, Ozge C, Kaleagasi H, Yalin O, Unal O, Ozgür ES. Headache in patients with chronic obstructie pulmonary disease: effects of chronic hypoxaemia. J Headache Pain. 2006;7(1):37–43. | ||
Biskobing DM. COPD and osteoporosis. Chest. 2002;121(2):609–620. | ||
Fahrleitner-Pammer A, Langdahl BL, Martin F, et al. Fracture rate and back pain during and after discontinuation of teriapide: 36-month data from the European Forseo Observational Study (EFOS). Osteoporos Int. 2011;22(10):2709–2719. | ||
Lee J, Song J, Hootman JM, et al. Obesity and other modifiable factors for physical inactivity measured by accelerometer in adults with knee osteoarthritis. Arthritis Care Res (Hoboken). 2013;65(1):53–61. | ||
O’Sullivan PB, Beales DJ. Changes in pelvic floor and diaphragm kinematics and respiratory patterns in subjects with sacroiliac joint pain following a motor learning intervention: a case series. Man Ther. 2007;12(3):209–218. | ||
Kapreli E, Vourazanis E, Billis E, Oldham JA, Strimpakos N. Respiratory dysfunction in chronic neck pain patients. A pilot study. Cephalagia. 2009;29(7):701–710. | ||
Martini F, Nath J, Bartholomew E. Fundamentals of Anatomy and Physiology. 9th ed. San Francisco, CA: Benjamin Cummings; 2012. | ||
Orozco-Levi M. Structure and function of the respiratory muscles in patients with COPD: impariment or adaptation? Eur Respir J Suppl. 2003;46:41s–51s. | ||
WHO. Obesity and overweight. 2016. Available from: http://www.who.int/mediacentre/factsheets/fs311/en/. Accessed July 04, 2016. | ||
McCarthy LH, Bigal ME, Katz M, Derby C, Lipton RB. Chronic pain and obesity in elderly people: results from the Einstein aging study. J Am Geriatr Soc. 2009;57(1):403–410. | ||
Plotnikoff R, Karunamuni N, Lytvyak E, et al. Osteoarthritis prevalence and modifiable factors: a population study. BMC Public Health. 2015;15:1195–1205. | ||
Deere KC, Clinch J, Holliday K, et al. Obesity is a risk factor for musculoskeletal pain in adolescents: findings from a population-based cohort. Pain. 2012;153(9):1932–1938. | ||
Stenberg G, Lundquist A, Fjellman-Wiklund A, Ahlgren C. Patterns of reported problems in women and men with back and neck pain: similarities and differences. J Rehabil Med. 2014;46(7):668–675. | ||
Kinge JM, Knudsen AK, Skirbekk V, Vollset SE. Musculoskeletal disorders in Norway: prevalence of chronicity and use of primary and specialist health care services. BMC Musculoskelet Disord. 2015;16:75. | ||
Paanalahti K, Holm LW, Magnusson C, Carroll L, Nordin M, Skillgate E. The sex-specific interrelationship between spinal pain and psychological distress across time in the general population. Results from the Stockholm Public Health Study. Spine J. 2014;14(9):1928–1935. | ||
Breivik H, Collett B, Ventafridda V, Cohen R, Gallacher D. Survey of chronic pain in Europe: prevalence, impact on daily life, and treatment. Eur J Pain. 2006;10(4):287–333. | ||
Rustøen T, Wahl AK, Hanestad BR, Lerdal A, Paul S, Miaskowski C. Prevalence and characteristics of chronic pain in the Norwegian general population. Eur J Pain. 2004;8(6):555–565. | ||
Di Marco F, Verga M, Reggente M, et al. Anxiety and depression in COPD patients: the roles of gender and disease severity. Respir Med. 2006;100(10):1767–1774. | ||
de Kruijf M, Stolk L, Zillikens MC, et al. Lower sex hormone levels are associated with more chronic musculoskeletal pain in community-dwelling elderly women. Pain. 2016;157(7):1425–1431. | ||
De Peuter S, Van Diest I, Lemaigre V, Verleden G, Demedts M, Van den Bergh O. Dyspnea: the role of psychological processes. Clin Psychol Rev. 2004;24(5):557–581. | ||
Gatchel RJ, Peng YB, Fuchs PN, Peters ML, Turk DC. The biopsychosocial approach to chronic pain: scientific advances and future directions. Psychol Bull. 2007;133(4):581–624. | ||
Mundal I, Bjørngaard JH, Nilsen TI, Nicholl BI, Grawe RW, Fors EA. Long-term changes in musculoskeletal pain sites in the general population: the HUNT study. J Pain. 2016;17(11):1246–1256. |
 © 2018 The Author(s). This work is published and licensed by Dove Medical Press Limited. The
full terms of this license are available at https://www.dovepress.com/terms
and incorporate the Creative Commons Attribution
- Non Commercial (unported, 3.0) License.
By accessing the work you hereby accept the Terms. Non-commercial uses of the work are permitted
without any further permission from Dove Medical Press Limited, provided the work is properly
attributed. For permission for commercial use of this work, please see paragraphs 4.2 and 5 of our Terms.
© 2018 The Author(s). This work is published and licensed by Dove Medical Press Limited. The
full terms of this license are available at https://www.dovepress.com/terms
and incorporate the Creative Commons Attribution
- Non Commercial (unported, 3.0) License.
By accessing the work you hereby accept the Terms. Non-commercial uses of the work are permitted
without any further permission from Dove Medical Press Limited, provided the work is properly
attributed. For permission for commercial use of this work, please see paragraphs 4.2 and 5 of our Terms.