
Back to Journals » Journal of Blood Medicine » Volume 17

Disease Burden, Inadequate Hematocrit Control, and Thromboembolic Events in Patients with Polycythemia Vera Despite Current Standard of Care Treatment: A Retrospective Claims Study
Authors Gerds AT  , Fan Q, Jerry M , Cerretani A , Tran AT , Hernandez L
Received 23 May 2026
Accepted for publication 13 July 2026
Published 22 July 2026 Volume 2026:17 626464
DOI https://doi.org/10.2147/JBM.S626464
Checked for plagiarism Yes
Review by Single anonymous peer review
Peer reviewer comments 2
Editor who approved publication: Professor Safaa A A Khaled
Aaron T Gerds,1 Qi Fan,2 Michelle Jerry,3 Alicia Cerretani,4 Anh Thu Tran,3 Luis Hernandez2
1Hematology and Medical Oncology, Cleveland Clinic Taussig Cancer Institute, Cleveland, OH, USA; 2Evidence Generation, Global Medical, Takeda Development Center Americas, Inc., Cambridge, MA, USA; 3Real-World Data and Analytics, Merative, Ann Arbor, MI, USA; 4US Medical Affairs Oncology, Takeda Pharmaceuticals America, Inc., Lexington, MA, USA
Correspondence: Qi Fan, Evidence Generation, Global Medical, Takeda Development Center Americas, Inc., 40 Landsdowne St, Cambridge, MA, 02139, USA, Tel +1 443-683-5124, Email [email protected]
Purpose: To evaluate treatment and disease burden among patients with polycythemia vera (PV) receiving the current standard of care (SoC) in the US.
Patients and Methods: This retrospective study utilized MarketScan® Commercial/Medicare Databases to identify patients with PV diagnosis and treatment claims between 1/1/2011-12/31/2022 (index date=earliest PV treatment date), continuous enrollment (6 months pre-index and ≥ 12 months post-index), and no pre-index disease progression (myelofibrosis, acute myeloid leukemia, or myelodysplastic syndrome). Patients were categorized by thrombosis risk (high/low-risk) and 12-month post-index treatments: phlebotomy (PHL) only, hydroxyurea (HU) only, PHL+HU, or ruxolitinib/interferons (RUX/IFN). Outcomes included incident TE, iron deficiency anemia, disease progression, and PV-related symptoms. Hematocrit (HCT) control was evaluated in patients with ≥ 2 HCTs post-index (HCT analysis). All-cause costs during the 12 months post-TE were reported in patients with an incident TE and ≥ 12 months post-TE follow-up (TE analysis).
Results: Among 11,311 patients (51.8% high-risk; 48.2% low-risk; median follow-up ~2.8 years), 12-month post-index treatments included PHL only (75.0%), HU only (12.2%), PHL+HU (10.9%), and RUX/IFN (1.9%). Frequent PHL (≥ 3 PHL in 6 months or ≥ 5 PHL in 12 months post-index; 46.2% of PHL users) and high-dose HU (≥ 1000mg/day; 41.7% of HU users) were common. Within 12 months post-index, 50.9% of patients experienced burdensome treatment (frequent PHL, high-dose HU) and/or an incident TE. During the full follow-up, 15.3% experienced incident TE, 9.6% experienced incident iron deficiency anemia, 4.4% experienced disease progression, and 83.2% experienced symptoms. For the HCT analysis (N=1,268), 85.3% had uncontrolled HCTs≥ 45%, with 55.4% having HCTs≥ 50%. For the TE analysis (N=1,159), mean 12-month all-cause costs post-TE were $71,195, with 29.2% attributable to the index TE.
Conclusion: Patients with PV have high treatment and disease burden with the current SoC. Current PV therapies (PHL, cytoreductive agents) do not consistently maintain HCT< 45%, leaving patients at increased risk for life-threatening and costly TEs.
Keywords: phlebotomy, cytoreductive therapy, thrombotic event, thromboembolic event, hematocrit control
Introduction
Polycythemia vera (PV) is a chronic myeloproliferative neoplasm characterized by erythrocytosis, or the overproduction of red blood cells, and panmyeloid proliferation resulting from constitutive janus kinase-signal transducers and activators of transcription (JAK-STAT) pathway activation, most often driven by somatic activating mutations in JAK2. This process leads to increased blood viscosity and a high risk of life-threatening vascular complications.1 The estimated prevalence of PV in the United States (US) is approximately 44 to 57 per 100,000 persons.2 Patients with PV have reduced overall survival compared to the general population, and thromboembolic events (TEs), such as stroke, heart attack, and pulmonary embolism, are the main cause of morbidity and mortality.3,4 Patients over 60 years old or with a prior history of TE are at the highest risk.5
In addition to the use of daily low-dose aspirin, the primary goal of current standard of care (SoC) treatment, as recommended by guidelines, is to reduce the thromboembolic risk by maintaining the hematocrit (HCT) level below 45%.5,6 This is achieved through therapeutic phlebotomy (PHL) and/or cytoreductive medications including hydroxyurea (HU), ruxolitinib (RUX), or interferons (IFN).5,6 However, real-world studies indicate that achieving and consistently maintaining this critical HCT target remains a significant challenge.4,6 The large, prospective, observational REVEAL study found that nearly half of the enrolled US patients had elevated HCT levels at the time of enrollment despite receiving active treatment.6 Similarly, a 2023 claims-based retrospective analysis by Verstovsek et al demonstrated that HCT control was sub-optimal (ie, not consistently maintain HCT<45%) in both high-risk and low-risk patient groups; over half of the patients initiating PHL alone had HCT>50%.4
This sub-optimal HCT control leaves patients at continued risk for TEs; the Verstovsek et al study noted that 16% of individuals experienced at least one TE after treatment initiation during a median 2.2-year follow-up.4 Beyond TE risk, the disease and current management strategies impose a substantial burden. Patients can experience significant symptom loads, including fatigue, concentration problems, and pruritus, which impair quality of life, productivity, and daily activities. Notably, symptoms often persist even when blood counts are controlled.6 The economic burden is also considerable; claims-based studies show that PV patients who experience TEs incur significant healthcare costs, often exceeding $45,000 in the year following the event.7,8 To mitigate these challenges, the emerging therapeutic pipeline in PV targets novel pathways, such as next-generation JAK inhibitors, murine double minute 2 (MDM2) inhibitors, histone deacetylase (HDAC) inhibitors, lysine-specific demethylase 1 (LSD1) inhibitors, and hepcidin mimetics/inducers.9–12 These advanced agents aim to improve upon current SoC by offering improved HCT control and may also help address symptoms,11,12 highlighting an ongoing effort to expand PV treatment options to address this critical unmet need in PV treatment. To better understand the current knowledge gaps surrounding this unmet need, this retrospective claims database analysis characterized real-world treatment patterns, clinical outcomes (including HCT control, TE, disease progression, iron deficiency anemia, and symptom burden), and the economic burden associated with TE among patients with PV treated with current SoC in the US. Reporting was conducted overall, by risk status, and by treatment.
Material and Methods
Study Design and Data Source
This observational, retrospective administrative claims analysis used the Merative MarketScan Commercial and Medicare Databases to describe the disease burden and clinical outcomes of patients with PV treated with the current SoC. These databases contain fully adjudicated claims data for inpatient, outpatient medical, and outpatient pharmacy services for individuals with employer-based commercial health plans, Medicare Advantage, and Medicare Supplemental coverage. All database records are de-identified and fully compliant with US patient confidentiality requirements, including the Health Insurance Portability and Accountability Act of 1996. Because this study only used de-identified patient records and did not involve the collection, use, or transmittal of individually identifiable data, the data does not involve human subjects (per the definition of human subjects in Title 45 Part 46.102(e) of the Code of Federal Regulations). Thus, this study was exempted from Institutional Review Board approval. This study followed Strengthening the Reporting of Observational Studies in Epidemiology (STROBE) reporting guidelines.13
Study Population
Patients with a claim for a PV diagnosis between January 1, 2011 and December 31, 2022 were identified in the MarketScan databases. This extended patient selection period was used to ensure a sufficiently large sample size with this rare disease population. The PV diagnosis date was defined as the earliest claim with a PV diagnosis code. Patients were included if they had claims for any PV treatments (including PHL and cytoreductive therapy: ropeginterferon alfa-2b-njft and other IFN, HU, RUX, and busulfan) on or after the PV diagnosis date. The index date was defined as the earliest claim for PV treatment. Patients were required to have continuous enrollment with both medical and pharmacy benefits for 6 months prior to the index date (pre-index period) and for at least 12 months on and following the index date (variable-length post-index period). Patients were excluded if they had evidence of 1) disease progression (myelofibrosis, acute myeloid leukemia, or myelodysplastic syndromes) during the pre-index period, and 2) secondary polycythemia (diagnosed by a hematologist or oncologist) or essential thrombocythemia after the PV diagnosis date as these diagnoses may indicate a possible PV misdiagnosis.
Outcomes
Demographic characteristics recorded on the index date included age, sex, and payer type. Baseline clinical characteristics were evaluated during the 6-month pre-index period and included the National Cancer Institute (NCI) adapted comorbidity score, cardiovascular risk factors (diabetes, hyperlipidemia, hypertension, and tobacco use), and non-PV cancer (primary solid tumor, secondary solid tumor, lymphoma). History of TE was assessed using all available data prior to the index date. All conditions were identified by relevant non-diagnostic inpatient or outpatient claims with a diagnosis for the specific condition. Duration of variable-length follow-up was also reported.
Treatment profiles and burdensome treatment and/or TE were assessed during the initial 12 months post-index. For treatment profiles, patients were assigned to mutually exclusive treatment categories: PHL only (frequent or infrequent), HU only (high dose ≥1,000 mg/day or low dose <1,000 mg/day), PHL+HU (PHL at each frequency with HU at each dose), and RUX/IFN (alone or in combination with PHL and/or HU) and busulfan alone. Frequent PHL was defined as ≥3 PHL in 6 months post-index or ≥5 PHL in 12 months post-index, based on the definition established in the Phase 3 VERIFY trial evaluating rusfertide in PHL-dependent patients with PV (NCT05210790).14 As very few patients (N=14) received busulfan, it was not incorporated into the definitions of other treatment categories. For instance, the “PHL only” category may include patients with busulfan despite the category name suggesting a singular treatment with PHL. Separately from the overall treatment classification, patients were assigned to mutually exclusive PHL categories (frequent, infrequent, or no PHL treatment) and HU categories (high dose, low dose, or no HU treatment), and the number of PHLs per person during the 12-month period was captured. Patients with high-dose HU, frequent PHL, or incident TE (defined in the next paragraph) were classified with burdensome treatment and/or TE.
Clinical outcomes were evaluated during the full post-index period of at least 12 months, and included incident iron deficiency anemia, incident TE (deep vein thrombosis, pulmonary embolism, acute coronary syndrome, myocardial infarction, stroke, transient ischemic attack, abdominal thrombosis, peripheral arterial thrombosis, or other thrombosis), disease progression (to myelofibrosis, acute myeloid leukemia, or myelodysplastic syndromes), and PV-related symptoms (abdominal pain, anemia, bleeding, depression/anxiety, difficulty sleeping, dizziness/vertigo, early satiety, facial plethora, fatigue, fever, headache, pruritus, shortness of breath, splenomegaly, sweating, tinnitus, and weight loss). Conditions were identified by non-diagnostic inpatient or outpatient claims with a corresponding diagnosis. To ensure capture of only incident TEs (excluding diagnoses associated with chronic management of a prior TE), incident TEs were defined as: 1) a TE diagnosis on an inpatient or emergency room (ER) claim for all patients or 2) a TE diagnosis in any care setting for patients with no TE diagnosis during the 12-month pre-index period. Beyond diagnosis codes, iron deficiency was further evaluated with ferritin laboratory data for the PHL-involved treatment groups. Among patients with at least two ferritin measurements, the proportion of patients whose average value indicated iron deficiency (<30 ng/mL) was described.
Within the patient subset with at least two HCT measurements during the full post-index period, HCT control was assessed as consistently controlled (all HCT<45%) or uncontrolled (some or all HCT≥45%). The uncontrolled HCT category was further classified into all HCT≥50%, some HCT≥50%, or all HCT<50%. Of the patients in the HCT analysis, patients with at least two measurements for each additional lab test (platelet [PLT] count and white blood cell [WBC] count) were identified. For each lab test (HCT, PLT count, and WBC count), the number of measurements per patient, average time between measurements, average value, and proportion of patients whose average value was controlled were also described.
Within the patient subset experiencing an incident TE who had at least 12 months of remaining follow-up post-TE, all-cause healthcare costs were reported during the 12-month period starting on the TE date and were reported in 2023 US dollars. Costs were derived from relevant claims, capturing both patient responsibility (eg, deductible, copay or coinsurance) and health plan payments. Total costs were categorized as those associated with the initial TE and those incurred after the initial TE. Cost allocation for the initial TE event varied by the setting of care: the full admission cost for TEs identified in the inpatient setting, and costs of all claims on the initial TE date for TEs identified in ER or other outpatient settings (including office, urgent care, etc). Costs were reported overall, stratified by the care setting in which the initial TE was identified (inpatient, ER, or other outpatient), and stratified by the type of initial TE as venous TE (deep vein thrombosis or pulmonary embolism) or arterial TE (acute coronary syndrome, myocardial infarction, stroke, transient ischemic attack, abdominal thrombosis, peripheral arterial thrombosis, or other thrombosis).
Statistical Analyses
Descriptive analyses were conducted for all study measures. Categorical variables were presented as the count and percentage of patients in each category. Continuous variables were summarized using the mean and standard deviation (SD). The 95% confidence interval (CI) of post-TE costs were also reported, using generalized linear models with gamma error distribution and log link mean function. Standard error for CI was calculated with the Wald method. In cases where the gamma model did not converge, error distribution was changed to Tweedie distribution with power parameter = 1.5 to handle excess low costs (eg, 0’s).
HCT outcomes were evaluated within the HCT analysis subset, while post-TE costs were evaluated within the TE cost analysis subset. All study measures were reported overall and stratified by risk status and treatment groups, with the exception of post-TE costs that were only evaluated overall and by risk status. Patients were categorized by risk status: high-risk (age ≥60 on index or TE diagnosis any time prior to index using all available historical data) or low-risk (absence of both risk factors). Separately, patients were stratified into four treatment groups based on treatments received during the first 12 months post-index: PHL only (overall, and sub-categorized as frequent or infrequent), HU only (overall, and sub-categorized as high dose or low dose), PHL+HU (PHL at any frequency with HU at any dose), and RUX/IFN (alone or in combination with PHL and/or HU). Patients receiving “busulfan alone” (N=5) were excluded from treatment subgroup reporting due to the small sample size. Of note, busulfan is infrequently used in clinical practice for PV management. No statistical adjustment for differences in baseline characteristics between risk status and treatment groups were conducted.
Results
Patient Characteristics and Subgroups
The study included 11,311 patients with a mean age of 59.0 years and a predominantly male population (73.1%) (Figure 1 and Table 1). During the 6-month pre-index period, the average NCI adapted comorbidity score was 0.7, and the prevalence of cardiovascular risk factors (60.8%) and any non-PV cancer (10.4%) were both high. Additionally, 12.4% of patients had evidence of a prior TE.
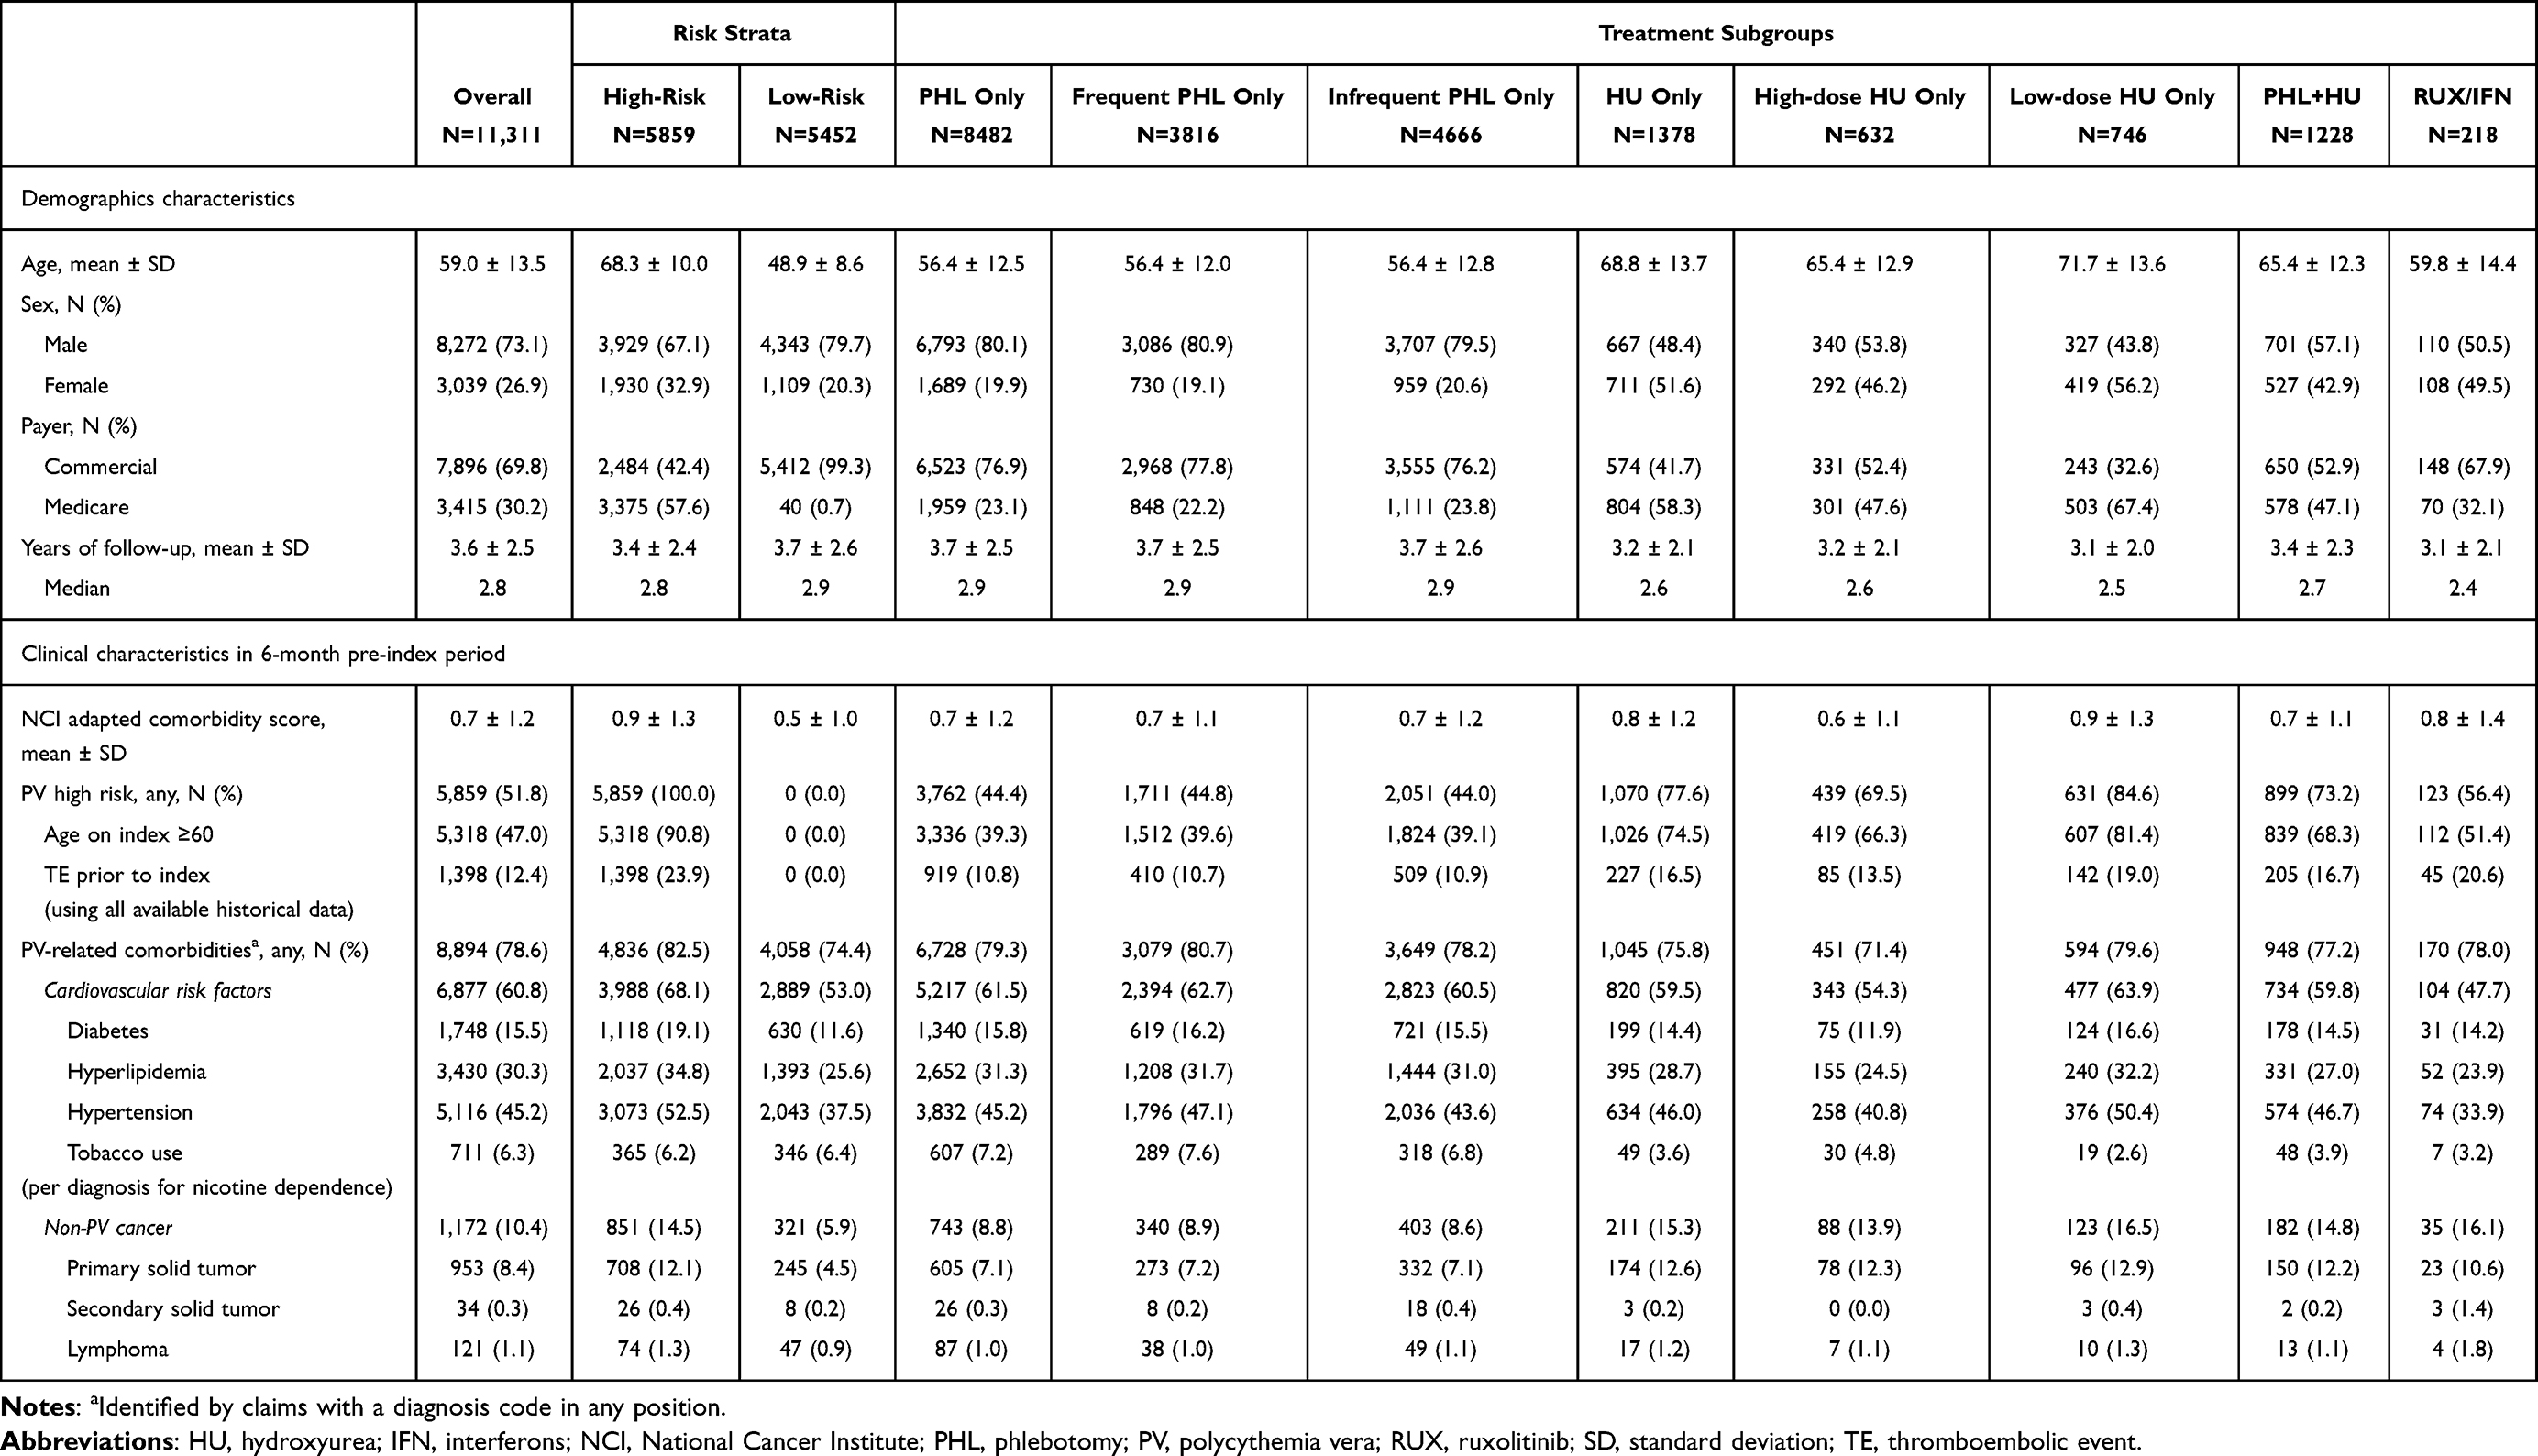 |
Table 1 Baseline Characteristics |
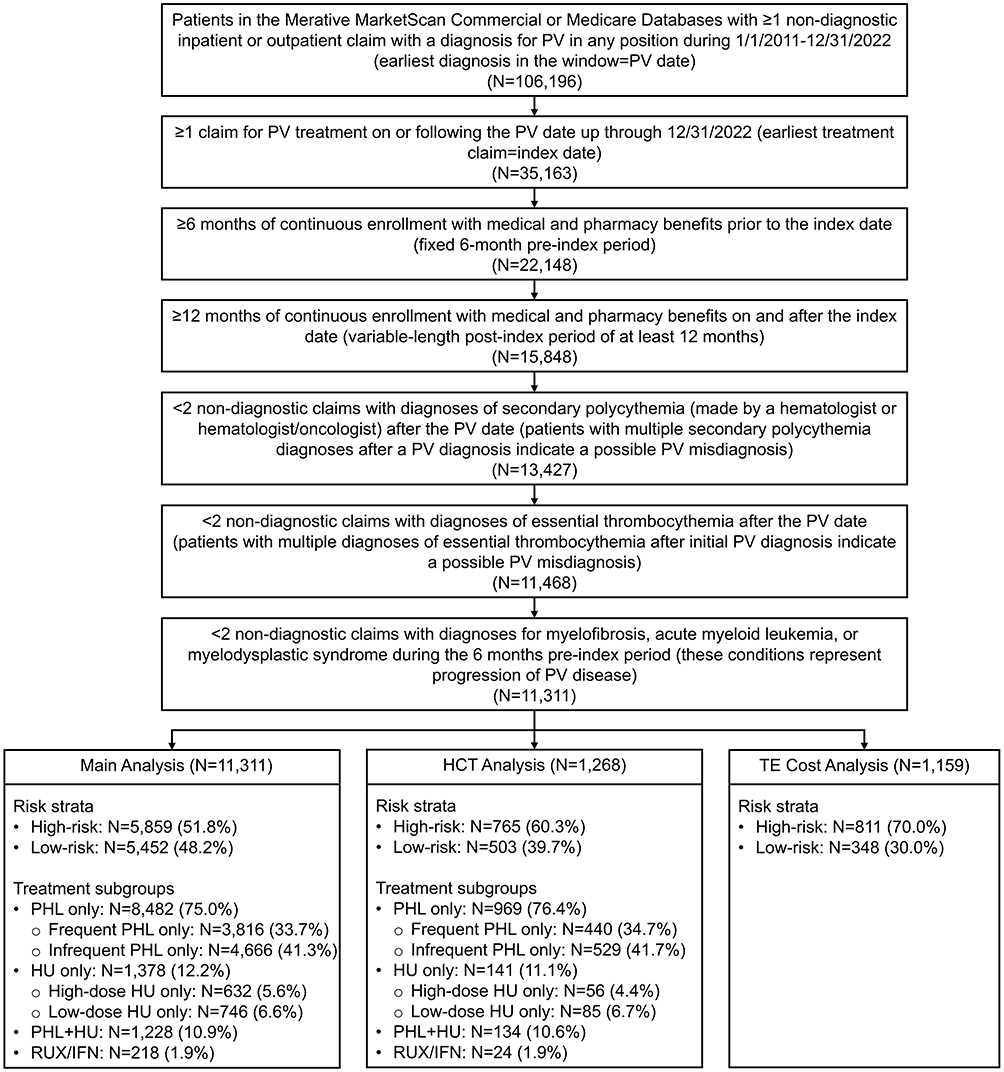 |
Figure 1 Patient attrition and subgroups. Abbreviations: HCT, hematocrit; HU, hydroxyurea; IFN, interferons; PHL, phlebotomy; PV, polycythemia vera; RUX, ruxolitinib; TE, thromboembolic event. Notes: All included patients were categorized as high-risk (age ≥60 on index or a prior TE) or low-risk (absence of both risk factors). Patients were also stratified by mutually exclusive treatment categories during the first 12 months post-index, including PHL only (frequent or infrequent), HU only (high dose [≥1,000 mg/day] or low dose), PHL+HU (PHL at any frequency with HU at any dose), and RUX/IFN (alone or in combination with PHL and/or HU). Frequent PHL was defined by ≥3 PHL in 6 months post-index or ≥5 PHL in 12 months post-index. Patients receiving “busulfan alone” (N=5) were excluded from treatment subgroup reporting. HCT analysis included the subset of patients with at least 2 HCT measurements during the full follow-up period. TE cost analysis included the subset of patients experiencing an incident TE who had at least 12 months of remaining follow-up post-TE. |
Within the high-risk (N=5,859, 51.8%) and low-risk (N=5,452; 48.2%) groups, 67.1% and 79.7% of patients were male, respectively (Figure 1 and Table 1). As expected because of the risk stratification criteria, high-risk patients were older than low-risk patients (mean age: 68.3 vs 48.9 years). High-risk patients also had a greater baseline comorbidity burden than low-risk patients, with a higher mean NCI adapted comorbidity score (0.9 vs 0.5) and a higher prevalence of cardiovascular risk factors (68.1% vs 53.0%) and any non-PV cancer (14.5% vs 5.9%). In addition, 23.9% of high-risk patients had a TE history prior to the index date.
For treatment subgroups, 75.0% of all patients received PHL only, 12.2% HU only, 10.9% PHL+HU, and 1.9% RUX/IFN (Figure 1). HU only patients were older (mean age 68.8 years) in comparison to other treatment groups (mean age: 56.4 years in PHL only, 65.4 years in PHL+HU, 59.8 years in RUX/IFN) (Table 1). Males comprised a majority of patients in the PHL only group (80.1%) but only about half of the other treatment groups (ranging from 48.4% in HU only to 57.1% in PHL+HU). Regarding baseline comorbidities, mean NCI adapted comorbidity scores were similar across all groups (ranging from 0.7 to 0.8). Cardiovascular risk factors were prevalent in approximately 60% of the PHL only, HU only, and PHL+HU groups, but only in 47.7% of the RUX/IFN group. Furthermore, a history of prior TE was more commonly observed in patients receiving cytoreductive therapies (16.5% in HU only, 16.7% in PHL+HU, and 20.6% in RUX/IFN) compared to those managed with PHL only (10.8%). Similarly, the baseline prevalence of any non-PV cancer was higher in the cytoreductive therapy groups (15.3% in HU only, 14.8% in PHL+HU, and 16.1% in RUX/IFN) compared to the PHL only group (8.8%).
Treatment Profiles and Burdensome Treatment and/or TE
Overall, treatment with PHL only (frequent or infrequent) was common (75.0%), and only a small number of patients received RUX/IFN (1.9%) (Table 2). Among patients who received PHL (N=9,797), almost half received frequent PHL (N=4,531; 46.2%). Among patients who received HU (N=2,688), a high percentage received high-dose HU (N=1,121; 41.7%), and of patients who received high-dose HU, many also received frequent PHL (N=233; 20.8%). With current SoC, more than half of patients (50.9%) were identified with burdensome treatment and/or TE based on having frequent PHL, high-dose HU, or experiencing an incident TE.
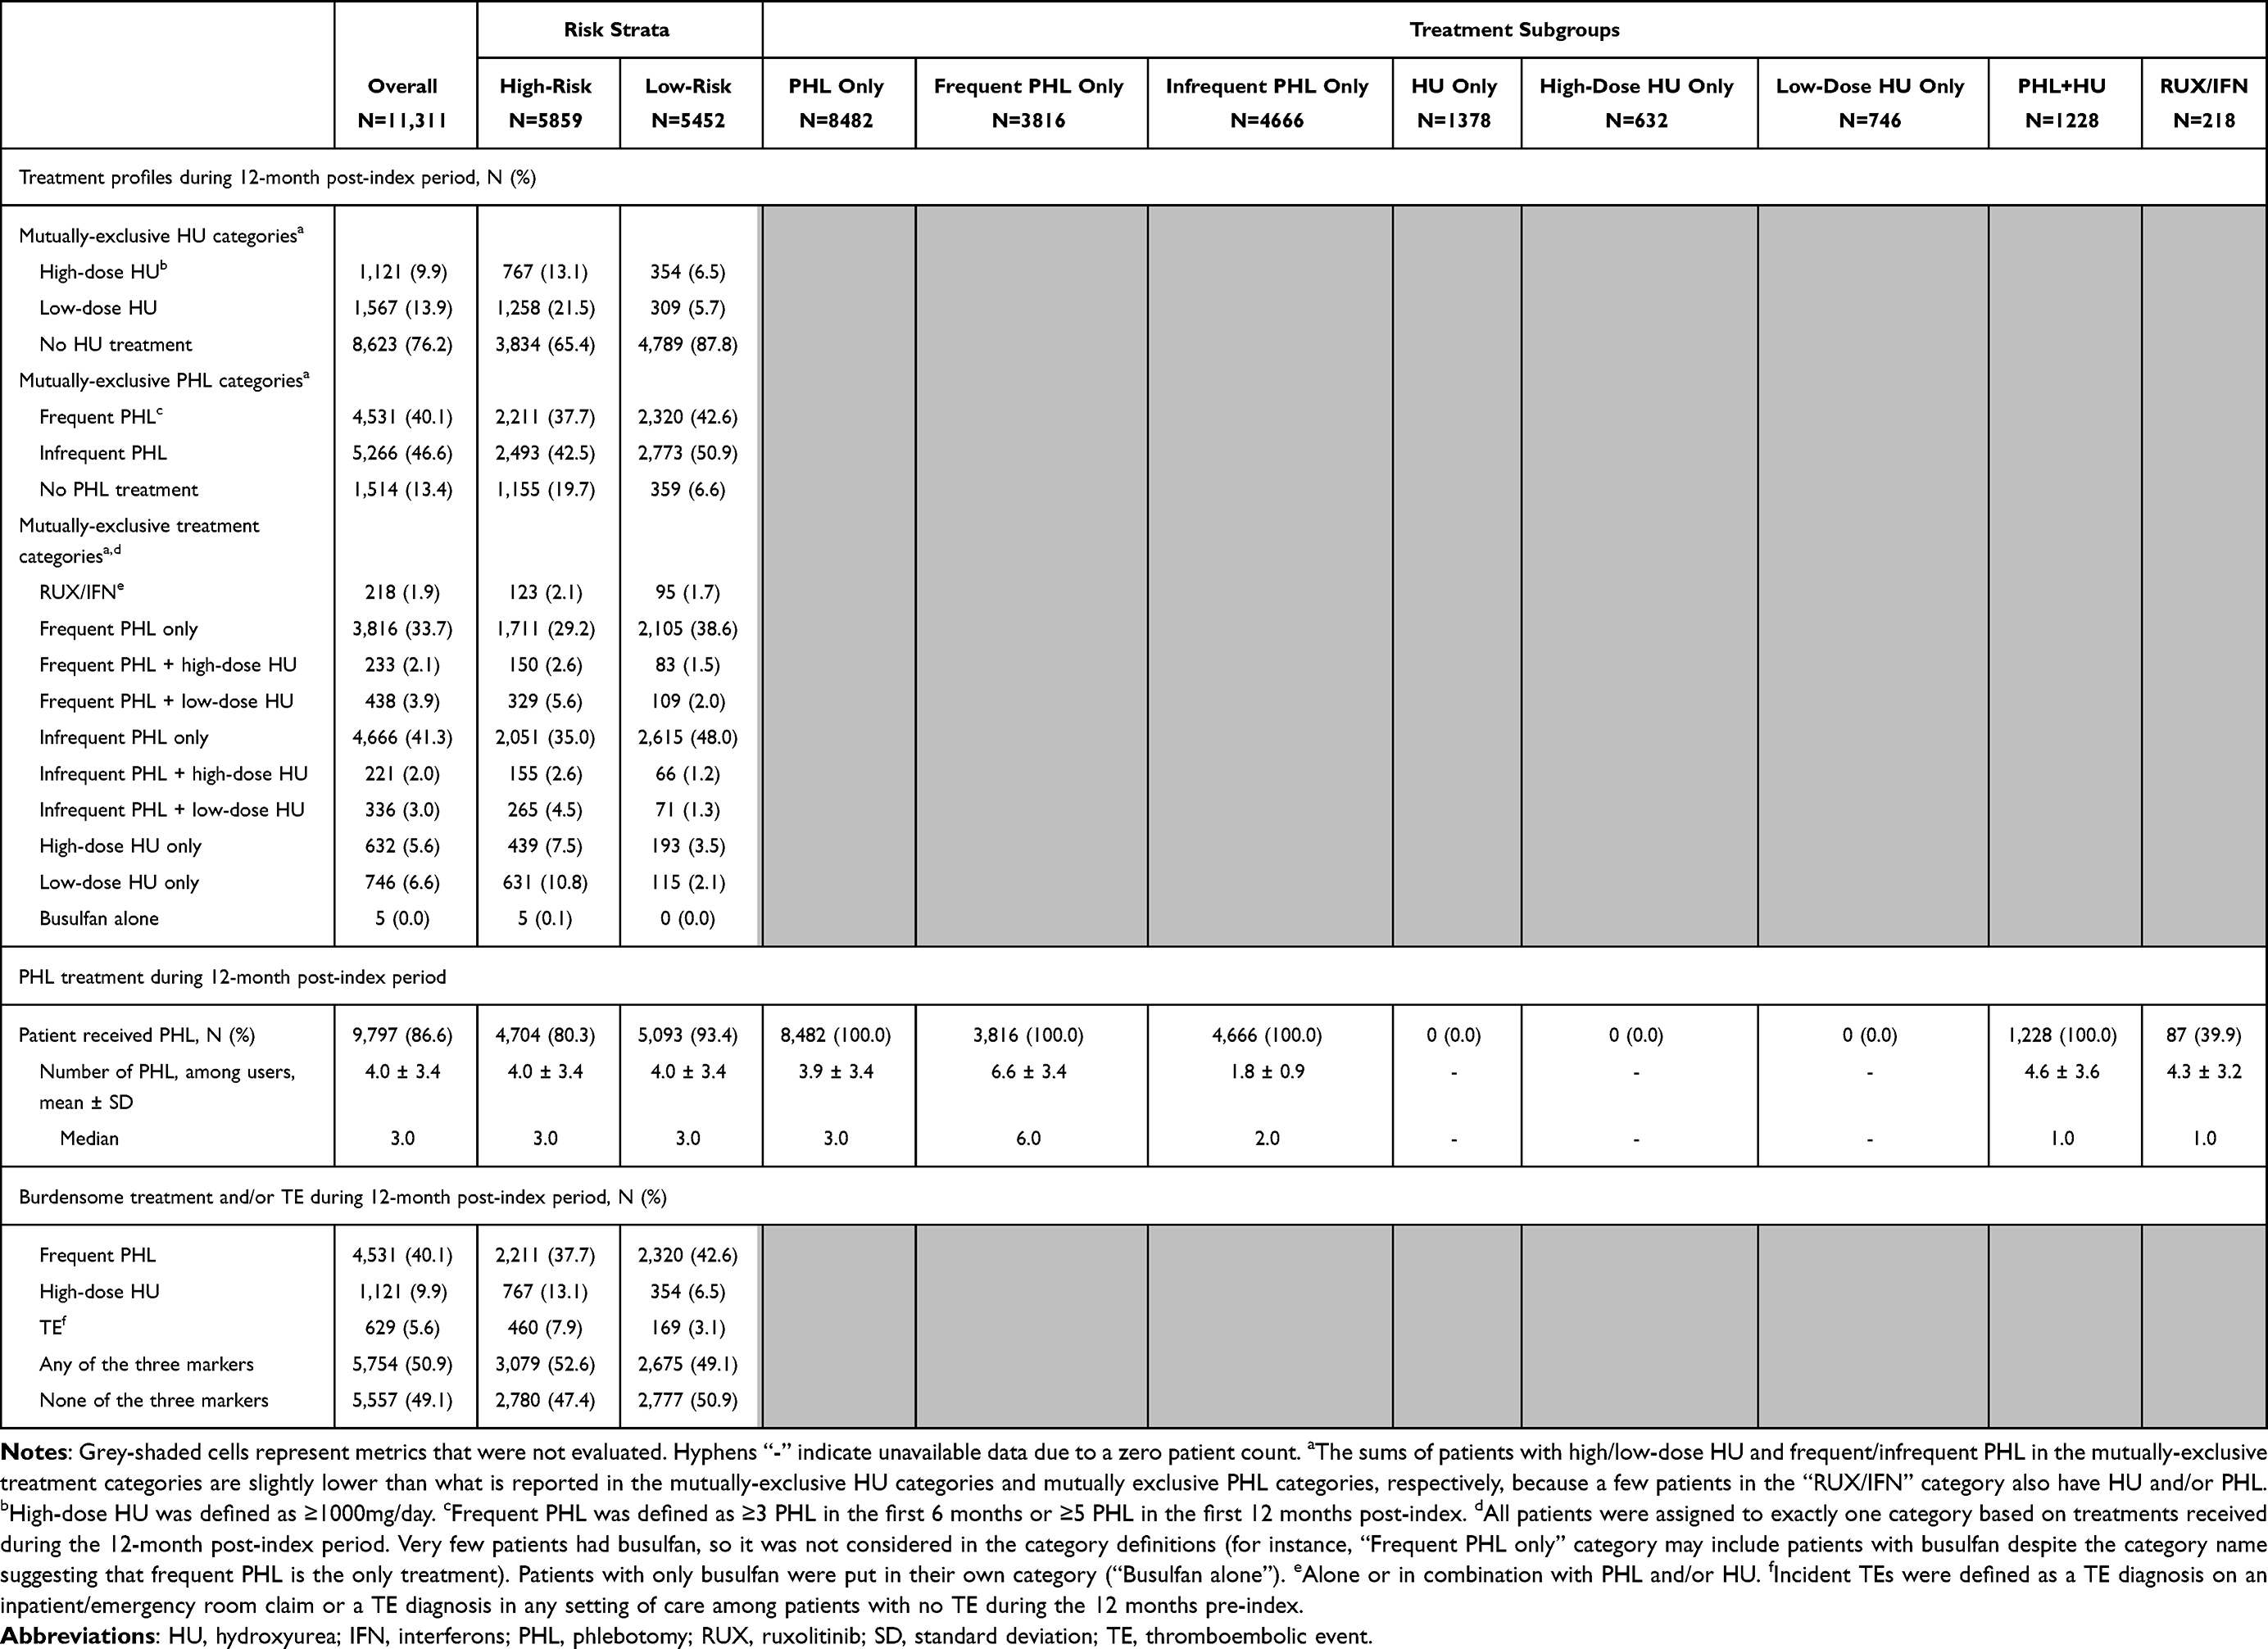 |
Table 2 Treatment Profiles and Burdensome Treatment and/or TE |
Fewer high-risk patients than low-risk patients were managed with PHL only (64.2% vs 86.6%), while a greater proportion of high-risk patients received HU regimens at any dose compared to low-risk patients (34.6% vs 12.2%), including both high-dose HU (13.1% vs 6.5%) and low-dose HU (21.5% vs 5.7%) (Table 2). Treatment trends observed in the overall cohort persisted in both risk groups. A high proportion of PHL users required frequent PHLs (high-risk: 47.0%; low-risk: 45.6%). Among HU users, a substantial proportion received high-dose regimens (high-risk: 37.9%; low-risk: 53.4%), and many of these high-dose HU patients also received frequent PHLs (high-risk: 19.6%; low-risk: 23.4%). Across both risk groups, RUX/IFN utilization remained low (high-risk: 2.1%; low-risk: 1.7%). Additionally, like the overall cohort, both high-risk and low-risk patients were identified with a high rate of burdensome treatment and/or TE (52.6% and 49.1%, respectively).
Clinical Outcomes
During the mean 3.6-year follow-up (median 2.8 years), 9.6% of patients developed incident iron deficiency anemia, 15.3% had an incident TE, and 4.4% had disease progression (Table 3). PV-related symptoms were common with 83.2% of patients experiencing at least one PV-related symptom. The most common PV-related symptoms were difficulty sleeping (37.8%), depression/anxiety (31.2%), fatigue (29.9%), anemia (28.1%), abdominal pain (27.8%), shortness of breath (23.8%), and bleeding (20.8%).
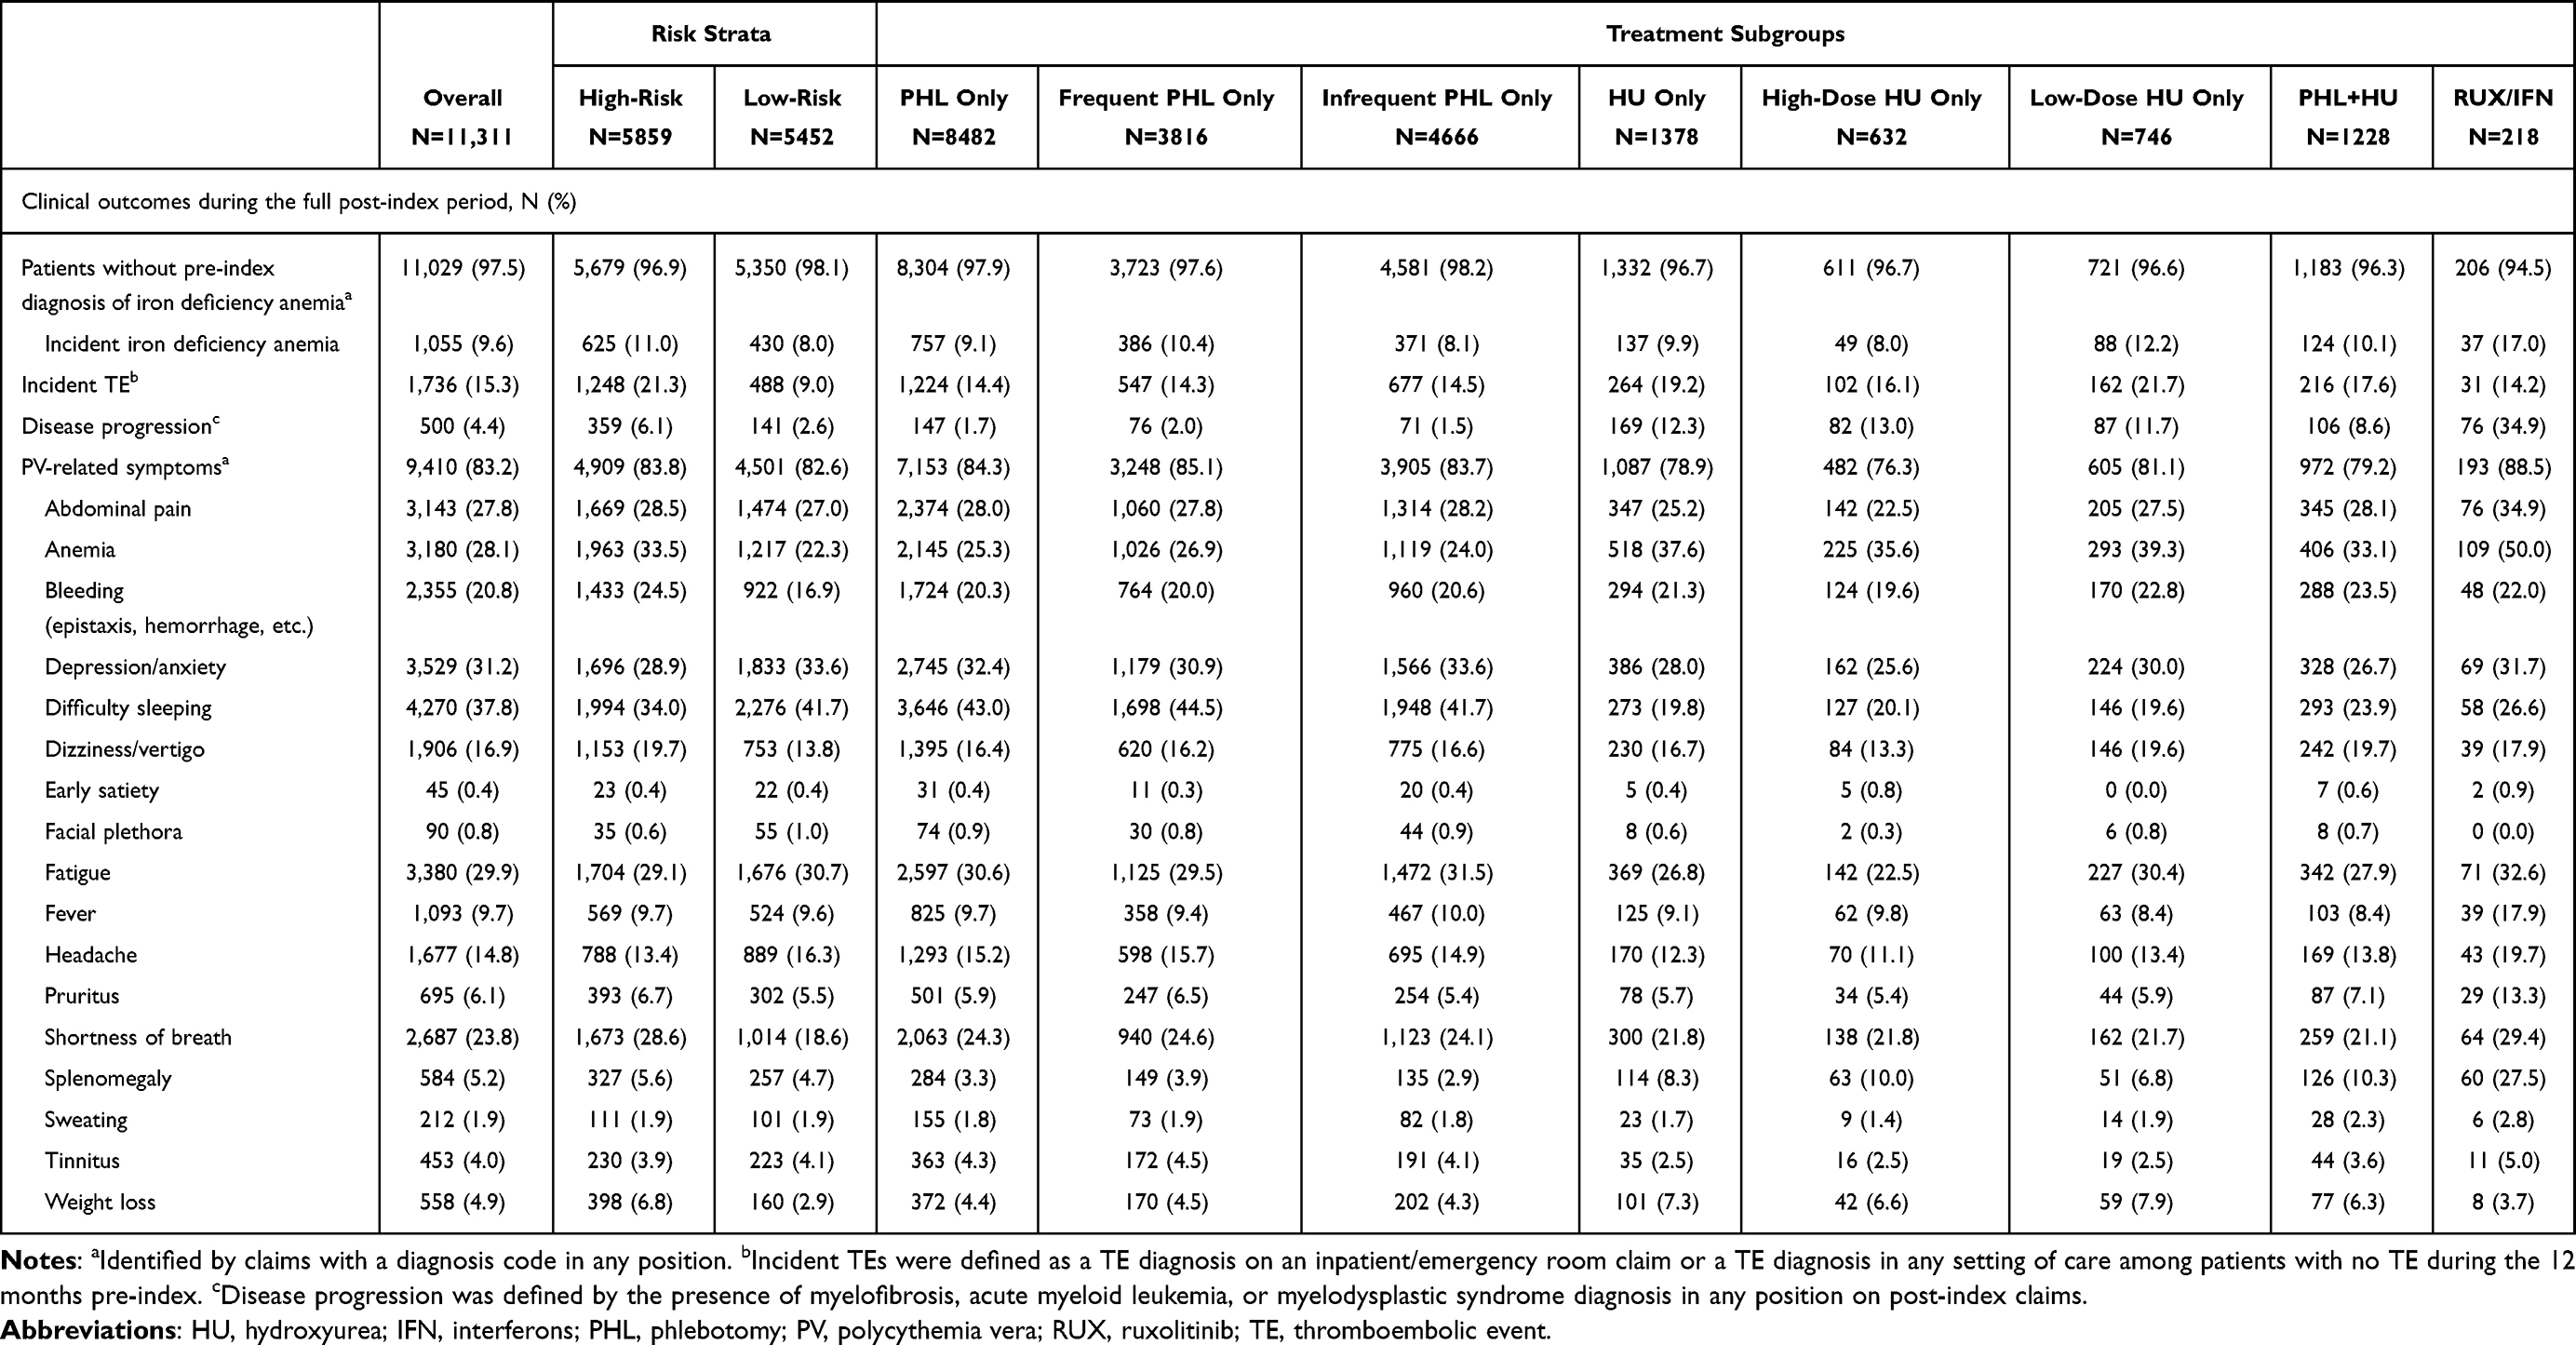 |
Table 3 Clinical Outcomes |
Compared to low-risk patients, high-risk patients were observed with higher rates of incident iron deficiency anemia (11.0% vs 8.0%), incident TE (21.3% vs 9.0%), and disease progression (6.1% vs 2.6%) (Table 3). The overall burden of PV-related symptoms was substantial in both groups, affecting 83.8% of high-risk patients and 82.6% of low-risk patients. While common symptoms like fatigue and abdominal pain had a similar prevalence, high-risk patients were documented with more anemia (33.5% vs 22.3%), shortness of breath (28.6% vs 18.6%), and bleeding (24.5% vs 16.9%), whereas low-risk patients experienced more difficulty sleeping (41.7% vs 34.0%) and depression/anxiety (33.6% vs 28.9%).
Across the treatment groups, the lowest incidence of TE was observed in the RUX/IFN (14.2%) and PHL only (14.4%) groups, while rates were higher in the HU only (19.2%) and PHL+HU (17.6%) groups (Table 3). Incident iron deficiency anemia rates were comparable across the PHL only (9.1%), HU only (9.9%), and PHL+HU (10.1%) groups, but peaked at 17.0% in the RUX/IFN group. Beyond diagnosis codes, iron deficiency was further evaluated with laboratory data for the PHL-involved treatment groups; among patients who had at least two ferritin measurements, 27.6% (81 of 294) of the PHL only and 40.0% (14 of 35) of the PHL+HU groups had an average ferritin level <30 ng/mL indicating iron deficiency (data not shown). The RUX/IFN group experienced a substantially higher rate of disease progression (34.9%) compared to other groups (ranging from 1.7% in PHL only to 12.3% in HU only). Overall PV-related symptom burden was high across all treatment groups. While the prevalence of specific symptoms varied, they were most frequently reported among patients receiving RUX/IFN, suggesting hypotheses regarding the more advanced or treatment-refractory nature of their disease as well as the potential side effects related to these more intensive treatments.
HCT Control and Other Lab Outcomes
For the subset of patients with ≥2 HCT measurements during follow-up (N=1,268) (Figure 1), the average follow-up duration was 4.9 years (median 3.9 years), during which patients had a mean of 11.5 HCT measurements (median 6) (Table 4). High-risk patients had more HCT measurements than low-risk patients (high-risk: mean 13.1 [median 8]; low-risk: mean 9.1 [median 5]). Patients treated with RUX/IFN had more HCT measurements than other treatment groups (PHL only: mean 10.2 [median 6]; HU only: mean 14.1 [median 9]; PHL+HU: mean 15.2 [median 10]; RUX/IFN: mean 27.5 [median 11]).
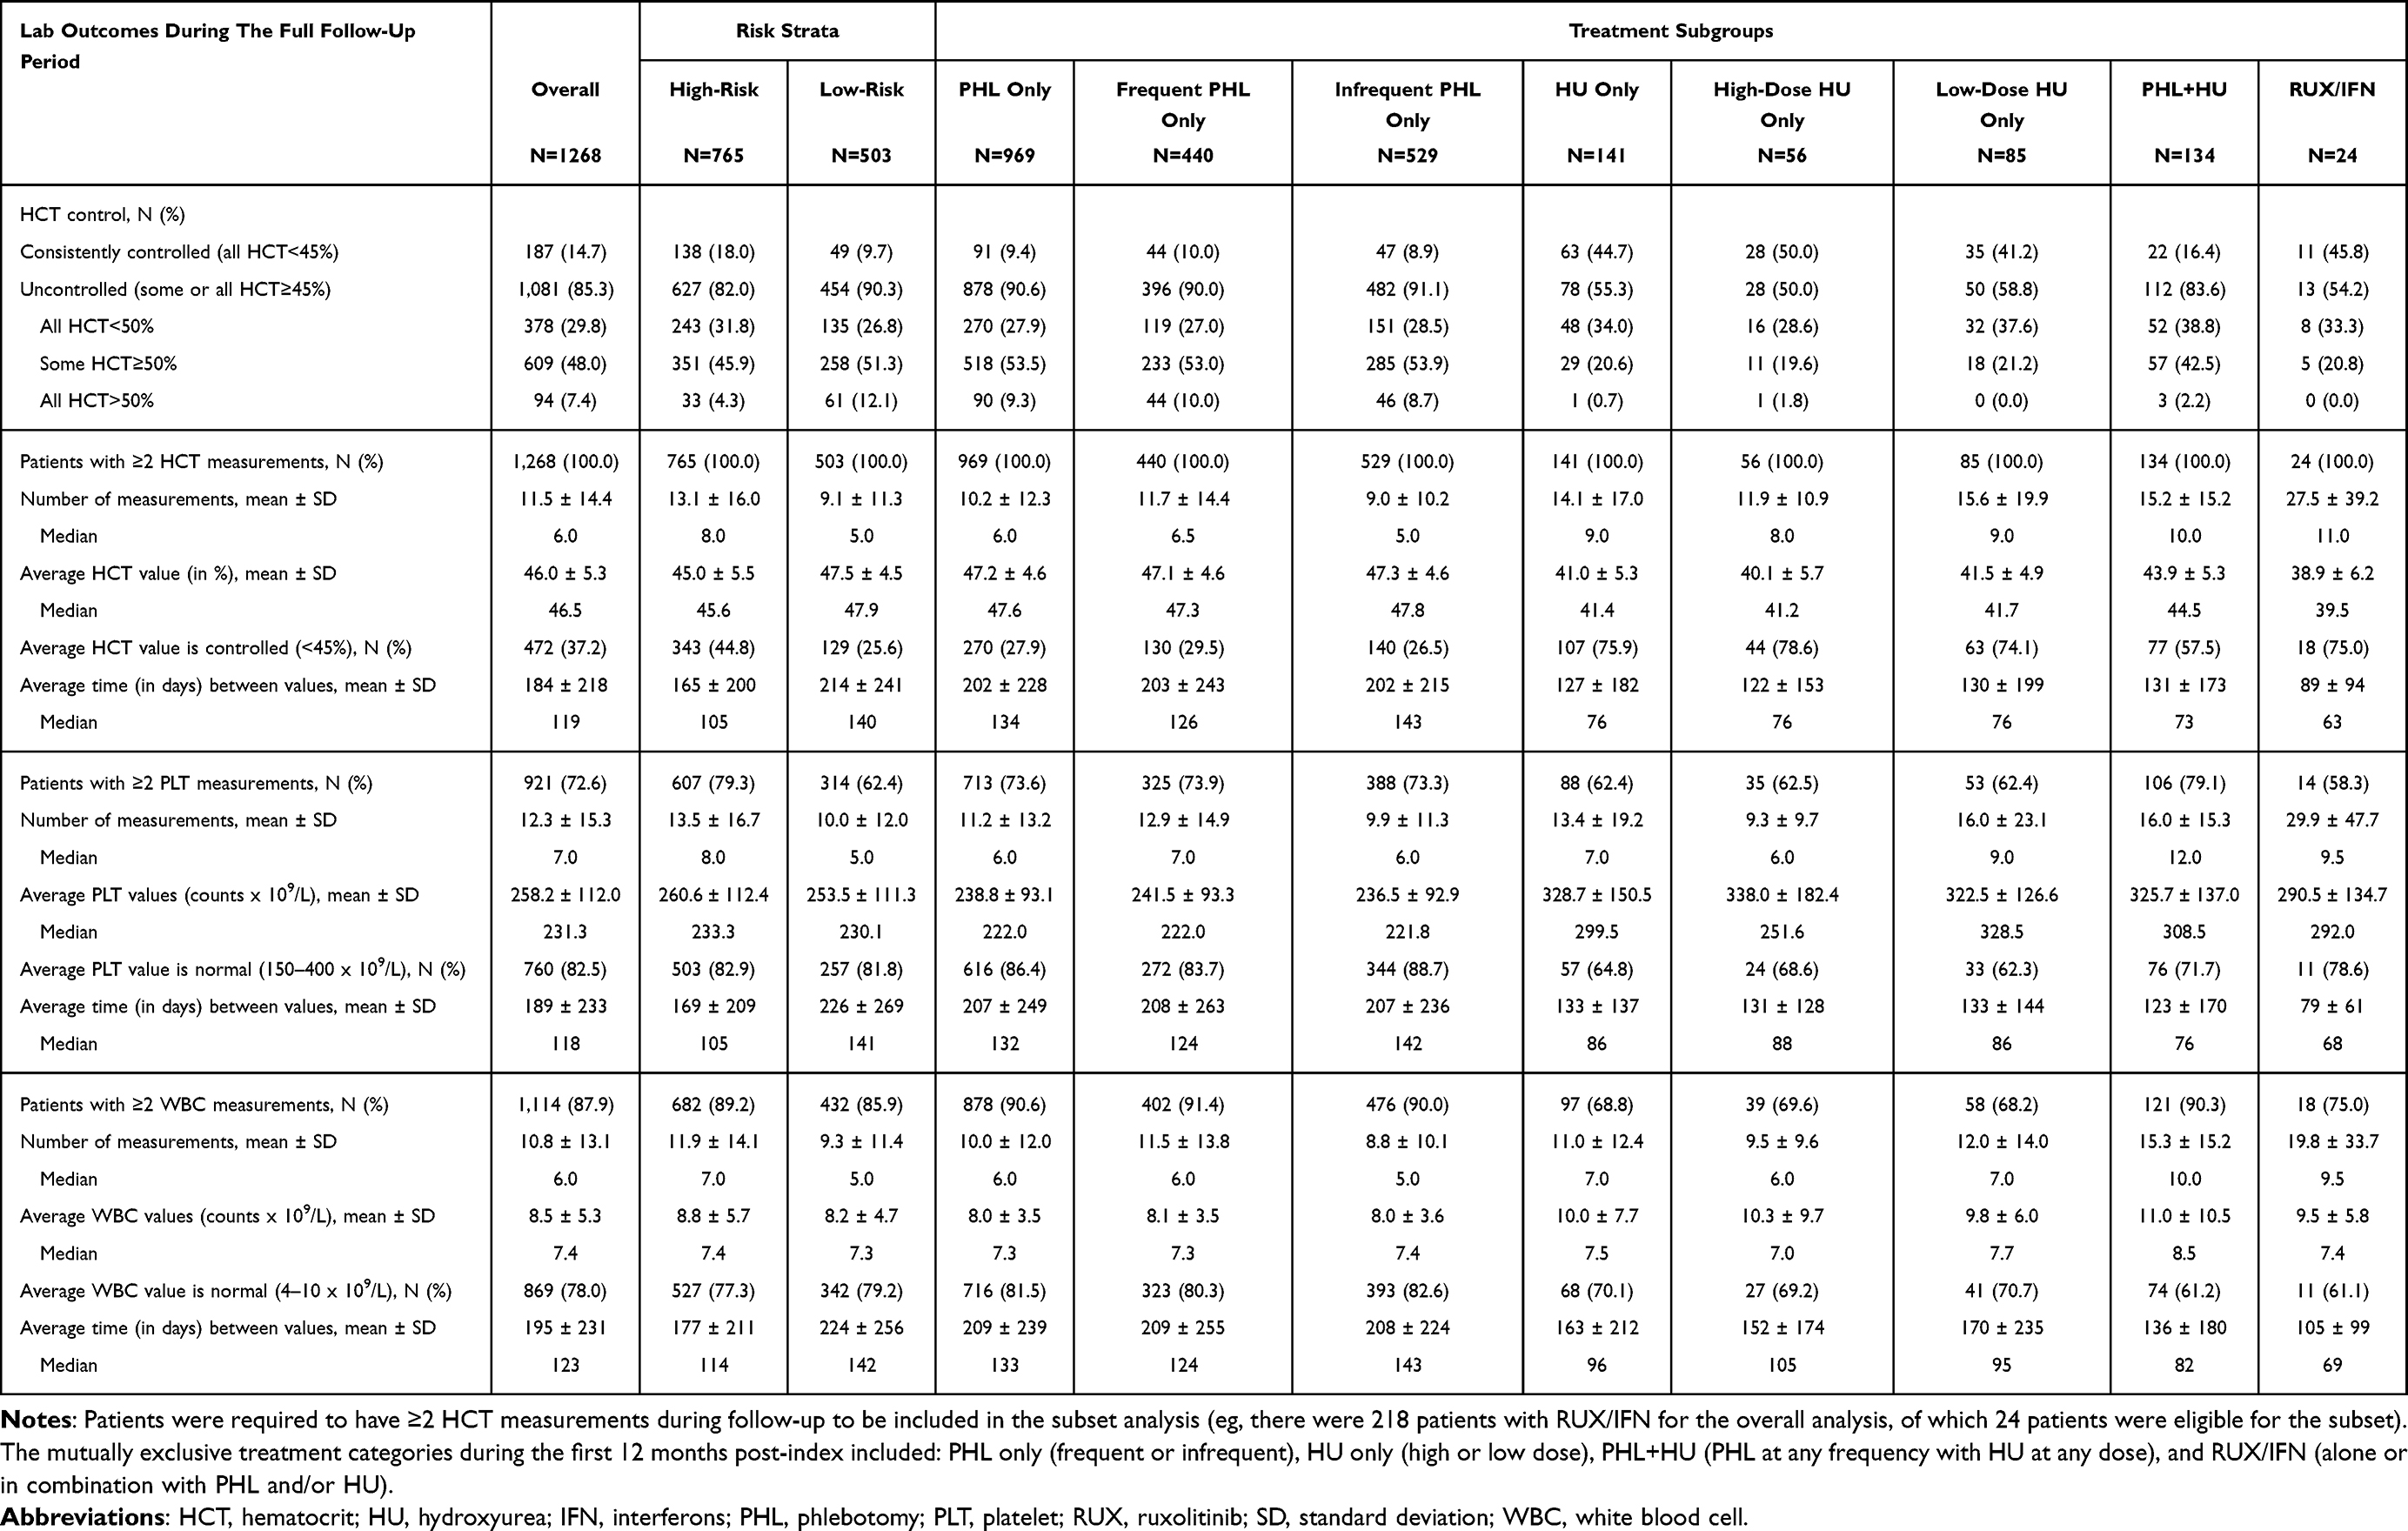 |
Table 4 Lab Outcomes in Patient Subset with HCT Data |
Overall and for both risk groups, the majority of patients had uncontrolled HCT with some or all HCT measurements ≥45% (overall: 85.3%, high-risk: 82.0%, low-risk: 90.3%), with more than half (overall: 55.4%, high-risk, 50.2%, low-risk: 63.4%) having some or all HCT measurements ≥50% (Table 4 and Figure 2A–C). The proportion of patients with an average HCT≥45% was 62.8% overall (55.2% high-risk; 74.4% low-risk).
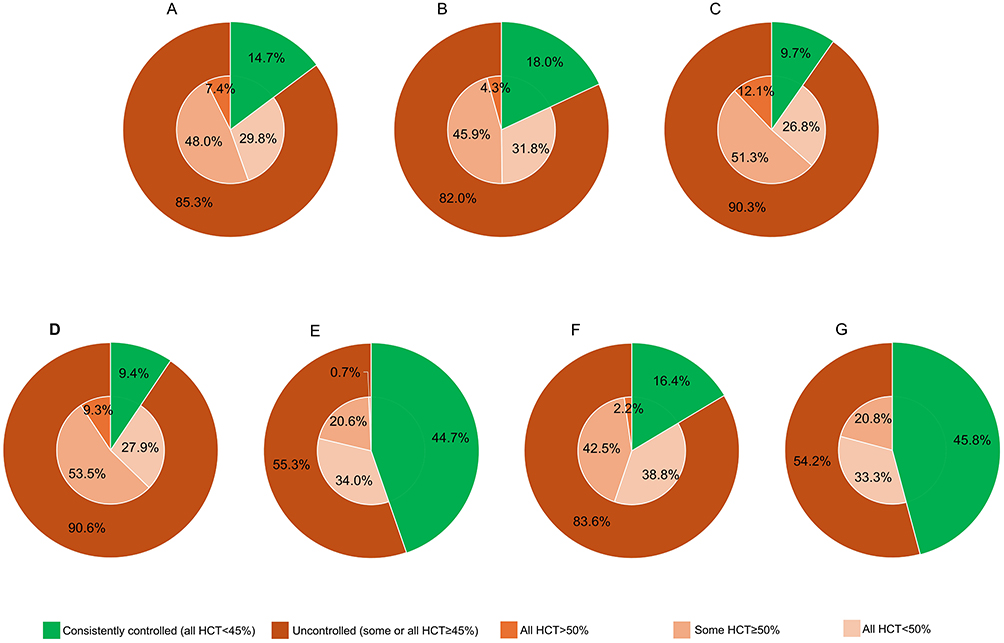 |
Figure 2 HCT control in patient subset with HCT data: Overall (A), by risk strata (B and C), and by treatment subgroups (D–G). (A) Overall (N=1,268); (B) High-risk (N=765). (C) Low-risk (N=503). (D) PHL only (N=969). (E) HU only (N=141). (F) PHL+HU (N=134). (G) RUX/IFN (N=24). Abbreviations: HCT, hematocrit; HU, hydroxyurea; IFN, interferons; PHL, phlebotomy; RUX, ruxolitinib. Notes: Patients were required to have ≥2 HCT measurements during the full follow-up to be included in the subset analysis (eg, there were 218 patients with RUX/IFN for the overall analysis, of which 24 patients were eligible for the subset). HCT data were reported for all patients in the subset (A) and further stratified by polycythemia vera risk (B and C; high vs low risk) and by mutually exclusive treatment groups during the first 12 months post-index (D–G; PHL only [frequent or infrequent], HU only [high or low dose], PHL+HU [PHL at any frequency with HU at any dose], and RUX/IFN [alone or in combination with PHL and/or HU]). The outer ring of the pie chart displays the proportion of patients with controlled vs uncontrolled HCT levels, while the inner ring provides additional detail on the severity of HCT elevation within the uncontrolled group (ie, all HCT<50%, some HCT≥50%, all HCT>50%). |
HCT control varied substantially by treatment subgroups (Table 4 and Figure 2D–G). The PHL only group had the highest rate of uncontrolled HCT with 90.6% of patients having some or all HCT measurements ≥45% and 62.8% of patients having some or all HCT measurements ≥50%. By contrast, the RUX/IFN group had the highest control rate (45.8%), though few patients in the subset with HCT data were in this treatment group (24 of 1,268; 1.9%). The proportion of patients with an average HCT≥45% was highest in PHL only (72.1%), followed by PHL+HU (42.5%), RUX/IFN (25.0%), and HU only (24.1%). Compared with high-risk patients, a greater proportion of low-risk patients were managed with PHL alone (88.5% vs 68.5%; data not shown), which was associated with less effective HCT control than other treatments. This observation suggests that different treatments may influence HCT control, a hypothesis warranting evaluation in future adjusted, longitudinal studies.
Among patients with at least two PLT measurements (N=921), 82.5% had an average PLT value within the normal range (150–400 x 109/L), with similar rates in high- and low-risk patients (82.9% vs 81.8%) (Table 4). Notably, 86.4% of patients receiving PHL only (83.7% frequent; 88.7% infrequent) had normal PLT counts. Similarly, among patients with at least two WBC measurements (N=1,114), 78.0% had an average WBC value within the target range (4–10 x 109/L), with comparable rates in high- and low-risk patients (77.3% vs 79.2%), and normal WBC counts were highest among patients receiving PHL only at 81.5% of patients (80.3% frequent; 82.6% infrequent).
All-Cause Costs During 12-Month Post-TE Period
Among patients who experienced an incident TE and had at least 12 months of data post-TE (N=1,159) (Figure 1), the mean all-cause total costs during the 12-month post-TE period was $71,195 (Table 5 and Figure 3A). Approximately one-third of these costs were attributable to the initial TE (29.2%). Nearly half of initial TEs required hospitalization (42.0% [487 out of 1,159]), with an average length of hospital stay of approximately 7 days. Inpatient care for the initial TE was associated with higher costs compared with care in ER or other outpatient settings. Most initial TEs were arterial (75.0% [869 out of 1,159]). Similar trends were observed for high-risk and low-risk patients (Table 5 and Figure 3B and C), with the mean all-cause total costs during the post-TE period at $68,332 for high-risk patients and $77,867 for low-risk patients.
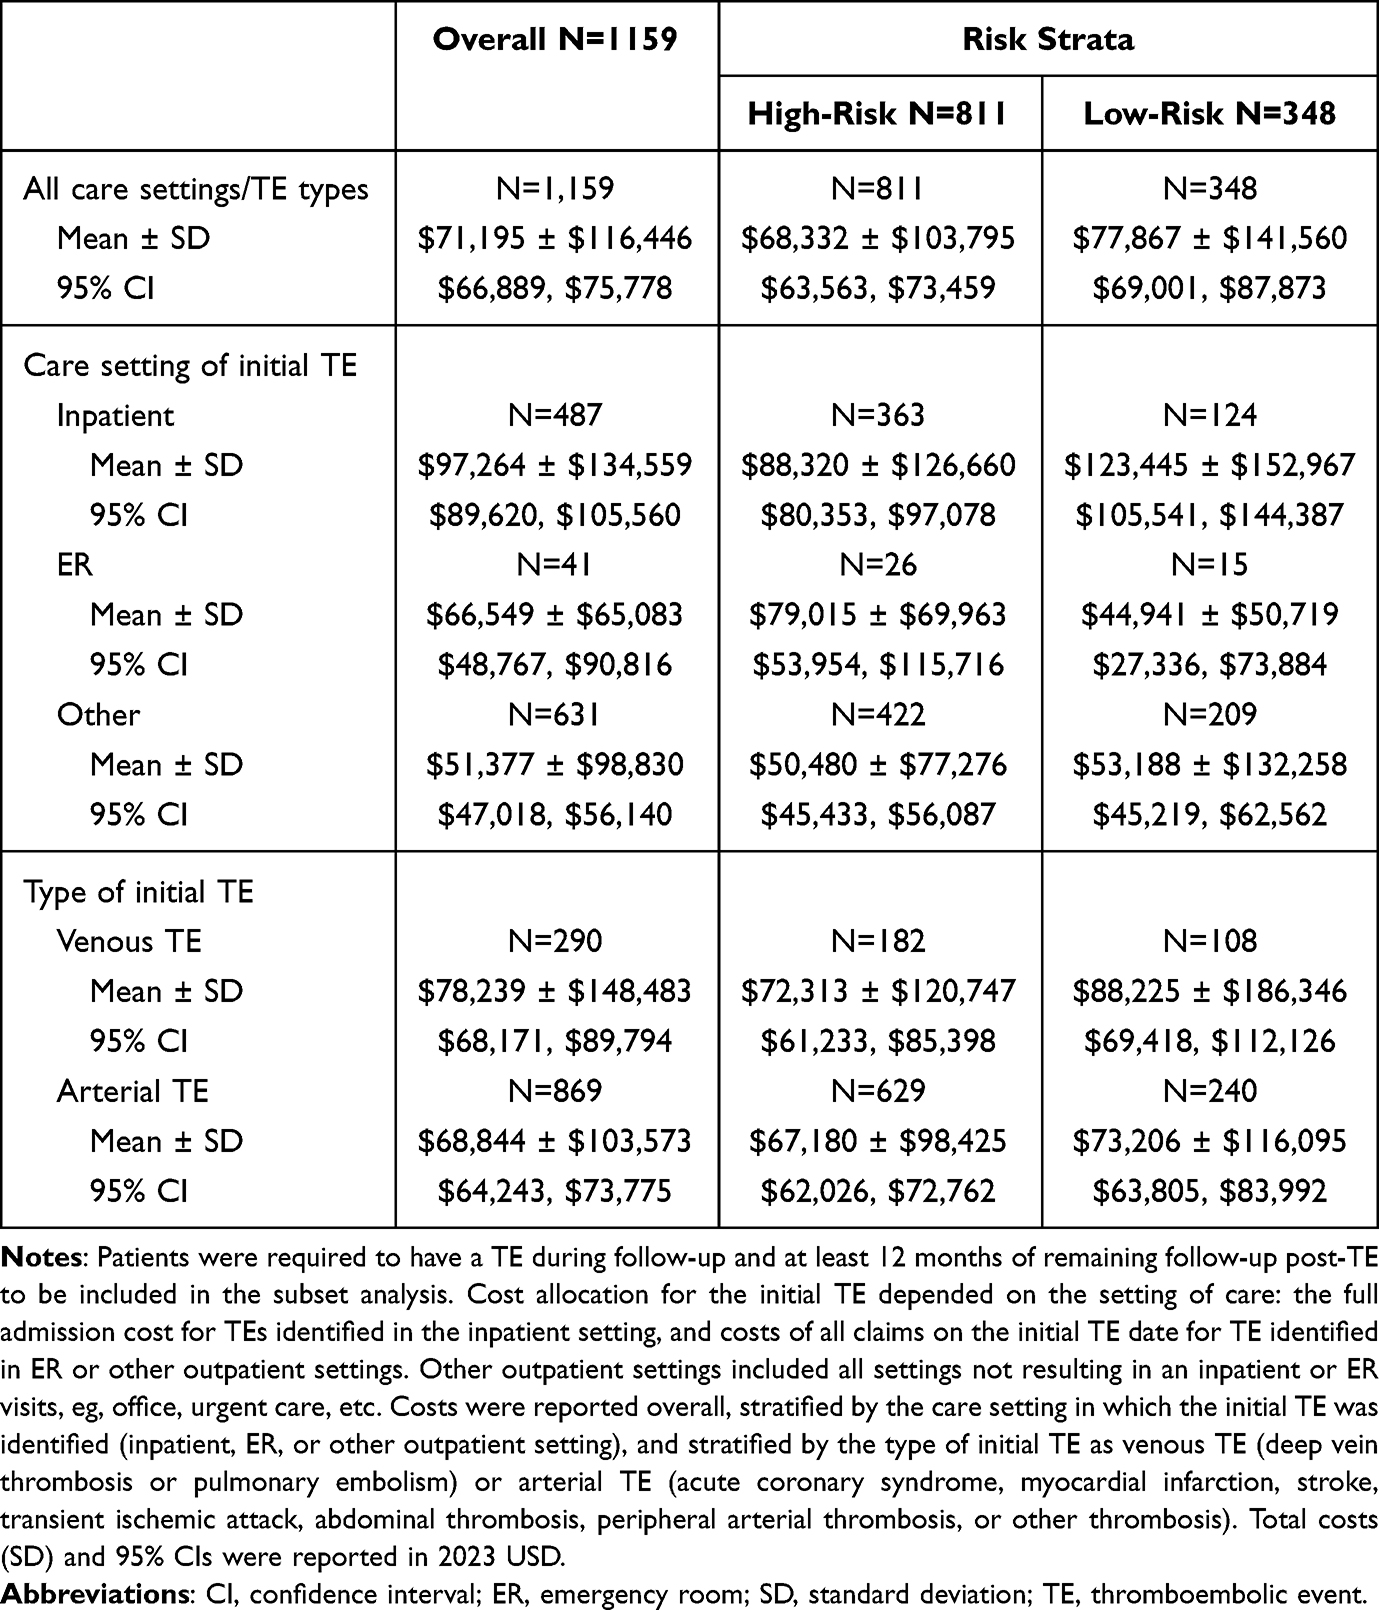 |
Table 5 All-Cause Costs During 12-Month Post-TE Period in Patient Subset with TE |
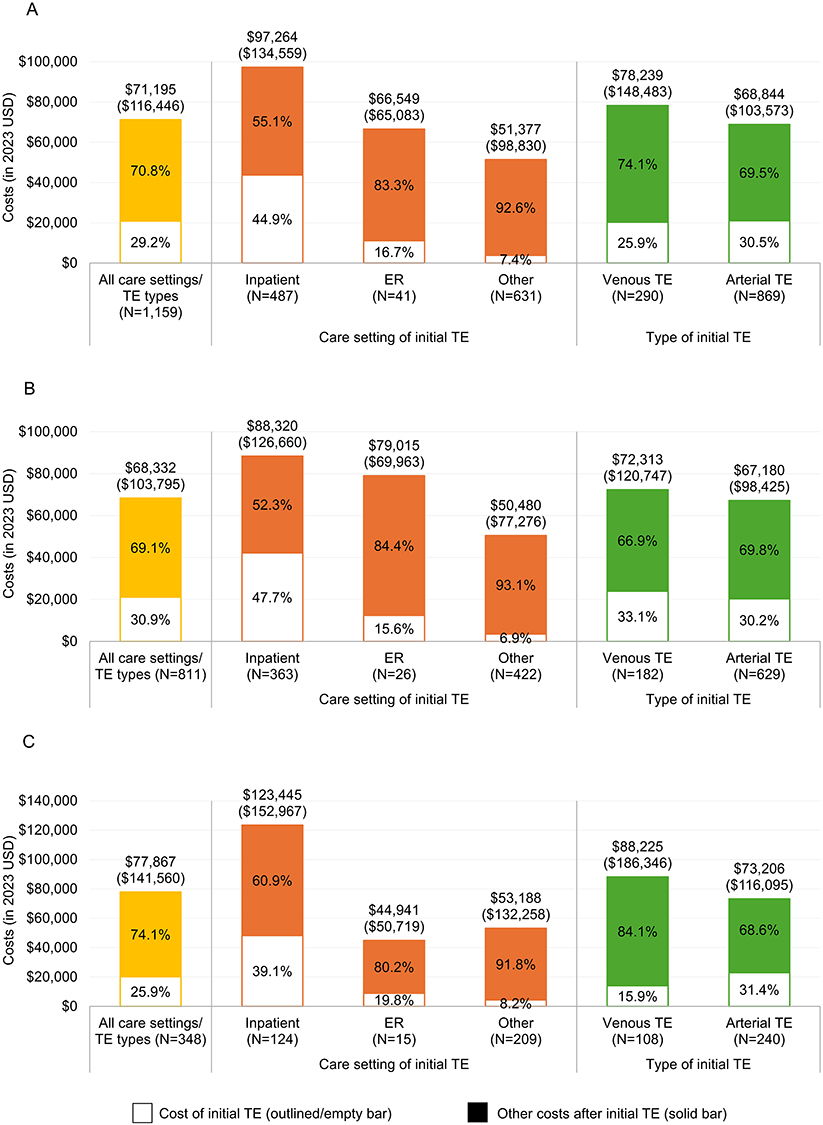 |
Figure 3 All-cause costs during 12-month post-TE period in patient subset with TE: Overall (A) and by risk strata (B and C). (A) Overall (N=1159). (B) High-risk (N=811). (C) Low-risk (N=348). Abbreviations: ER, emergency room; TE, thromboembolic event. Notes: Patients were required to have a TE during follow-up and at least 12 months of remaining follow-up post-TE to be included in the subset analysis. Cost data were reported for all patients in the subset (A) and further stratified by polycythemia vera risk (B and C; high vs low risk). Bar fills (for cost categories): Costs were categorized as those associated with the initial TE (represented by outlined/empty bars) and other costs incurred after the initial TE (represented by solid bars) and were presented as the proportion of total costs. Cost allocation for the initial TE depended on the setting of care: the full admission cost for TEs identified in the inpatient setting, and costs of all claims on the initial TE date for TE identified in ER or other outpatient settings. Other outpatient settings included all settings not resulting in an inpatient or ER visits (eg, office, urgent care, etc.). Bar colors (for data stratification): Costs were reported overall (yellow bars), stratified by the care setting (orange bars) in which the initial TE was identified (inpatient, ER, or other outpatient settings), and stratified by the type of initial TE (green bars) as venous TE (deep vein thrombosis or pulmonary embolism) or arterial TE (acute coronary syndrome, myocardial infarction, stroke, transient ischemic attack, abdominal thrombosis, peripheral arterial thrombosis, or other thrombosis). Total costs (standard deviation) were reported in 2023 USD. |
Discussion
This retrospective observational study provides a comprehensive real-world evaluation of treatment patterns, clinical outcomes (including HCT control and TE risk), and healthcare costs after TE in a cohort of 11,311 patients with PV. Despite the use of available therapies, the high rates of uncontrolled HCT and incident TEs in all risk strata and treatment groups underscore the limitations of current treatments in clinical practice. These findings highlight the need for more proactive, individualized management, including a more consistent implementation of pharmacologic strategies, to mitigate the clinical and economic burden of PV.
Treatment patterns in this study generally followed risk-stratified guidelines,3,5 with a greater proportion of high-risk patients than low-risk patients initiating cytoreductive therapy (35.8% vs 13.4%; includes RUX/IFN and HU). However, PHL only remained the dominant management strategy across the entire cohort (75.0%). PHL is often used as a reactive measure for HCT≥45%,15 which may lead to continuous HCT fluctuations rather than sustained control; in addition, it is unknown how long patients have HCT above 45% before a blood draw reveals the elevated HCT. Notably, 64.2% of high-risk patients were managed with PHL only, despite clinical recommendations for cytoreduction to mitigate thromboembolic risk. This gap in guideline implementation may be due to various factors, including patient or clinician preference for conservative management (eg, hesitancy to initiate chemotherapy with HU), concerns regarding the toxicity of cytoreductive agents, or insufficient awareness of the guideline updates.16 Intolerance may also discourage the initiation and long-term use of cytoreductive agents, given the documented adverse profiles of these agents.16–20 Furthermore, among HU users, a higher proportion of low-risk patients received high-dose regimens than high-risk patients, suggesting that clinicians may prioritize tolerability in older, comorbid high-risk populations. The low use of RUX/IFN (<2% overall) further highlights the conservative nature of real-world PV management. As the established SoC for several decades,21 the preference for PHL and HU may also be based on their greater affordability, broader coverage, and perceived simplicity compared to newer more costly agents, which may require complex prior authorization processes and specialized monitoring.
Although PV-related symptoms were common across risk and treatment groups in this study, interpretation of symptom burden is limited. The true symptom burden may be underestimated because symptoms that do not directly influence reimbursement may be underreported in claims databases. For example, pruritus is one of the most characteristic and clinically significant symptoms of PV with 30% to 68% of patients experiencing it22,23 but only 6% of patients in the current study had a diagnosis code for it. Additionally, the relationship between treatment intensity (frequent vs infrequent PHL) and symptom burden may be circular: treatment intensity may directly contribute to symptoms, but also, patients treated with PHL who experience greater symptom burden may avoid additional procedures after initiation (resulting in patients having infrequent PHL). Furthermore, the reported symptom burden may reflect a combination of disease-related symptoms and side effects from the treatments. For instance, anemia and fatigue were most prevalent among patients receiving RUX/IFN, which may indicate an overlap between advanced disease and known side effects of these therapies.19,20 Thus, distinguishing between symptoms caused by the disease and those resulting from treatment can be challenging. Finally, symptom burden may not correlate with hematologic control. Prospective observational data from the REVEAL study also highlight the complexity in interpretating the symptom burden, showing that fatigue and other symptoms often persist despite hematologic control, suggesting some discordance between laboratory indices and patient experience.6 These findings highlight that real-world symptom burden is multifaceted and not fully captured by claims data alone, indicating the importance of incorporating patient-reported assessments in research and clinical practice.
Several descriptive findings within the RUX/IFN group warrant cautious interpretation. The higher rate of disease progression during follow-up in this group across treatment groups likely reflects confounding by indication rather than a true treatment effect. In clinical practice, RUX and IFN are frequently reserved for advanced, complex, or standard-therapy-refractory patients. Because administrative claims lack granular clinical data and the full longitudinal treatment history, this study may incompletely differentiate baseline prevalent progression from truly incident post-index events, despite the 6-month pre-index exclusion. Conversely, the lower baseline prevalence of cardiovascular risk factors and lower follow-up incidence of TEs in this group were likely influenced by their younger age distribution and higher rate of pre-index TEs, which may have prompted stricter cardiovascular management and TE prevention. Because this study was descriptive and not designed for adjusted comparative effectiveness, these divergent observations highlight the profound impact of treatment selection patterns and baseline characteristics in observational claims data for these treatment groups.
In the subset of patients with HCT data, sub-optimal HCT control was prevalent overall and across both risk categories over an average 5-year follow-up. Most patients were uncontrolled: 85.3% overall, 82.0% of high-risk patients, and 90.3% of low-risk patients had at least one HCT≥45%, with 55.4%, 50.2%, and 63.4%, respectively, having at least one HCT≥50%. These rates are slightly higher than those reported in a recent claims study by Verstovsek et al: 75% of high-risk and 86% of low-risk patients had any HCT≥45%, while 45% and 59%, respectively, had any HCT≥50% over a 2-year follow-up (overall rates were not reported in that prior study).4 The discrepancies could be attributed to differences in duration of follow-up, frequency of HCT measurements, and patient characteristics. In addition, patients on PHL only in the current study had the lowest HCT control (all HCT<45%) at 9.4% compared with patients on other treatments, suggesting PHL alone is insufficient for consistent control. HCT control notably improved with HU, particularly high-dose regimens (50.0%; highest rate among all treatment categories), and RUX/IFN (45.8%). These findings reinforce the established evidence for newer cytoreductive agents as more effective treatment for individuals with PV who need alternatives to PHL and HU.17,20,24
In the present study, patients treated with PHL only (the most common treatment, accounting for about three-quarters of the study population) experienced high rates of normal WBC and PLT counts, despite nearly 90% having uncontrolled HCT. This suggests an erythrocytosis-predominant phenotype (where the overproduction of blood cells is confined to the red blood cell) in this population and highlights a key limitation of PHL in maintaining HCT control in the absence of myelosuppression.3,4,25 While maintaining multi-lineage control is important given that leukocytosis is identified as a predictor of arterial thrombosis,3,26,27 transitioning these patients to traditional cytoreduction presents a clinical dilemma. Cytoreductive therapies like HU, IFN or RUX may cause treatment‑related cytopenias.28,29 Collectively, these findings indicate a therapeutic gap and support the rationale for HCT‑targeted, non‑myelosuppressive approaches, such as hepcidin mimetics/inducers. In clinical trials, among patients inadequately controlled with PHL alone or concurrent cytoreductive therapy, these agents have shown durable HCT control and reduced PHL dependence without the broader myelosuppression burden associated with conventional cytoreduction.14,30,31
Despite the application of risk-adapted therapy, TEs occurred in 15.3% of overall patients (high-risk: 21.3%, low-risk: 9.0%) during a median follow-up of 2.8 years in the current study. These findings are similar to recent claims-based studies, which documented a 16.1% overall TE rate (high-risk: 19.7%; low-risk: 7.5%) over a median 2.2-year follow-up4 and a 16.3% overall rate within 12 months of follow-up.7 The slight differences in TE rates across studies may reflect variations in patient demographics, comorbidity burden, study periods, and TE definitions. Specifically, this study focused on clinically significant, incident TEs, whereas the other two studies included all instances of a TE diagnosis code, some of which may be related to chronic management of a prior TE. The persistent TE burden identified in this study and prior studies likely reflects the challenge of achieving and maintaining optimal HCT control with currently available therapies, as noted above in this study and seen in prior research. Real-world evidence suggests that standard PV treatments often do not sustain HCT<45%.4,32 Additionally, a study using Veterans Health Administration data indicates that patients with HCT≥45% have a significantly higher risk of TEs than those who maintain HCT<45%.33 These findings underscore that traditional therapeutic PHL and cytoreductive agents may provide insufficient HCT control, leaving patients vulnerable to life-threatening TEs and cardiovascular complications.
Finally, the current descriptive analysis of the economic burden of post-TE care found that low-risk patients incurred higher mean all-cause total costs during the 12-month post-TE period than high-risk patients ($77,867 vs $68,332). While this inverse relationship between PV risk and post-TE costs may partially reflect the intensive acute healthcare needs following TE of younger patients (ie, low-risk patients) with less aggressive PV management, it is more likely confounded by a payer bias. More than half (57.6%) of high-risk patients were covered by Medicare, whereas low-risk patients were predominantly (99.3%) commercially insured. Given that Medicare reimbursement rates are generally lower than those of commercial health plans, the observed cost difference likely reflects variation in payment structures rather than a true difference in healthcare resource utilization. These findings highlight the importance of considering payer type when interpreting post-TE costs and suggest that stratified or adjusted analyses by insurance coverage may be informative in future studies. Furthermore, as prior literature demonstrates the association between initial TEs and an increased risk of recurrence,34–36 the economic burden observed in this study likely represents a fraction of the total impact. Recurrent events would increase the healthcare costs through additional hospitalizations and long-term management, highlighting the importance of effective strategies to prevent both initial and subsequent TEs in patients with PV.
The treatment gaps observed in this study suggest that current SoC warrants re-evaluation, including integration of alternative treatment strategies. Despite their therapeutic potential, RUX/IFN appeared underutilized in the current study, with an observed use rate of 1.9%. All other patients were treated with PHL and/or HU. PHL remains a cornerstone for low-risk PV, but recent literature indicates it may impair quality of life, supporting interest in alternative iron-sparing approaches.37 Hepcidin mimetics/inducers offer a promising mechanism to control erythropoiesis by restricting iron availability to the bone marrow, potentially reducing PHL dependence and associated iron deficiency.9 While HU remains a standard practice, concerns regarding its long-term efficacy and safety relative to newer agents highlight the need for continued clinical evaluation.38 Next-generation JAK inhibitors and other targeted therapies currently under clinical evaluation also represent potential novel options for achieving more consistent HCT control and managing disease progression.10–12 Overall, integrating these emerging approaches may help address current treatment gaps and improve long-term outcomes in PV.
Limitations
First, limitations of this study include potential data coding and data entry errors inherent in any retrospective analysis using administrative claims data. For example, the use of cytoreductive treatments and PHL may be under-reported because claims data does not capture medications and services paid for out of pocket by patients.
Second, due to the lack of detailed clinical information in claims data, as opposed to the medical records, this study is subject to potential misclassification of patients with PV and PV-related outcomes. PV-related symptoms, in particular, may be under-reported in claims because they do not impact reimbursement. Iron deficiency anemia may also be under-reported, as it was identified in ~10% of patients despite being a common manifestation of both the underlying PV disease process and its treatments (eg, PHL).39,40 This may be due to coding ambiguity, where healthcare providers may inconsistently use codes for iron deficiency vs iron deficiency anemia,40 leading to potential misclassification and underreporting in claims. It may also be underreported because it is an expected manifestation of PHL treatment.
Third, results may not be generalizable to populations with other types of health coverage such as Medicaid, Tricare for current and former military personnel and their families, and the uninsured. Additionally, the study population may be younger than typical registries or clinical databases, potentially limiting generalizability to older or strictly high-risk populations.
Fourth, treatment profiles reported in this study reflect treatments received in the first 12 months after the index date and thus may reflect treatments occurring earlier in a patient’s PV treatment journey, potentially underestimating the proportion of patients receiving cytoreductive therapy (particularly later-line agents which are often introduced later in the disease course). Of note, patients could have received the treatments during the pre-index period but pre-index treatments were not characterized in this study.
Fifth, because the patient selection window spans an extended period (2011–2022), the findings may be subject to temporal bias due to substantial shifts in the PV treatment landscape, such as the approvals and adoption of RUX and ropeginterferon alfa-2b occurred mid-study. Thus, pooling data across this broad timeframe may introduce clinical heterogeneity and likely underrepresents the contemporary utilization rates of these newer cytoreductive agents.
Sixth, the requirement for ≥12 months of continuous enrollment post-index may introduce survival and immortal time biases. By excluding individuals who died or disenrolled early during follow-up, this selection criterion likely underrepresents the most severely ill patients, potentially underestimating outcomes and representing a conservative evaluation of the true burden.
Seventh, only a subset of the overall population was available for the analysis of HCT control (11.2% of all patients) and analysis of post-TE costs (10.2% of all patients), so sample sizes were smaller for those analyses.
Finally, because this descriptive study did not employ multivariable adjustment for baseline confounding, observed differences between cohorts may reflect underlying variations in disease severity or patient characteristics rather than true differences in outcomes. In addition, concurrently evaluating HCT control and clinical outcomes over variable follow-up also precluded temporal interpretation or longitudinal causal inferences. Future research incorporating multivariable adjustments and longitudinal designs is warranted to isolate the impacts of baseline characteristics, disease duration, and longitudinal HCT control on clinical outcomes such as TE risk.
Conclusions
This descriptive study highlights that patients with both high- and low-risk PV experience a substantial treatment and disease burden with the current SoC. More than 85% of patients in the HCT subset do not consistently maintain HCT<45% despite treatment with available therapies, including PHL and cytoreductive agents. This inadequate HCT control represents a critical clinical challenge with increased risk for life-threatening TEs. Furthermore, the substantial economic impact following TE, costing over $70,000 on average in the subsequent year, highlights the profound healthcare costs associated with these complications. Overall, these findings suggest a critical unmet need for more effective therapeutic strategies that can consistently achieve and maintain HCT control and mitigate the overall PV burden.
Abbreviations
CI, confidence interval; ER, emergency room; HCT, hematocrit; HDAC, histone deacetylase; HU, hydroxyurea; IFN, interferons; JAK-STAT, janus kinase-signal transducers and activators of transcription; LSD1, lysine-specific demethylase 1; MDM2, murine double minute 2; NCI, National Cancer Institute; PHL, phlebotomy; PLT, platelet; PV, polycythemia vera; RUX, ruxolitinib; SD, standard deviation; SoC, standard of care; TE, thromboembolic event; US, United States; WBC, white blood cell.
Data Sharing Statement
The data that support the study findings were provided by Merative. Restrictions apply to the availability of these data, which were used under license for this study and therefore are not publicly available. Requests may be sent to Merative for more information on data availability and licensing.
Acknowledgments
The authors thank David Diakun (Merative) for SAS programming and data management.
Author Contributions
All authors made a significant contribution to the work reported, whether that is in the conception, study design, execution, acquisition of data, analysis and interpretation, or in all these areas; took part in drafting, revising or critically reviewing the article; gave final approval of the version to be published; have agreed on the journal to which the article has been submitted; and agree to be accountable for all aspects of the work.
Funding
This study was funded by Takeda Development Center Americas, Inc.
Disclosure
ATG is on a Data Safety Monitoring Board or Advisory Board of GSK, Rain Oncology, PharmaEssentia, Abbvie, Disc Medicine, Agios, BMS, Keros, Karyopharm, Takeda, Geron, Novartis, AN2, Merck, Incyte and reports Grants or contracts from National Cancer Insitute, outside the submitted work. MJ and ATT are full-time employees of Merative which was contracted by Takeda Development Center Americas, Inc. to conduct this study. QF, AC and LH are full-time employees and stockholders of Takeda. The authors report no other conflicts of interest in this work.
References
1. Stein BL, Oh ST, Berenzon D, et al. Polycythemia vera: an appraisal of the biology and management 10 years after the discovery of JAK2 V617F. J Clin Oncol. 2015;33(33):3953–19. doi:10.1200/JCO.2015.61.6474
2. Mehta J, Wang H, Iqbal SU, Mesa R. Epidemiology of myeloproliferative neoplasms in the United States. Leuk Lymphoma. 2014;55(3):595–600. doi:10.3109/10428194.2013.813500
3. Tefferi A, Barbui T. Polycythemia vera: 2024 update on diagnosis, risk-stratification, and management. Am J Hematol. 2023;98(9):1465–1487. doi:10.1002/ajh.27002
4. Verstovsek S, Pemmaraju N, Reaven NL, et al. Real-world treatments and thrombotic events in polycythemia vera patients in the USA. Ann Hematol. 2023;102(3):571–581. doi:10.1007/s00277-023-05089-6
5. National Comprehensive Cancer Network. NCCN clinical practice guidelines in oncology: myeloproliferative neoplasms. 2025. Available from: https://www.nccn.org/guidelines/guidelines-detail?category=1&id=1477.
6. Grunwald MR, Burke JM, Kuter DJ, et al. Symptom burden and blood counts in patients with polycythemia vera in the United States: an analysis from the REVEAL study. Clin Lymphoma Myeloma Leuk. 2019;19(9):579–584e571. doi:10.1016/j.clml.2019.06.001
7. Parasuraman SV, Shi N, Paranagama DC, Bonafede M. Health care costs and thromboembolic events in hydroxyurea-treated patients with polycythemia vera. J Manag Care Spec Pharm. 2018;24(1):47–55. doi:10.18553/jmcp.2018.24.1.47
8. Goyal RK, Davis KL, Côté I, Mounedji N, Kaye JA. Health care resource use and costs among polycythemia vera patients in the United States: results from an observational cohort study. Value Health. 2015;18(7):A482–A483. doi:10.1016/j.jval.2015.09.1316
9. Kremyanskaya M, Ginzburg YZ, Hoffman R. Modulators of the hepcidin pathway in polycythemia vera and myelofibrosis. Blood. 2026;147(12):1278–1288. doi:10.1182/blood.2025028643
10. Constantinescu SN, Vainchenker W, Pecquet C. Next-generation JAK inhibitors in the treatment of myeloproliferative neoplasms. Blood. 2026;147(12):1255–1266. doi:10.1182/blood.2025028645
11. Gotlib J. Introduction to a review series on the new wave of targeted therapeutics for MPNs. Blood. 2026;147(12):1239–1242. doi:10.1182/blood.2025032534
12. Hassanien D, AlYafei RA, Metwally OH, et al. Advances in polycythemia vera treatment with targeted therapies and clinical trials. Discov Oncol. 2025;16(1):1970. doi:10.1007/s12672-025-03703-9
13. von Elm E, Altman DG, Egger M, et al. The Strengthening the Reporting of Observational Studies in Epidemiology (STROBE) statement: guidelines for reporting observational studies. J Clin Epidemiol. 2008;61(4):344–349. doi:10.1016/j.jclinepi.2007.11.008
14. Kuykendall A, Bankar A, Pettit K, et al. Rusfertide or placebo plus current standard-of-care therapy for polycythemia vera: durability of response and safety results through week 52 from the randomized controlled phase 3 VERIFY study. Blood. 2025;146(Supplement 1):81. doi:10.1182/blood-2025-81
15. Kuykendall AT, Fine JT, Kremyanskaya M. Contemporary challenges in polycythemia vera management from the perspective of patients and physicians. Clin Lymphoma Myeloma Leukemia. 2024;24(8):512–522. doi:10.1016/j.clml.2024.04.003
16. Abu-Zeinah G, Hunter AM, Shatzel JJ, et al. Real-world analysis of polycythemia vera treatment reveals nonadherence to NCCN guidelines in a large proportion of patients. Blood Neoplasia. 2025;2(4):100167. doi:10.1016/j.bneo.2025.100167
17. Gisslinger H, Klade C, Georgiev P, et al. Ropeginterferon alfa-2b versus standard therapy for polycythaemia vera (PROUD-PV and CONTINUATION-PV): a randomised, non-inferiority, phase 3 trial and its extension study. Lancet Haematol. 2020;7(3):e196–e208. doi:10.1016/S2352-3026(19)30236-4
18. Verstovsek S, Vannucchi AM, Griesshammer M, et al. Ruxolitinib versus best available therapy in patients with polycythemia vera: 80-week follow-up from the RESPONSE trial. Haematologica. 2016;101(7):821–829. doi:10.3324/haematol.2016.143644
19. Mascarenhas J, Kosiorek HE, Prchal JT, et al. A randomized phase 3 trial of interferon-alpha vs hydroxyurea in polycythemia vera and essential thrombocythemia. Blood. 2022;139(19):2931–2941. doi:10.1182/blood.2021012743
20. Kiladjian JJ, Zachee P, Hino M, et al. Long-term efficacy and safety of ruxolitinib versus best available therapy in polycythaemia vera (RESPONSE): 5-year follow up of a phase 3 study. Lancet Haematol. 2020;7(3):e226–e237. doi:10.1016/S2352-3026(19)30207-8
21. Tefferi A, Vannucchi AM, Barbui T. Polycythemia vera: historical oversights, diagnostic details, and therapeutic views. Leukemia. 2021;35(12):3339–3351. doi:10.1038/s41375-021-01401-3
22. Gangat N, Strand JJ, Lasho TL, Li CY, Pardanani A, Tefferi A. Pruritus in polycythemia vera is associated with a lower risk of arterial thrombosis. Am J Hematol. 2008;83(6):451–453. doi:10.1002/ajh.21156
23. Siegel FP, Tauscher J, Petrides PE. Aquagenic pruritus in polycythemia vera: characteristics and influence on quality of life in 441 patients. Am J Hematol. 2013;88(8):665–669. doi:10.1002/ajh.23474
24. Passamonti F, Palandri F, Saydam G, et al. Ruxolitinib versus best available therapy in inadequately controlled polycythaemia vera without splenomegaly (RESPONSE-2): 5-year follow up of a randomised, phase 3b study. Lancet Haematol. 2022;9(7):e480–e492. doi:10.1016/S2352-3026(22)00102-8
25. Triguero A, Pedraza A, Perez-Encinas M, et al. Low-risk polycythemia vera treated with phlebotomies: clinical characteristics, hematologic control and complications in 453 patients from the Spanish Registry of Polycythemia Vera. Ann Hematol. 2022;101(10):2231–2239. doi:10.1007/s00277-022-04963-z
26. Gerds AT, Mesa R, Burke JM, et al. Association between elevated white blood cell counts and thrombotic events in polycythemia vera: analysis from REVEAL. Blood. 2024;143(16):1646–1655. doi:10.1182/blood.2023020232
27. Carobbio A, Ferrari A, Masciulli A, Ghirardi A, Barosi G, Barbui T. Leukocytosis and thrombosis in essential thrombocythemia and polycythemia vera: a systematic review and meta-analysis. Blood Adv. 2019;3(11):1729–1737. doi:10.1182/bloodadvances.2019000211
28. Altomare I, Parasuraman S, Paranagama D, et al. Real-world dosing patterns of ruxolitinib in patients with polycythemia vera who are resistant to or intolerant of hydroxyurea. Clin Lymphoma Myeloma Leuk. 2021;21(11):e915–e921. doi:10.1016/j.clml.2021.06.023
29. Lyons RM, Aguilar KM, Sudharshan L, et al. Characteristics, blood counts, treatments, and clinical outcomes of 5871 patients with polycythemia vera treated in US community practices. Curr Med Res Opin. 2025;41(1):43–51. doi:10.1080/03007995.2024.2438996
30. Kremyanskaya M, Kuykendall AT, Pemmaraju N, et al. Rusfertide, a hepcidin mimetic, for control of erythrocytosis in polycythemia vera. N Engl J Med. 2024;390(8):723–735. doi:10.1056/NEJMoa2308809
31. Handa S, Ginzburg Y, Hoffman R, Kremyanskaya M. Hepcidin mimetics in polycythemia vera: resolving the irony of iron deficiency and erythrocytosis. Curr Opin Hematol. 2023;30(2):45–52. doi:10.1097/MOH.0000000000000747
32. Pemmaraju N, Yu J, Vasudevan A, Qureshi H, Braunstein E, Chojecki A. Treatment patterns and blood count control in 10,112 patients with polycythemia vera. Expert Rev Hematol. 2025;18(7):529–536. doi:10.1080/17474086.2025.2520316
33. Parasuraman S, Yu J, Paranagama D, et al. Hematocrit levels and thrombotic events in patients with polycythemia vera: an analysis of Veterans Health Administration data. Ann Hematol. 2019;98(11):2533–2539. doi:10.1007/s00277-019-03793-w
34. Kuykendall AT, Yacoub A, Reaven N, et al. Real-world analysis of thromboembolic event rates in patients in the United States with polycythemia vera. Blood. 2023;142(Supplement 1):137. doi:10.1182/blood-2023-180309
35. Hamulyák EN, Daams JG, Leebeek FWG, et al. A systematic review of antithrombotic treatment of venous thromboembolism in patients with myeloproliferative neoplasms. Blood Adv. 2021;5(1):113–121. doi:10.1182/bloodadvances.2020003628
36. De Stefano V, Passamonti F, Palandri F, et al. Exploring thromboembolic risk factors in polycythemia vera: from current evidence to PROSPERO study design. Ann Hematol. 2025;104(7):3553–3566. doi:10.1007/s00277-025-06466-z
37. Visweshwar N, Fletcher B, Jaglal M, et al. Impact of Phlebotomy on Quality of Life in Low-Risk Polycythemia Vera. J Clin Med. 2024;13(16). doi:10.3390/jcm13164952
38. Manoharan A, Enggist SI. Hydroxyurea: an old drug in need of new clinical trials in myeloproliferative neoplasms? Int Internal Med J. 2024;2(9):01–06. doi:10.33140/IIMJ.02.09.01
39. Edahiro Y, Komatsu N. Iron deficiency and phlebotomy in patients with polycythemia vera. Int J Hematol. 2025;121(1):39–44. doi:10.1007/s12185-024-03868-z
40. Ginzburg YZ, Feola M, Zimran E, Varkonyi J, Ganz T, Hoffman R. Dysregulated iron metabolism in polycythemia vera: etiology and consequences. Leukemia. 2018;32(10):2105–2116. doi:10.1038/s41375-018-0207-9
 © 2026 The Author(s). This work is published and licensed by Dove Medical Press Limited. The
full terms of this license are available at https://www.dovepress.com/terms
and incorporate the Creative Commons Attribution
- Non Commercial (unported, 4.0) License.
By accessing the work you hereby accept the Terms. Non-commercial uses of the work are permitted
without any further permission from Dove Medical Press Limited, provided the work is properly
attributed. For permission for commercial use of this work, please see paragraphs 4.2 and 5 of our Terms.
© 2026 The Author(s). This work is published and licensed by Dove Medical Press Limited. The
full terms of this license are available at https://www.dovepress.com/terms
and incorporate the Creative Commons Attribution
- Non Commercial (unported, 4.0) License.
By accessing the work you hereby accept the Terms. Non-commercial uses of the work are permitted
without any further permission from Dove Medical Press Limited, provided the work is properly
attributed. For permission for commercial use of this work, please see paragraphs 4.2 and 5 of our Terms.