Back to Journals » International Journal of Nanomedicine » Volume 9 » Issue 1
Direct electrochemical oxidation of S-captopril using gold electrodes modified with graphene-AuAg nanocomposites
Authors Pogacean F, Biris AR, Coros M, Lazar MD, Watanabe F, Kannarpady G, Al Said SAF, Biris AS, Pruneanu S
Received 24 July 2013
Accepted for publication 14 November 2013
Published 25 February 2014 Volume 2014:9(1) Pages 1111—1125
DOI https://doi.org/10.2147/IJN.S51992
Checked for plagiarism Yes
Review by Single anonymous peer review
Peer reviewer comments 6
Florina Pogacean,1 Alexandru R Biris,2 Maria Coros,1 Mihaela Diana Lazar,1 Fumiya Watanabe,3 Ganesh K Kannarpady,3 Said A Farha Al Said,4 Alexandru S Biris,3 Stela Pruneanu1
1Department of Isotopic Physics and Technology, 2Department of Mass Spectrometry, Chromatography, and Applied Physics, National Institute for Research and Development of Isotopic and Molecular Technologies, Cluj-Napoca, Romania; 3Center for Integrative Nanotechnology Sciences, University of Arkansas at Little Rock, Little Rock, Arkansas, USA; 4Department of Physics, College of Science, King Abdulaziz University, Jeddah, Saudi Arabia
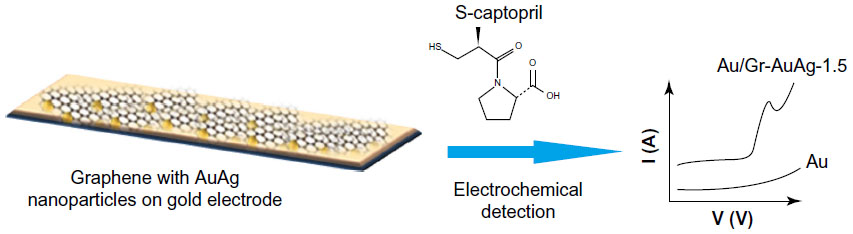
Abstract: In this paper, we present a novel approach for the electrochemical detection of S-captopril based on graphene AuAg nanostructures used to modify an Au electrode. Multi-layer graphene (Gr) sheets decorated with embedded bimetallic AuAg nanoparticles were successfully synthesized catalytically with methane as the carbon source. The two catalytic systems contained 1.0 wt% Ag and 1.0 wt% Au, while the second had a larger concentration of metals (1.5 wt% Ag and 1.5 wt% Au) and was used for the synthesis of the Gr-AuAg-1 and Gr-AuAg-1.5 multicomponent samples. High-resolution transmission electron microscopy analysis indicated the presence of graphene flakes that had regular shapes (square or rectangular) and dimensions in the tens to hundreds of nanometers. We found that the size of the embedded AuAg nanoparticles varied between 5 and 100 nm, with the majority being smaller than 20 nm. Advanced scanning transmission electron microscopy studies indicated a bimetallic characteristic of the metallic clusters. The resulting Gr-AuAg-1 and Gr-AuAg-1.5 samples were used to modify the surface of commonly used Au substrates and subsequently employed for the direct electrochemical oxidation of S-captopril. By comparing the differential pulse voltammograms recorded with the two modified electrodes at various concentrations of captopril, the peak current was determined to be well-defined, even at relatively low concentration (10-5 M), for the Au/Gr-AuAg-1.5 electrode. In contrast, the signals recorded with the Au/Gr-AuAg-1 electrode were poorly defined within a 5×10⁻⁶ to 5×10⁻³ M concentration range, and many of them overlapped with the background. Such composite materials could find significant applications in nanotechnology, sensing, or nanomedicine.
Keywords: bimetallic AuAg nanoparticles, electrochemical detection, multi-layer graphene
Introduction
Graphene, which forms the basis of all carbon nanostructures, has shown outstanding performance in the electrochemical analysis of small biomolecules (adenine, guanine 1–3) in environmental analysis,4,5 and for studying the communication of electrons between the electrode surface and the active center of various enzymes or for biosensing6 without the participation of mediators.7,8
When using graphene in sensor devices, one of the most important issues is the understanding of physical and chemical phenomena that take place at its surface, as well as its interaction with molecules from solution. For example, the orientation of molecules on the graphene surface due to π-π stacking is highly beneficial for improving the transfer of electrons. Therefore, modification of the electrode surface with graphene may significantly improve the characteristics and performance of electrochemical sensors. The graphene sheets facilitate the transfer of electrons between the analyte and the electrode surface, leading to a significant reduction in the activation over-potential.
S-captopril, 1-(3-mercapto-2-(S)-methyl-1-oxopropyl)-S(L) proline, is an angiotensin-converting enzyme inhibitor used to treat cardiovascular disease. Captopril has three possible stereoisomers due to the presence of asymmetric centers associated with proline and the 3-mercapto-2-methylpropionic acid side chain. One of these lacks angiotensin-converting enzyme-inhibiting activity and must therefore be eliminated from pharmaceutical pills that must contain only the S-enantiomer: R-captopril, 1-(3-mercapto-2(S)-methyl-1-oxopropyl)-R(D)-proline.9,10 The oxidation of the thiol group is critical to the electrochemical determination of S-captopril and can be accomplished at the surface of various electrodes.
Rezaei and Damiri11 studied the electrochemical detection of S-captopril, using a hexacyanoferrate (HCF) (II) electro-catalyst and a multiwalled carbon nanotube (MWCNT)-modified glassy carbon electrode, and found that this system greatly increased electro-catalytic activity toward the oxidation of captopril in acidic solutions. In contrast, an iron-oxide nanoparticle-modified carbon-paste electrode did not show any electro-catalytic effect on the oxidation of captopril. They concluded that iron-oxide impurities in the MWCNTs were not active sites for captopril sensing. The performance of the MWCNT-HCF system was compared with that of other reported systems and was found to have a relatively wider dynamic range (0.5–600.0 μM) and suitable selectivity, with a detection limit of around 0.2 μM, and excellent precision (relative standard deviation <3%).
Bahramipur and Jalali12 used chlorpromazine, an appropriate mediator, to investigate the oxidation of captopril. The electrochemical properties of chlorpromazine were characterized by cyclic voltammetry and chronoamperometry; its electro-catalytic effect on captopril oxidation was then studied. Two kinetic parameters – the rate constant of catalytic reaction as well as the electron-transfer coefficient – were found to be 8.48×10² M−1s−1and 0.34, respectively.
Ensafi et al13 used a vinylferrocene-modified MWCNT-paste electrode to investigate the electrochemical behavior of captopril. Cyclic voltammetric experiments indicated that their system showed remarkably enhanced electro-catalytic activity toward the oxidation of captopril, in an aqueous buffer solution of pH 8. The calibration curve for captopril was linear in the concentration range of 0.2–400.0 μmol · L−1 with a detection limit of 0.08 μmol · L−1. Satisfactory results were obtained when this electrode was used to detect captopril in real samples, such as drugs and urine.
Recently, Sattarahmady et al14 synthesized a nanocomposite consisting of cobalt HCF/reduced graphene oxide using a facile precipitation route. Cobalt HCF was deposited as <50 nm diameter nanoparticles on the surface of graphene sheets. The nanocomposite was then used in the modification of a carbon-paste electrode to study the electro-oxidation of captopril. They reported that, in the presence of captopril, the anodic peak current of the Fe(II)/Fe(III) transition increased, while the peak currents of the Co(II)/Co(III) transition remained almost constant. As a result, the authors suggested that the captopril had been oxidized on the modified electrode surface through an electro-catalytic reaction. Based on this method, the detection limit of captopril was 0.331 μM.
All of the reported research described here found that it was necessary to employ redox mediators either in solution or adsorbed on the electrode surface to enhance the signal corresponding to captopril oxidation. Following this group’s recent papers on the synthesis and applications of composite materials based on graphene and metal nanoparticles,15,16 herein, we report on an extension of this research and present, for the first time, insofar as we are aware, the direct electrochemical oxidation of S-captopril using electrodes modified with graphene and bimetallic AuAg nanoparticles. As we have observed so far, the morphological and structural properties of graphene decorated with bimetallic nanoparticles are different compared with those of graphene decorated with metallic nanoparticles. This finding is in excellent agreement with several earlier reports that have clearly indicated that bimetallic nanoparticles exhibit an enhanced electro-catalytic activity compared with pure metal nanoparticles.17–19 A similar behavior was also reported for multicomponent systems formed of graphene sheets decorated with bimetallic nanoparticles.20
In their recent work, Hu et al21 demonstrated that graphene-bimetallic Pt-Au nanoparticles exhibited an enhanced electro-catalytic activity, compared with Au–graphene or Pt-graphene. By using cyclic voltammetry, they showed that the Pt-Au-graphene catalyst was better than Au-graphene or Pt-graphene, for both the oxygen reduction reaction and the methanol oxidation reaction.
Based on such interesting prior findings, the purpose of the present work reported here was to compare the electro-catalytic properties of graphene decorated with various amounts of bimetallic AuAg nanoparticles, which are believed to be highly electrochemically active. The approach used a process developed in this group’s laboratories that results in the synthesis of metallic nanoparticle-graphene composites in one step.
The morphological and structural characteristics of the composite materials were investigated by transmission electron microscopy (TEM)/scanning transmission electron microscopy (STEM) techniques, X-ray powder diffraction (XRD), thermal gravimetric analysis (TGA), and BET (Brunauer–Emmett–Teller) analysis. Moreover, differential pulse voltammetry (DPV) and electrochemical impedance spectroscopy (EIS) were employed to characterize Au substrates modified with graphene-AuAg composites, in the presence of various concentrations of captopril. The EIS experimental data were analyzed based on an equivalent electrical circuit, which took into consideration the Warburg impedance (Zwt), charge-transfer resistance (Rct), solution resistance (Rs), and a constant-phase element (CPE) that modeled the nonideal capacitive response of the interface.
Materials and methods
Preparation of Au-Ag/MgO catalysts and the corresponding graphene-AuAg composites
Two types of mixed catalysts (Au-Ag/MgO) were prepared by sequential deposition of Au and Ag on MgO (SC Biochemicals SRL, Cluj-Napoca, Romania), as previously described in detail.22 In the case of the first catalyst (Au-Ag [1 wt%]/MgO), 1.0 wt% Au and 1.0 wt% Ag were used, while, in the case of the second catalyst (Au-Ag [1.5 wt%]/MgO), these amounts were larger: 1.5 wt% Au and 1.5 wt% Ag. Briefly, Ag was deposited first by wet impregnation of MgO with an aqueous solution of AgNO3 followed by Au deposition (by homogeneous deposition–precipitation method with urea). After deposition, the catalysts were thermally treated at 200°C for 2 hours in the air, then at 250°C for 3.5 hours. Next, inductively coupled plasma mass spectrometry analysis was performed with a Perkin Elmer ELAN DRC – (e) instrument (Waltham, MA, USA) to determine the real amount of Au and Ag deposited onto the MgO support during preparation of the catalysts. Hence, for the determination of Au concentration, the Au-Ag/MgO catalyst sample was first dissolved in aqua regia, and the resulting AgCl precipitate was solubilized with NH4OH solution. For the determination of Ag concentration, the catalyst sample was dissolved in concentrated HNO3. The inductively coupled plasma mass spectrometry analysis proved that, in the case of the first catalyst (Au-Ag [1 wt%]/MgO), the Au/Ag ratio was in fact 0.9/0.5 (wt%), while, in the case of the second catalyst (Au-Ag [1.5 wt%]/MgO), the Au/Ag ratio was 1.2/0.9 (wt%).23
The mixed catalysts were then used for the synthesis of graphene sheets with embedded Au and Ag nanoparticles.22 A small amount of each Au-Ag/MgO catalyst (about 50 mg) was uniformly dispersed in a graphite crucible, which was then positioned inside a quartz reactor (with an internal diameter of 3 cm and length of 50 cm). The entire reactor was introduced into the center of a water-cooled copper-tube coil that was connected to a high-frequency generator (1.2 MHz, 5 kW). Next, argon was flown (300 mL · min−1) for 10 minutes to remove the air present in the chemical vapor deposition (CVD) chamber. Afterward, the crucible was heated to 500°C for 5 minutes and then to 1,000°C (for 45 minutes – synthesis temperature) at which point methane gas was allowed into the reactor along with the argon flow (100 mL · min−1). During the entire synthesis process, the crucible temperature was monitored with a sensitive infrared thermometer (Pyrometer Impac IGA 8 plus, LumaSense Technologies, Inc, Santa Clara, CA, USA). At the end of the synthesis process, the methane flow was stopped, and the crucible was cooled in argon flow until its temperature decreased to room temperature.
To remove the amorphous carbon and the MgO catalyst support, the synthesis product was purified in two steps. In the first step, the product was oxidized in the air for 30 minutes (at 450°C), with a heating rate of 10°C · min−1, to remove the unwanted amorphous carbon. Second, the MgO support was removed by sonication in aqueous HCl (1:1) for 30 minutes at room temperature. After these steps, the product was kept in HCl for 24 hours, then filtered before being washed with distilled water until a neutral pH was obtained. The purified graphene nanostructures were dried overnight at 120°C and next used for the modification of an Au electrode. The graphene nanostructures were thereafter denoted as “Gr-AuAg-1” and “Gr-AuAg-1.5”, corresponding to each mixed catalyst.
Au electrode modified with Gr-AuAg nanostructures (Au/Gr-AuAg-1 and Au/Gr-AuAg-1.5)
Prior to modification with each composite material, the Au electrodes were electrochemically cleaned by cyclic voltammetry in 0.2 M H2SO4 solution (50 cycles from −0.25 to +1.6 V vs Ag/AgCl, at a scan rate of 50 mV · s−1) and then by ultrasound in both ethanol and double-distilled water (3 minutes each time). Subsequently, 20 μL of colloidal suspension of each composite material in dimethylformamide (0.5 mg · mL−1) were deposited onto the metallic substrate and dried at room temperature for about 1 hour. In our experience, this time is long enough to allow the graphene nanostructures to attach to the electrode surface. Following this process, the surface of the electrodes was fully covered by graphene.
The electrochemical measurements (DPV and EIS) were performed with an Autolab 302N Potentiostat/Galvanostat (Metrohm Autolab B.V., Utrecht, the Netherlands) connected to a three-electrode cell and a personal computer. The working- and the counter-electrode had surface areas of 0.07 and 2 cm2, respectively; an Ag/AgCl electrode was used as a reference. DPV measurements were generally recorded between 0.35 and +1.0 V/Ag(AgCl), at a scan rate of 50 mVs−1. EIS measurements were recorded over a 0.1–105 Hz frequency range at an applied potential of +0.85 versus Ag/AgCl. The electrochemical experiments were carried out in deaerated solutions of phosphate-buffered saline (PBS) of pH 6 at various concentrations of captopril (5×10⁻⁶ to 5×10⁻³ M).
Morphological and structural characterization of Gr-AuAg-1 and Gr-AuAg-1.5 composites
The morphological characteristics of the graphene-metal nanoparticle composites were investigated by TEM/STEM, using a JEOL JEM-2100F Transmission Electron Microscope (Tokyo, Japan) equipped with X-ray energy dispersive spectroscopy (XEDS) detectors by EDAX Inc (Mahwah, NJ, USA). TEM/STEM studies were performed at 80 kV.
TGA analysis was performed using an SDT Q 600 instrument (TA Instruments, New Castle, DE, USA), within the temperature range of 25°C–800°C and at a heating rate of 5°C · min−1, in airflow (100 mL · min−1).
X-ray powder diffraction data were collected in the 2θ =15–85° angular domain with a Bruker D8 Advance diffractometer (Bruker Corporation, Billerica, MA, USA) using Cu Kα1 radiation (λ=1.5406 Å). A germanium (111) monochromator (Vario 1, Bruker Corporation) in the incident beam was used to eliminate the Kα2 radiation.
BET analysis
Nitrogen adsorption–desorption isotherms, registered at −196°C, were used to determine the total surface area (St), pore volume (Vp), and pore radius (Rm) of the Gr-AuAg-1 and Gr-AuAg-1.5 samples. The BET method was used for total surface area determination and the Dollimore-Heal model for porosity results. The isotherms were registered using a Sorptomatic 1990 apparatus (Thermo Fisher Scientific Inc., Waltham, MA, USA). The graphene-composite samples (approximately 200 mg) were degassed at 200°C for 4 hours in vacuum (1 Pa) prior to determination, to remove the physisorbed impurities from the sample surface.
The total surface areas of the graphene-composite samples were 145 m2 · g−1 for Gr-AuAg-1 and 247 m2 · g−1 for Gr-AuAg-1.5. These values are in the same domain as those recently reported in the literature.24 The pore volume was 0.42 cm3 · g−1 for Gr-AuAg-1 and 0.71 cm3 · g−1 for Gr-AuAg-1.5. The distribution of pore radius was relatively broad for both composites, with the majority of pores in the mesoporous domain, having the radius between 20 and 200 Å.
Chemical studies of the Gr-AuAg-1 and Gr-AuAg-1.5 composites
X-ray photoelectron spectroscopy (K-Alpha, Thermo Fisher Scientific Inc.) was used to study the nature of chemical status of the Au and Ag nanoparticles in the composites. A monochromated Al Kα (hυ =1436.6 eV) X-ray source with a power of 36 W and a spot size of 400 μm was used to collect spectra at background pressure of ~2×10⁻⁹ torr. A wide survey scan in the range 0–1,350 eV was taken initially, at a pass energy of 200 eV and step size of 1 eV, to determine various elements in the composites. High-resolution narrow scans of 25–40 eV width for Au4f, Ag3d, C1s, and O1s were collected at a pass energy of 50 eV and step size of 0.1 eV. A charge shift of 0.6 eV was applied to the collected data based on the C1s peak at 284.5 eV obtained for adventitious carbon grown on a glass slide. Finally, the obtained spectra were analyzed using Shirley background subtraction, as well as Powell and Simplex minimization algorithms, using Avantage Data System software (version 5.38; Thermo Fisher Scientific Inc.).
Reagents and solutions
All of the reagents used for the experiments were of analytical grade or better. Pure S-captopril powder was purchased from the Tokyo Chemical Industry Co, Ltd (Tokyo, Japan). A stock solution of 5×10⁻³ M S-captopril was prepared in PBS pH 6 buffer and subsequently used for the preparation of lower concentration solutions (down to 5×10⁻⁶ M).
Results and discussion
Morphological, structural, and chemical investigation of Gr-AuAg-1 and Gr-AuAg-1.5 composites
The surface morphology of the graphene-AuAg composite samples was examined by TEM/high-resolution transmission electron microscopy (HRTEM). Figure 1A and 1B show the TEM micrographs of the Gr-AuAg-1 and Gr-AuAg-1.5, respectively. In both cases, one can see metal nanoparticles (black points, marked with white arrows) attached to the graphene sheets. As expected, a higher number of nanoparticles can be observed in the case of the Gr-AuAg-1.5 sample, due to the higher concentration of metals used within the mixed catalyst (1.5 wt% Au and 1.5 wt% Ag). For the Gr-AuAg-1 sample, the size of the nanoparticles varied between 5 and 50 nm, with the majority of nanoparticles being below 14 nm, as indicated by the histogram in Figure 1C. In contrast, for the Gr-AuAg-1.5 sample, the size of the nanoparticles varied between 5 and 100 nm, with the majority having a size of around 18 nm. The larger size can be attributed to the higher concentration of Au and Ag used within the catalytic system (1.5 wt%), which led to the agglomeration of small Au/Ag nanoparticles. These histograms were obtained after counting over 100 nanoparticles in the TEM/HRTEM micrographs, obtained from various samples.
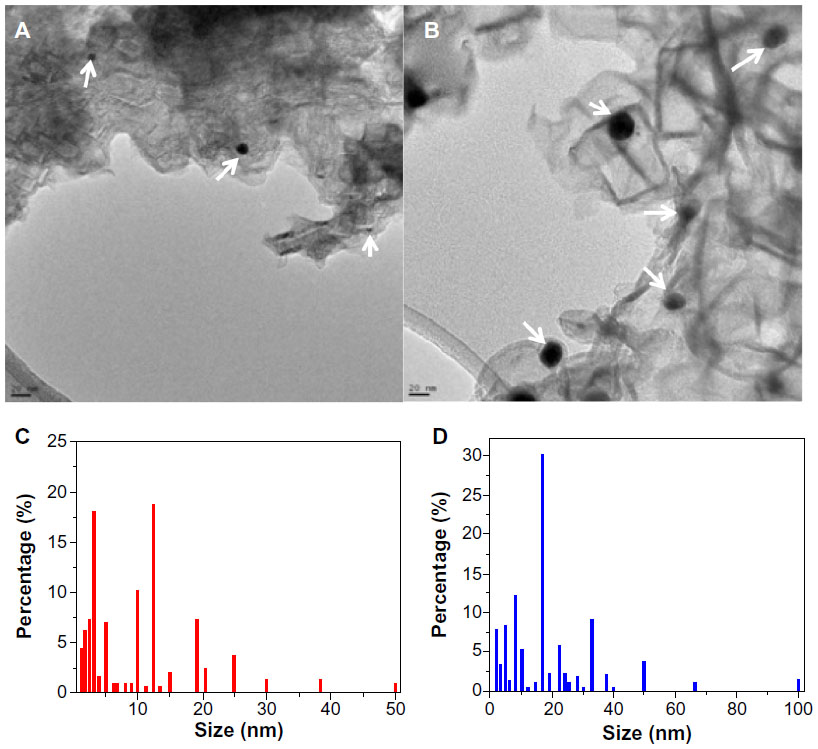 | Figure 1 Transmission electron microscopy (TEM) images of: (A) graphene-gold (1.0 wt%)-silver (1.0 wt%) (Gr-AuAg-1) composite and (B) graphene-gold (1.5 wt%)-silver (1.5 wt%) (Gr-AuAg-1.5) composite. (C) Particle size distribution for Gr-AuAg-1 composite and (D) Gr-AuAg-1.5 composite. |
Since many nanoparticles can generally be seen in the close vicinity of the graphene edges (see the HRTEM images in Figure 2A and B for Gr-AuAg-1 and Figure 2C for Gr-AuAg-1.5), it can be concluded that they represent the catalytic active centers for graphene formation. In the first step, a single layer of graphene was formed around a nanoparticle, which was then quickly transferred to the oxide support surface (MgO), allowing for the formation of new layers and finally large graphene sheets. The graphene nanoplatelets observed in these composite materials generally had regular shapes (square or rectangular), with dimensions ranging from tens to hundreds of nanometers. The presence of curls and wrinkles on the graphene platelets led to the increase in their total surface area, which is highly beneficial for a graphene-modified electrode. In the case of the Gr-AuAg-1.5 composite (HRTEM image, Figure 2D), one can see individual graphene rectangles with bent edges partially superimposed on one another. The majority of graphene sheets have multiple layers (between eight and ten), but flakes with 14–16 layers have also been observed. Our advanced TEM analysis did not show the presence of other graphitic structures, such as nanotubes.
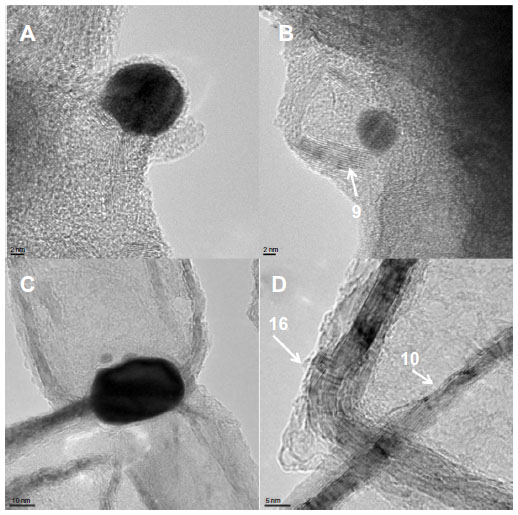 | Figure 2 High-resolution transmission electron microscopy (HRTEM) images of (A and B) the graphene-gold (1.0 wt%)-silver (1.0 wt%) (Gr-AuAg-1) composite and (C) graphene-gold (1.5 wt%)-silver 1.5 wt% (Gr-AuAg-1.5) composite showing metal nanoparticles located at the edge of the graphene sheet; (D) HRTEM image of the Gr-AuAg-1.5 composite showing the number of layers within graphene sheets. |
STEM characterization of the Gr-AuAg-1 and Gr-AuAg-1.5 composite samples gave us valuable information about the exact composition of the nanoparticles (pure metal or bimetal) attached to the graphene sheets. In both cases, the XEDS mapping revealed that the nanoparticles had a bimetallic composition (more than 50 nanoparticles were investigated). A representative STEM image is provided for sample Gr-AuAg-1 (Figure 3). Figure 3A presents the HRTEM image of two nanoparticles, between the size of 5 and 10 nm, while Figure 3B shows the corresponding high-angle annular dark-field image. The elemental mapping (inset of Figure 3B) demonstrates that the bright particles in the high-angle annular dark-field image are bimetallic, being composed of Ag and Au. The XEDS spectrum of this sample, shown in Figure 3C, additionally indicates the presence of Au and Ag. The elemental analysis proved that the amount of Au within these nanoparticles was about four times higher than that of Ag (2.3 wt% Au versus 0.5 wt% Ag, inset of Figure 3C). The bimetallic composition may be explained by the strong tendency of Au nanoparticles to migrate and agglomerate on the catalyst’s surface, at temperatures as high as those used for graphene synthesis (1,000°C).25 During migration, they can easily encounter Ag nanoparticles, leading to the formation of bimetallic AuAg nanoparticles. Although the encapsulation of AuAg nanoparticles by graphene layers may slow this process, the analysis of various samples proved that, in all cases, the nanoparticles were bimetallic. However, the presence of pure Au or Ag nanoparticles in these composite materials cannot be excluded. The XEDS spectrum also revealed the existence of other elements including carbon, oxygen, and copper (from the copper grid).
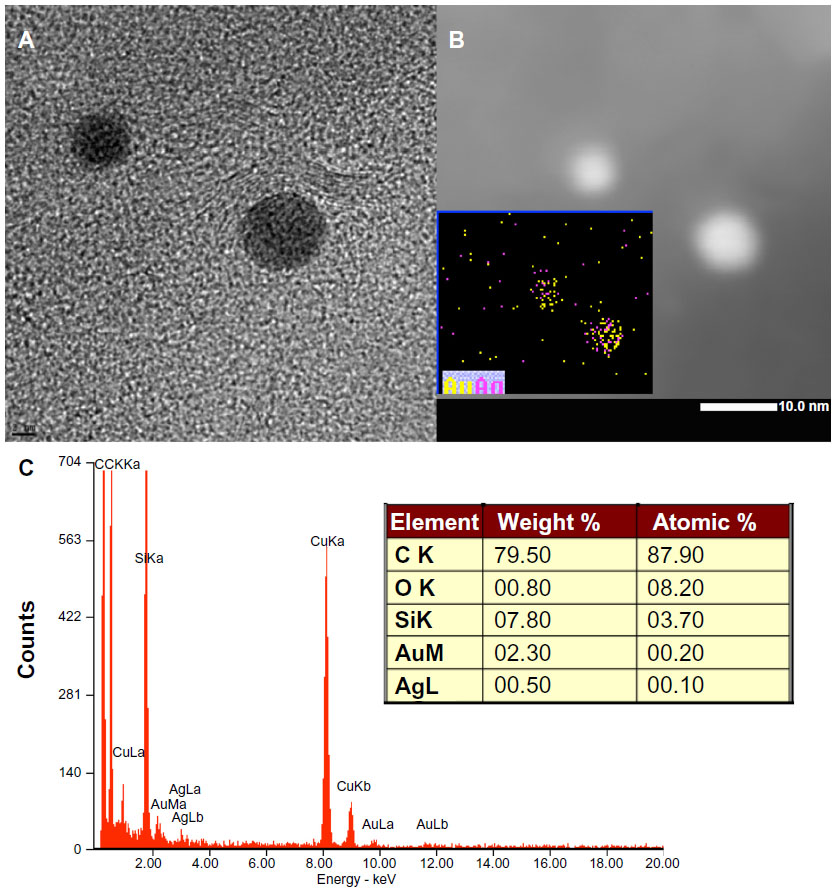 | Figure 3 (A) High-resolution transmission electron microscopy image of two metal nanoparticles in the graphene-gold (1.0 wt%)-silver (1.0 wt%) (Gr-AuAg-1) composite. (B) Scanning transmission electron microscopy image and elemental characterization of the Gr-Au-Ag-1 composite sample: high-angle annular dark-field characterization of the metal nanoparticles in the Gr-AuAg-1 composite; (inset) elemental mapping of the nanoparticles, which indicates that they have bimetallic (AuAg) composition. (C) X-ray energy-dispersive spectroscopy characterization of the Gr-AuAg-1 composite, which clearly shows the presence of gold and silver. |
STEM characterization of the Gr-AuAg-1.5 sample was performed to confirm that the nanoparticles within the composite material also had a bimetallic character. The high-angle annular dark-field image (Figure 4A) shows nanoparticles of various sizes attached to the graphene sheets. A high-magnification image of a group of five nanoparticles is provided in Figure 4B, along with the elemental mapping, which confirmed that the particles had a bimetallic composition (inset of Figure 4B). The corresponding XEDS spectrum is shown in Figure 4C, indicating the presence of Au and Ag. Quantitative information about the amounts of Au and Ag metals within these nanoparticles is shown in the elemental analysis (inset of Figure 4C). As in the case of Gr-Au-Ag-1 sample, there was more Au than Ag within these bimetallic nanoparticles (11.1 wt% Au versus 4.5 wt% Ag).
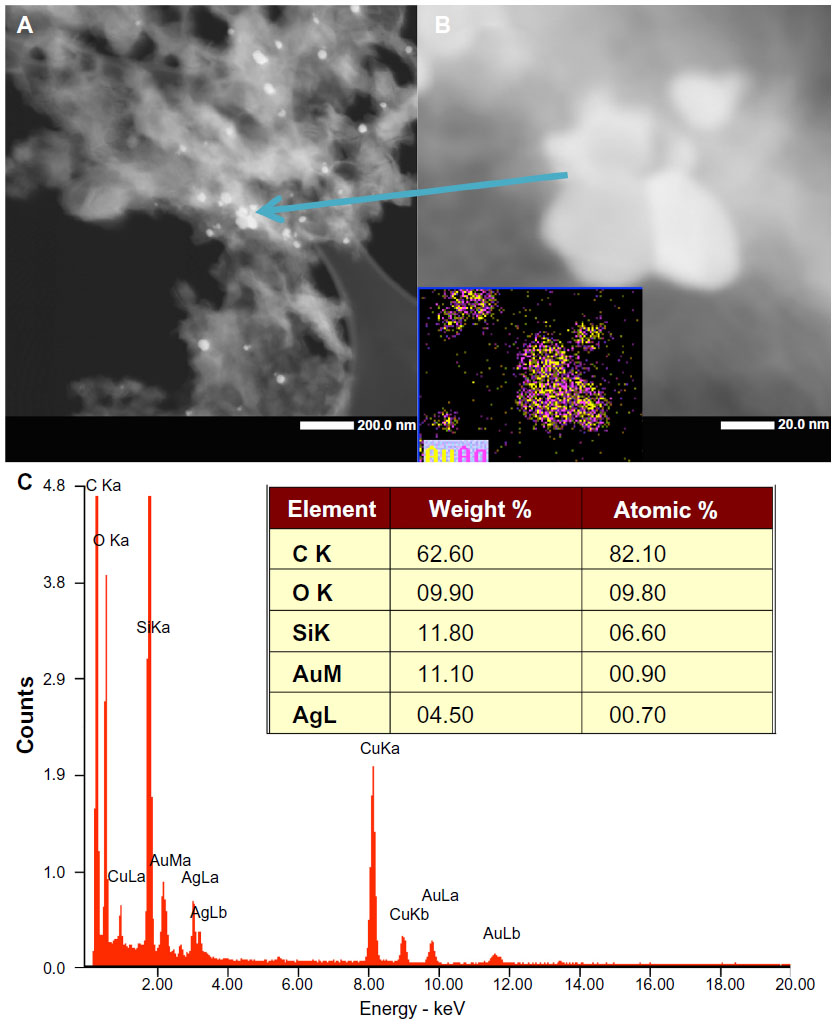 | Figure 4 (A and B) Scanning transmission electron microscopy image and elemental characterization of the graphene-gold (1.5 wt%)-silver (1.5 wt%) (Gr-Au-Ag-1.5) composite sample: high-angle annular dark-field characterization of the Gr-Au-Ag-1.5 sample; (inset B) elemental mapping of the nanoparticles, which indicates that they have bimetallic (AuAg) composition. (C) X-ray energy-dispersive spectroscopy characterization of the Gr-AuAg-1.5 composite, which clearly shows the presence of gold and silver. |
Although there were many similarities in the morphological characteristics of the two composite materials, their thermal stability and crystalline structure were strongly influenced by the amount of metallic/bimetallic nanoparticles attached to the graphitic sheets. This was clearly evidenced by TGA and X-ray powder diffraction studies. TGA was employed to reveal information about the thermal behavior and stability of graphene samples synthesized over the Au-Ag [1 wt%]/MgO and the Au-Ag [1.5 wt%]/MgO catalysts, respectively. Figure 5A shows the TGA curves for the synthesized samples after purification, while the corresponding differential thermal analysis curves are presented in Figure 5B. For the Gr-AuAg-1 sample, the value of the reaction yield (ηs) was determined to be 30.3%, and the final purity was 95.93% (the ηs value was assessed as the mass that decomposed thermally as a percentage of the total mass, relative to the mass of the catalytic system used in the reaction). In contrast, the Gr-AuAg-1.5 sample had a lower purity (91.55%) – due to the higher concentration of nanoparticles embedded within the graphene sheets – as well as a lower reaction yield of about 20.5%. One mass-loss profile (around 640°C) was recorded for both composite samples, which indicated the presence of only one type of graphitic structure.
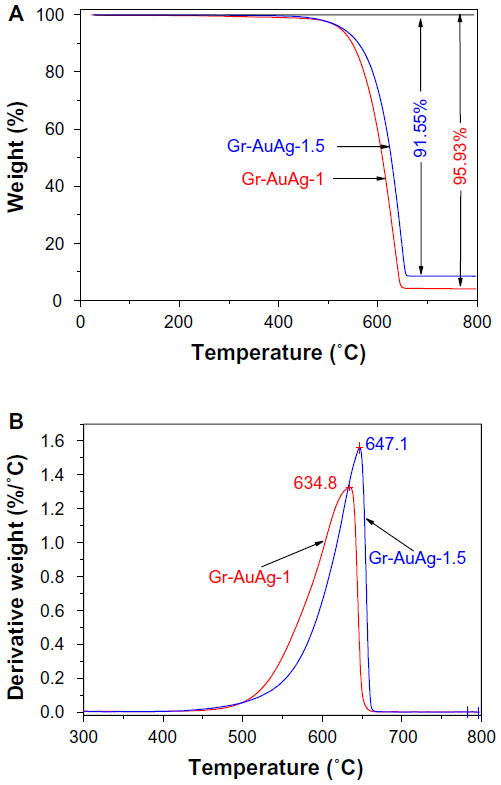 | Figure 5 (A) Thermogravimetric curves for the purified graphene-gold (1.0 wt%)-silver (1.0 wt%) (Gr-AuAg-1; red line) and graphene-gold (1.5 wt%)-silver (1.5 wt%) (Gr-AuAg-1.5; blue line) samples and (B) the corresponding differental thermal analysis of composite samples. |
Next, the position of the peak in the corresponding differential thermal analysis curves, which represents the decomposition temperature of graphene structures (Figure 5B), was considered. This value is strongly dependent on the dimensions and crystallinity of graphene sheets.26,27 As can be seen in this figure, the Gr-AuAg-1 sample had a lower decomposition temperature (634.8°C) than Gr-AuAg-1.5 (647.1°C). This clearly indicates a higher degree of crystallinity for the Gr-AuAg-1.5 composite, which is in excellent agreement with the results obtained by X-ray powder diffraction.
Figure 6 shows the X-ray diffraction patterns of the two composite materials, exhibiting both the diffraction lines of graphene and the metal nanoparticles attached to it (Miller indices are shown in the figure). According to an earlier study,28 the peaks at around 25.0° (0 0 2) and 43.2° (1 0 0) correspond to the diffraction lines of graphene structures. Moreover, the position of the (0 0 2) peak can be used to determine the distance between the stacked graphitic layers (d-spacing). In the case of our composite materials, this value was 0.350 nm for Gr-AuAg-1 and 0.346 nm for the Gr-AuAg-1.5 sample, which is in excellent agreement with the values obtained from the edge-plane analysis in several HRTEM images.
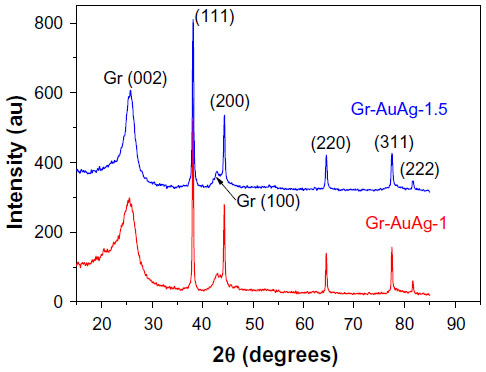 | Figure 6 X-ray diffraction pattern of graphene-gold (1.0 wt%)-silver (1.0 wt%) (Gr-AuAg-1; red line) and graphene-gold (1.5 wt%)-silver (1.5 wt%) (Gr-AuAg-1.5; blue line) composite. |
To compare the crystallinity of the two materials, the mean value of the graphene crystalline domain perpendicular to the (0 0 2) crystallographic plane was calculated using the Scherrer equation.29 This value was approximately 2.44 nm for the Gr-AuAg-1 composite. By taking into consideration that the distance between the stacked graphene layers was around 0.35 nm, the number of graphitic layers within the crystalline domain was easily determined to be around six. In the case of the Gr-AuAg-1.5 composite, the size of the crystalline domain was almost double (4.08 nm) that of the Gr-AuAg-1 composite and corresponded to about eleven graphitic layers. This finding is in excellent agreement with previous results,30 which demonstrated, for the first time, that by increasing the amount of Au nanoparticles in the catalytic system (Aux/MgO) from x=1 to 3 wt%, the degree of crystallinity of graphene sheets considerably increased. The sample prepared with the catalyst having 3 wt% Au exhibited the highest degree of crystallinity.
The chemical status of Au and Ag nanoparticles in the graphene composites was studied using narrow-scan X-ray photoelectron spectroscopy, as shown in Figure 7. Au nanoparticles retained their metallic state, as revealed by doublet peaks at 83.5 eV and 87.24 eV for Gr-AuAg-1, and 84.42 eV and 88.08 eV for Gr-AuAg-1.5, respectively. There was no sign of oxidation for the Au nanoparticles, as the curve fitting showed no deformation of the doublet peaks.
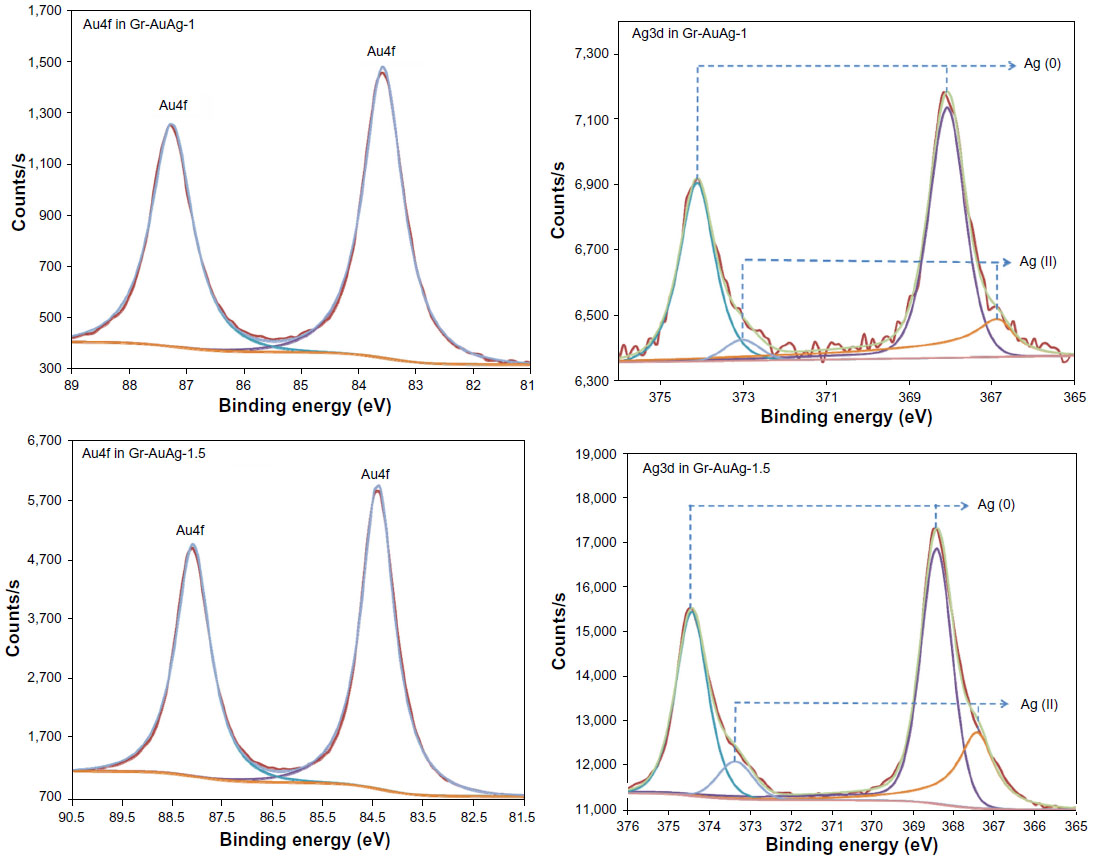 | Figure 7 X-ray photoelectron spectroscopy spectra of gold 4f and silver 3d within the two composite samples, graphene-gold (1.0 wt%)-silver (1.0 wt%) (Gr-AuAg-1) and graphene-gold (1.5 wt%)-silver (1.5 wt%) (Gr-AuAg-1.5). |
In contrast, Ag3d doublet peaks for Ag nanoparticles showed a slight deformation, indicating oxidation of Ag nanoparticles, in both composites. As shown in Figure 7 of the Ag3d scan for Gr-AuAg-1, the main peaks at 368.1 eV and 374.1 eV suggest metallic states of Ag nanoparticles. However, peak fitting revealed deconvolution of peaks at higher binding energy, showing two more prominent peaks at 366.87 eV and 377.02 eV. These peaks can be attributed to a higher oxidation state Ag (II). A similar trend was observed for the Ag3d peaks of the Gr-AuAg-1.5 composite, although, in this case, the deconvolution of peaks at higher binding energy was more significant than for Gr-AuAg-1. The percentage of oxidation for the Ag nanoparticles can be determined by assessing the area under the corresponding peaks, collected within the XPS collection depth for each sample. It was found that, for the Gr-AuAg-1 composite, only 20.41% of the Ag was oxidized, while for the Gr-AuAg-1.5 composite, 25.04% of the Ag was found to be oxidized. The results indicate that the majority of Ag nanoparticles in both composites retained their metallic state and hence are embedded properly in the graphene structure.
The marked differences we observed between the two composite samples (Gr-AuAg-1 and Gr-AuAg-1.5) were reflected in the electro-catalytic properties of these materials, which will be discussed next.
Electrochemical oxidation of captopril using electrodes modified with graphene-AuAg composites (Au/Gr-AuAg-1 and Au/Gr-AuAg-1.5)
Captopril is a dibasic acid, having two dissociation constants: pka1 =3.7 (carboxyl group) and pka2 =9.8 (thiol group). Both the carboxyl and thiol groups can be electrochemically oxidized. The electrochemical behavior of captopril was investigated with an Au/Gr-AuAg-1.5-modified electrode, in solutions with varying pH between 3.6 and 8, using DPV (Figures 8 and 9). In acidic solutions (pH 3.6 and 4.2), one can see two peaks, due to the oxidation of carboxylic group (+0.65 V vs Ag/AgCl) and thiol group (+0.85 V vs Ag/AgCl). In solutions of higher pH (pH 5 and 6), the signal of the first oxidation peak strongly decreased, due to the deprotonation of the carboxylic group. In fact, in a solution of pH 6, only one peak remained, with its maximum at around +0.78 V versus Ag/AgCl, which can be attributed to the oxidation of the thiol group. Next, in neutral and slightly basic solutions (pH 7 and 8, respectively) the oxidation signal from the thiol group considerably decreased due to the deprotonation of the thiol group. Based on these experimental results, pH 6 was chosen as the optimum pH for studying the oxidation of captopril with graphene-modified electrodes. With this solution, the anodic current generated during captopril oxidation can be attributed to the dimerization of captopril molecules (Figure 10).31
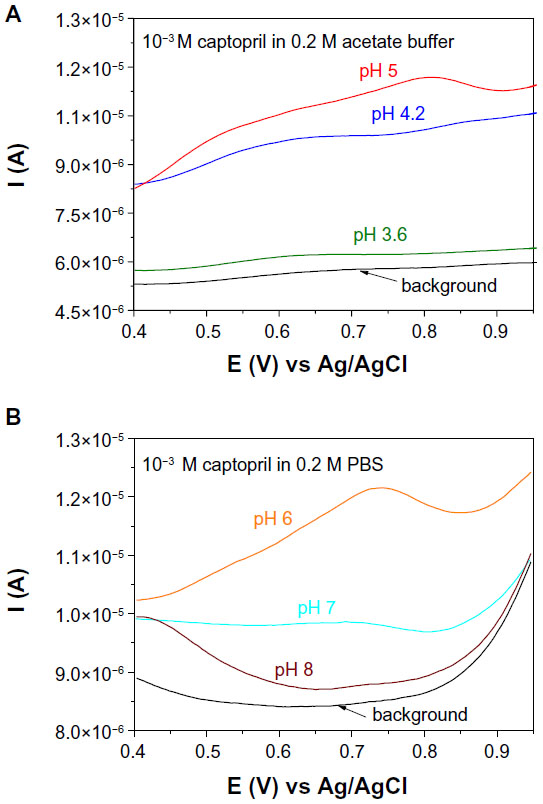 | Figure 8 Differential pulse voltammograms recorded with an electrode modified with graphene-gold (1.5 wt%)-silver (1.5 wt%) (Gr-AuAg-1.5) composite either in (A) acetate buffer solutions of pH 3.6 (olive line), pH 4.2 (blue), pH 5 (red) and 10−3 M captopril or (B) phosphate-buffered saline (PBS) solutions of pH 6 (orange), pH 7 (cyan), pH 8 (wine) and 10−3 M captopril. |
 | Figure 9 The electro-catalytic effect of a gold electrode modified with graphene-silver and gold (Au/Gr-AuAg-1.5) nanocomposites for the electrochemical detection of S-captopril. |
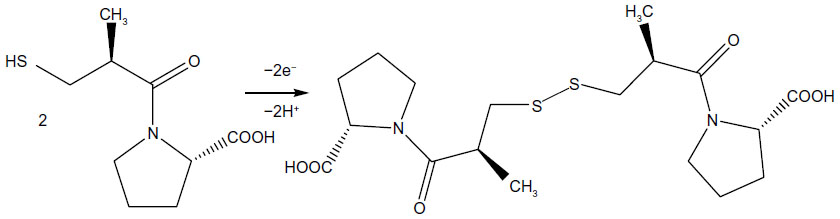 | Figure 10 Electrochemical oxidation of captopril in pH 6 solution. |
To examine the electro-catalytic activity of the Au/Gr-AuAg-1 and Au/Gr-AuAg-1.5-modified electrodes, we tested them by DPV. Figure 11 displays the DPVs recorded with each modified electrode, as well as with bare Au, in solution containing 10−4 M captopril (in 0.2 M PBS pH 6; scan rate 50 mV · s−1). The Au/Gr-AuAg-1.5 electrode displays a clear oxidation peak at around +0.8 V versus Ag/AgCl. In the case of bare Au and the Au/Gr-AuAg-1 electrode, no oxidation peak is visible. Moreover, one can see that the capacitive current of the Au/Gr-AuAg-1 electrode was around 6.7×10⁻⁶ A, four times greater than that of the Au/Gr-AuAg-1.5 electrode (1.6×10⁻⁶ A).
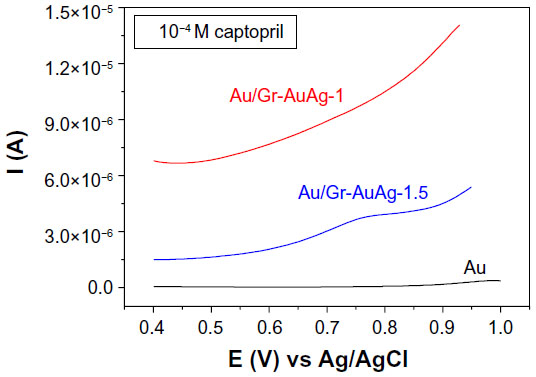 | Figure 11 Differential pulse voltammograms recorded with bare gold (Au; black line) and with electrodes modified with graphene-gold (1.0 wt%)-silver (1.0 wt%) (Gr-AuAg-1; red) or graphene-gold (1.5 wt%)-silver (1.5 wt%) (Gr-AuAg-1.5; blue) composite, in solution containing 10−4 M captopril, in phosphate-buffered saline of pH 6. |
Thus, the composite material prepared with a higher concentration of Au and Ag (Gr-AuAg-1.5) greatly facilitated the direct transfer of electrons between captopril and the electrode surface. This is in contrast with many previously published papers, which have generally reported the employment of a redox mediator either in solution11 or adsorbed on the electrode surface14 in order to enhance the oxidation of captopril molecules.
By comparing the differential pulse voltammograms recorded with the two modified electrodes (from Figure 12A and B) at various concentrations of captopril, one can see that, for the Au/Gr-AuAg-1.5 electrode, the peak current was well-defined, even at a relatively low concentration (10−5 M). In contrast, the signals recorded with the Au/Gr-AuAg-1 electrode were poorly defined within the 5×10⁻⁶ to 5×10⁻³ M concentration range, and many of them overlapped with the background signal.
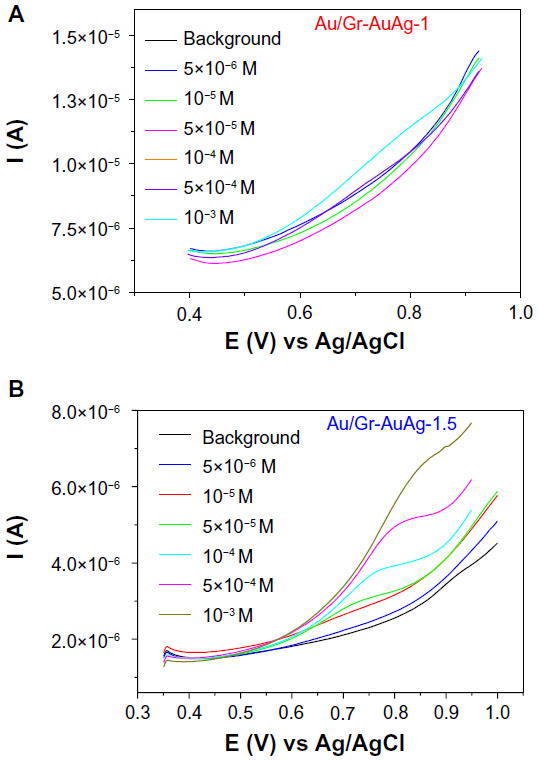 | Figure 12 Differential pulse voltammograms recorded with electrodes modified with (A) graphene-gold (1.0 wt%)-silver (1.0 wt%) (Gr-AuAg-1) or (B) graphene-gold (1.5 wt%)-silver (1.5 wt%) (Gr-AuAg-1.5) composite, in phosphate-buffered saline of pH 6 containing various concentrations of captopril (5×10⁻⁶ to 5×10⁻³ M). |
Based on the data obtained from various differential pulse voltammograms in which the concentration of captopril was varied from 0 to 10−2 M, a linear regression statistical analysis of peak current (Ipeak) versus concentration (C) was obtained (Figure 13). In Figure 13, one can see two linear ranges, one from 0 to 5×10⁻⁵ M and the other from 5×10⁻⁵ to 10−2 M (due to the coverage of the electrode surface with oxidation products, which diminishes the active area). The detection limit (signal–noise ratio of three) corresponding to the first linear range was found to be 6×10⁻⁶ M. This detection limit is a little higher than that recently reported by Sattarahmady et al14 (0.331 μM). However, in our case, the main advantage was the absence of the redox mediator, generally employed to favor the transfer of electrons between captopril molecules and the electrode surface.12−14
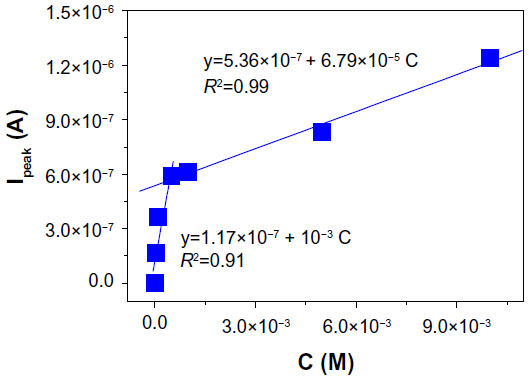 | Figure 13 Calibration plot (Ipeak vs captopril concentration) obtained with the gold/graphene-gold (1.5 wt%)-silver (1.5 wt%) (Gr-AuAg-1.5) electrode. |
Based on the preliminary experimental results, it can be hypothesized that the electro-catalytic properties of the synthesized composites could be influenced by the degree of crystallinity of the graphene. Additional work will be required to prove this. Moreover, it is important to note that our composite material, Gr-AuAg-1.5, exhibited a larger proportion of edge-plane sites, in comparison with single-sheet graphene. Güell et al32 have recently reported that single-sheet graphene has lower electrochemical activity than multi-layer graphene. If the number of layers is greater than seven, the heterogeneous electron-transfer kinetics is greatly improved, and the electron-transfer process becomes nearly reversible. Therefore, the outstanding ability of the Gr-AuAg-1.5 composite to directly transfer the electrons from captopril molecules to the electrode surface may be due to the multi-layer morphology: around eleven layers, arranged in a highly crystalline structure. Due to its high crystallinity, the Gr-AuAg-1.5 sample exhibited performance superior to that of the Gr-AuAg-1 composite in the electro-analysis of captopril.
In addition, we suggest that there are two other favorable factors that enhance the transfer of electrons: 1) the Gr-AuAg-1.5 composite had a larger surface area (247 m2 · g−1) than the Gr-AuAg-1 composite (144 m2 · g−1), as proved by BET analysis; 2) the Gr-AuAg-1.5 composite had an increased amount of bimetallic nanoparticles attached to graphene sheets (as proved by TGA analysis), and consequently an increased number of edge-plane-type defects. These defects generally have a higher density of states, and are the dominant electro-active sites for the oxidation of various organic molecules (adenine, guanine), as has been recently reported by Gonçalves et al33 and Li et al.34
These results are complementary to those recently published by this group,16 which demonstrated that graphene sheets prepared over two different catalytic systems (Aux/MgO or Agx/MgO) and having the same amount of metal loaded in the system (x=3 wt%) exhibited a very similar degree of crystallinity. The electrodes modified with the two composite materials had the same electro-catalytic effect toward carbamazepine oxidation. The type of metal (Ag or Au) was found to have very little effect on the electrochemical characteristics of the modified electrode.
The reproducibility and stability of the Au/Gr-AuAg-1.5-modified electrodes were investigated by measuring their responses in 0.2 M PBS pH 6 solution containing 10−4 M captopril. The relative standard deviation of the oxidation peak current by five successive measurements was determined to be 3%. In addition, the fabrication reproducibility was estimated by modifying five electrodes with the composite material under the same conditions, and, in this case, the relative standard deviation was 3.5%. The modified electrodes were then kept at room temperature for 2 weeks, and the recorded peak currents were at about 98.5% of their initial values. These results revealed the good stability and reproducibility of Au/Gr-AuAg-1.5-modified electrodes.
In addition, the oxidation of captopril was studied by EIS, using two Au electrodes modified with 20 μL of each composite material (Figure 14A–C). The electrochemical transformations occurring at the electrode–electrolyte interface were modeled based on an equivalent electrical circuit.35,36 Such a circuit generally includes the following: the Warburg impedance Zwt – characteristics for the diffusion of ions from the bulk electrolyte to the electrode interface; the charge-transfer resistance Rct – which reflects the ability of the interface to transfer the electrons; the double-layer capacitance Cdl – due to the charging/discharging of the double layer; and Rs – the ohmic resistance of the electrolyte (Figure 14A). The dielectric and insulating properties of the interface are reflected by both Cdl and Rct, while Rs and Zwt are characteristic of the bulk properties of the electrolyte solution. In the case of a rough surface (like that of a modified electrode), the double-layer capacitance Cdl is generally replaced by a CPE.37
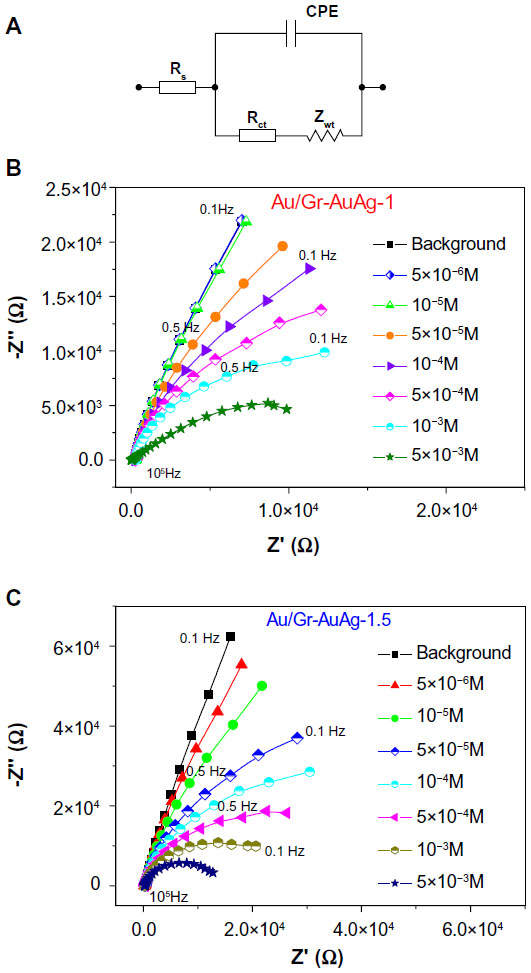 | Figure 14 (A) Equivalent electrical circuit used to fit the experimental results. Nyquist plots obtained with the (B) Au/graphene-gold (1.0 wt%)-silver (1.0 wt%) (Gr-AuAg-1) and (C) Au/graphene-gold (1.5 wt%)-silver (1.5 wt%) (Gr-AuAg-1.5) electrodes (each modified with 20 μL of composite material) in solutions of phosphate-buffered saline at pH 6 containing various concentrations of captopril (5×10⁻⁶ to 5×10⁻³ M) at an applied potential of +0.85 V versus Ag/AgCl. |
Experimental EIS data can be represented either as a Nyquist plot or a Bode plot.38 A Nyquist plot typically includes a small semicircle at high frequencies (characteristic of the electron transfer-limited process) and a straight line at low frequencies (characteristic of the diffusion-limited process). The diameter of the high-frequency semicircle is equal to the charge-transfer resistance (Rct), and, in the case of a material that exhibits fast heterogeneous electron-transfer kinetics, its value is around hundreds of Ohm. In contrast, for a material that has a slow transfer of electrons, the Nyquist plot includes only the large semicircle, without the straight line.
Figure 14B and C present the Nyquist plot for the Au/Gr-AuAg-1 and Au/Gr-AuAg-1.5 electrodes, respectively, both recorded at various concentrations of captopril (5×10⁻⁶ to 5×10⁻³ M, in 0.2 M PBS pH 6 solution) and at an applied potential of +0.85 V versus Ag/AgCl. It can be observed that the curves recorded with the two modified electrodes are different. The Au/Gr-AuAg-1 electrode is less sensitive, and, therefore, the signal recorded at low concentrations of captopril (5×10⁻⁶ to 10−5 M) overlaps with that recorded for the background (pure PBS pH 6 solution). In contrast, the signal recorded for the Au/Gr-AuAg-1.5 electrode strongly varies with an increase in the captopril concentration (5×10⁻⁶ to 5×10⁻³ M). In both cases, the accumulation in time of oxidation products at the electrode surface hinders the transfer of electrons and leads to a large Rct (around 104 Ohm).
Conclusion
In this work, for the first time as far as we are aware, two composite materials based on graphene and bimetallic AuAg nanoparticles were used for the electrochemical investigation of S-captopril oxidation. A well-defined oxidation signal was obtained, with the composite having a higher amount of Au and Ag embedded within graphene layers (Gr-AuAg-1.5 sample). In contrast, the oxidation signal recorded for the Gr-AuAg-1 sample was very broad and poorly defined. The different electro-catalytic properties of the two materials can be attributed to the differences in their crystalline structures. X-ray powder diffraction studies showed that the mean value of graphene crystalline domain perpendicular to the (0 0 2) crystallographic plane was 4.08 nm for the Gr-AuAg-1.5 sample and corresponded to about eleven layers. This value was twice that corresponding to the Gr-AuAg-1 sample (2.44 nm), which consisted of about six layers.
Acknowledgments
This work was supported by a grant from the Romanian National Authority for Scientific Research, CNCS-UEFISCDI, Project Number PN-II-ID-PCE-2011-3-0125. The editorial assistance of Dr Marinelle Ringer is gratefully acknowledged.
Disclosure
The authors declare no conflicts of interest in this work.
References
Du M, Yang T, Jiao K. Immobilization-free direct electrochemical detection for DNA specific sequences based on electrochemically converted gold nanoparticles/graphene composite film. J Mater Chem. 2010;20:9253–9260. | |
Randviir EP, Banks CE. Electrochemical measurement of the DNA bases adenine and guanine at surfactant-free graphene modified electrodes. RSC Adv. 2012;2:5800–5805. | |
Coros M, Biris AR, Pogacean F, et al. Influence of chemical oxidation upon the electro-catalytic properties of graphene–gold nanoparticle composite. Electrochim Acta. 2013;91:137–143. | |
Li J, Guo S, Zhai Y, Wang E. High-sensitivity determination of lead and cadmium based on the Nafion-graphene composite film. Anal Chim Acta. 2009;649(2):196–201. | |
Li J, Guo S, Zhai Y, Wang E. Nafion–graphene nanocomposite film as enhanced sensing platform for ultrasensitive determination of cadmium. Electrochem Commun. 2009;11(5):1085–1088. | |
Akhavan O, Ghaderi E, Rahighi R. Toward single-DNA electrochemical biosensing by graphene nanowalls. ACS Nano. 2012;6(4):2904–2916. | |
Shan C, Yang H, Song J, Han D, Ivaska A, Niu L. Direct electrochemistry of glucose oxidase and biosensing for glucose based on graphene. Anal Chem. 2009;81(6):2378–2382. | |
Kang X, Wang J, Wu H, Aksay AI, Liu J, Lin Y. Glucose oxidase–graphene–chitosan modified electrode for direct electrochemistry and glucose sensing. Biosens Bioelectron. 2009;25(4):901–905. | |
Stefan RI, van Staden JK, Aboul-Enein HY. Amperometric biosensors/sequential injection analysis system for simultaneous determination of S- and R-captopril. Biosens Bioelectron. 2000;15(1–2):1–5. | |
Stefan RI, Bala C, Aboul-Enein HY. Biosensor for the enantioselective analysis of S-captopril. Sens. Actuators B Chem. 2003;92:228–231. | |
Rezaei B, Damiri S. Voltammetric behavior of multi-walled carbon nanotubes modified electrode-hexacyanoferrate(II) electrocatalyst system as a sensor for determination of captopril. Sens Actuators B Chem. 2008;134(1):324–331. | |
Bahramipur H, Jalali F. Voltammetric determination of captopril using chlorpromazine as a homogeneous mediator. International Journal of Electrochemistry. 2011;2011:Article ID 864358. | |
Ensafi AA, Monsef M, Rezaei B, Karimi-Maleh H. Electrocatalytic oxidation of captopril on a vinylferrocene modified carbon nanotubes paste electrode. Anal Methods. 2012;4:1332–1338. | |
Sattarahmady N, Heli H, Moradi SE. Cobalt hexacyanoferrate/graphene nanocomposite – application for the electrocatalytic oxidation and amperometric determination of captopril. Sens Actuators B Chem. 2013;177:1098–1106. | |
Biris AR, Ardelean S, Lazar MD, et al. Synthesis of few-layer graphene over gold nanoclusters supported on MgO. Carbon. 2012;50(6):2252–2263. | |
Pruneanu S, Pogacean F, Biris AR, et al. Electro-catalytic properties of graphene composites containing gold or silver nanoparticles. Electrochim Acta. 2013;89:246–252. | |
Guo S, Dong S, Wang E. Raspberry-like hierarchical Au/Pt nanoparticle assembling hollow spheres with nanochannels: an advanced nanoelectrocatalyst for the oxygen reduction reaction. J Phys Chem C. 2009;113:5485. | |
Wang S, Kristian N, Jiang S, Wang X. Controlled synthesis of dendritic Au@Pt core-shell nanomaterials for use as an effective fuel cell electrocatalyst. Nanotechnology. 2009;20(2):025605. | |
Wang SY, Kristian N, Jiang SP, Wang X. Controlled deposition of Pt on Au nanorods and their catalytic activity towards formic acid oxidation. Electrochem Commun. 2008;10(7):961–964. | |
Wan Q, Liu Y, Wang Z, et al. Graphene nanoplatelets supported metal nanoparticles for electrochemical oxidation of hydrazine. Electrochem Commun. 2013;29:29–32. | |
Hu Y, Zhang H, Wu P, Zhang H, Zhou B, Cai C. Bimetallic Pt–Au nanocatalysts electrochemically deposited on graphene and their electrocatalytic characteristics towards oxygen reduction and methanol oxidation. Phys Chem Chem Phys. 2011;13:4083–4094. | |
Pruneanu S, Biris AR, Pogacean F, et al. Novel multifunctional graphene sheets with encased Au/Ag nanoparticles for advanced electrochemical analysis of organic compounds. Chem Phys Chem. 2012;13(16):3632–3639. | |
Lazar MD, Biris AR, Borodi G, et al. Magnesia supported Au and Ag catalysts for the preparation of few-layer graphene–metal nanocomposites: relationship between catalyst structure and the properties of graphene composites. J Mater Sci. 2013;48(21):7409–7421. | |
Metin O, Kayhan E, Özkar S, Schneider JJ. Palladium nanoparticles supported on chemically derived graphene: an efficient and reusable catalyst for the dehydrogenation of ammonia borane. Int J Hydrogen Energy. 2012;37(10):8161–8169. | |
Bond GC, Thompson DT. Catalysis by gold. Catalysis Reviews: Science and Engineering. 1999;41(3–4):319–388. | |
Moon JH, An KH, Lee YH, Park YS, Bae DJ, Park GH. High-yield purification process of singlewalled carbon nanotubes. J Phys Chem B. 2001;105(24):5677–5681. | |
Dillon AC, Gennett T, Jones KM, Alleman JL, Parilla PA, Heben MA. A simple and complete purification of single-walled carbon nanotube materials. J Adv Mater. 1999;11(16):1354–1358. | |
Huh SH, Ju HM, Choi SH. X-ray diffraction patterns of thermally-reduced graphenes. Journal of the Korean Physical Society. 2010;57:1649–1652. | |
Klug HP, Alexander LE. X-Ray Diffraction Procedures for Polycrystalline and Amorphous Materials. 2nd ed. New York, NY: Wiley; 1974. | |
Biris AR, Pruneanu S, Pogacean F, et al. Few-layer graphene sheets with embedded gold nanoparticles for electrochemical analysis of adenine. Int J Nanomedicine. 2013;8:1429–1438. | |
Ralph TR, Hitchman ML, Millington JP, Walsh FC. The electrochemistry of L-cystine and L-cysteine: Part 1: Thermodynamic and kinetic-studies. J Electroanal Chem. 1994;375(1–2):1–15. | |
Güell AG, Ebejer N, Snowden ME, Macpherson JV, Unwin PR. Structural correlations in heterogeneous electron transfer at monolayer and multilayer graphene electrodes. J Am Chem Soc. 2012;134(17):7258–7261. | |
Gonçalves LM, Batchelor-McAuley C, Barros AA, Compton RG. Electrochemical oxidation of adenine: a mixed adsorption and diffusion response on an edge-plane pyrolytic graphite electrode. J Phys Chemistry C. 2010;114(33):14213–14219. | |
Li Q, Batchelor-McAuley C, Compton RG. Electrochemical oxidation of guanine: electrode reaction mechanism and tailoring carbon electrode surfaces to switch between adsorptive and diffusional responses. J Phys Chem B. 2010;114(21):7423–7428. | |
Randles JE. Kinetics of rapid electrode reactions. Discuss Faraday Soc. 1947;1:11–19. | |
Ershler BV. Investigation of electrode reactions by the method of charging-curves and with the aid of alternating currents. Discuss Faraday Soc. 1947;1:269–277. | |
Lasia A. Electrochemical impedance spectroscopy and its applications. In: Conway BE, Bockris J, White RE, editors. Modern Aspects of Electrochemistry. New York, NY: Kluwer Academic/Plenum; 1999;32:143–248. | |
Pletcher D, Peter L, Peat R, Robinson J, Greef R. Instrumental Methods in Electrochemistry. Chichester: Ellis Horwood; 1985. |
 © 2014 The Author(s). This work is published and licensed by Dove Medical Press Limited. The
full terms of this license are available at https://www.dovepress.com/terms
and incorporate the Creative Commons Attribution
- Non Commercial (unported, 3.0) License.
By accessing the work you hereby accept the Terms. Non-commercial uses of the work are permitted
without any further permission from Dove Medical Press Limited, provided the work is properly
attributed. For permission for commercial use of this work, please see paragraphs 4.2 and 5 of our Terms.
© 2014 The Author(s). This work is published and licensed by Dove Medical Press Limited. The
full terms of this license are available at https://www.dovepress.com/terms
and incorporate the Creative Commons Attribution
- Non Commercial (unported, 3.0) License.
By accessing the work you hereby accept the Terms. Non-commercial uses of the work are permitted
without any further permission from Dove Medical Press Limited, provided the work is properly
attributed. For permission for commercial use of this work, please see paragraphs 4.2 and 5 of our Terms.