Back to Journals » International Journal of Nanomedicine » Volume 15
Differentiation Between Metronidazole Residues Disposal by Using Adsorption and Photodegradation Processes Onto MgO Nanoparticles
Authors El Bouraie M ![]() , Ibrahim S
, Ibrahim S
Received 6 June 2020
Accepted for publication 12 August 2020
Published 28 September 2020 Volume 2020:15 Pages 7117—7141
DOI https://doi.org/10.2147/IJN.S265739
Checked for plagiarism Yes
Review by Single anonymous peer review
Peer reviewer comments 3
Editor who approved publication: Dr Thomas Webster
Mohamed El Bouraie, Sabah Ibrahim
Central Laboratory for Environmental Quality Monitoring (CLEQM), National Water Research Center (NWRC), El Qanater El Khayria, Egypt
Correspondence: Mohamed El Bouraie
Central Laboratory for Environmental Quality Monitoring (CLEQM), National Water Research Center (NWRC), El Qanater El Khayria, Egypt
Tel +201221839311
Email [email protected]
Background: Metronidazole (MNZ) is an antibiotic form that is considered as a dangerous environmental pollutant due to its widespread use as growth promoters in livestock and aquaculture operations along with its therapeutic application for humans.
Purpose: The objective of this work was to conduct a comparative study between the efficiency of the adsorption and photocatalytic degradation of MNZ in an aqueous solution by using magnesium oxide nanoparticles (MgO NP) under different effects, as well as evaluate the performance, reusability and cost study.
Materials and Methods: Several instruments such as XRD, EDX, SEM, and TEM were used to characterize the chemical composition and morphological properties of the synthesized MgO NP, while the GC-MS analysis was used to monitor the degradation pathway of MNZ particles within 180 min. The simple photo-batch reactor was used to investigate the degradation of MNZ under the effect of UV radiation, initial concentration of MNZ, pH, catalyst loading, inorganic salts addition, time, and temperature.
Results: The degradation efficiency is mainly divided into two steps: 35.7% for maximum adsorption and 57.5% for photodegradation. Adsorption isotherm models confirmed that the process nature is chemisorption and appropriate Langmuir model, as well as to be a nonspontaneous and endothermic reaction according to the thermodynamic study. Adsorption constant during dark condition is smaller than typical adsorption equilibrium constant derived from the Langmuir–Hinshelwood kinetic model through photodegradation of MNZ that follows pseudo-first-order kinetics. Toxicity rates were reduced considerably after the photodegradation process to 88.21%, 79.84%, and 67.32% and 57.45%, 51.98%, and 43.87% by heamolytic and brine shrimp assays, respectively, for initial MNZ concentrations (20, 60, and 100 mg/L).
Conclusion: We significantly recommend using MgO NP as a promising catalyst in the photodegradation applications for other organic pollutants in visible light.
Keywords: adsorption, Langmuir, magnesium oxide nanoparticles, metronidazole, photodegradation, toxicity
Introduction
To date, antibiotics are one of the pharmaceutical compounds that have accumulated in the aquatic environment due to excessive use in different human and veterinary applications.1,2 Antibiotics are important substances employed as therapeutics, feed additives, and growth accelerators in livestock production and fish farms, as well as used as effective inhibitors for bacteria to protect crops from spoilage.3,4 Otherwise, since 2006, antibiotics have been banned as growth accelerators in the feed of livestock and fish in many countries of the European Union.5 Hence, antibiotics are receiving significant attention as being one of the hazardous chemicals which are considered as recalcitrant bio-accumulative organic compounds due to the continuous release into the environment.6,7 Recently, antibiotic contamination was monitored in river water, agricultural soils, and Wastewater Treatment Plant effluents.8–11 However, the observed environmental levels in the groundwater samples are usually in the range from the nanograms to the smallest extent micrograms per liter.12–14 Metronidazole (MNZ) belongs to a group of nitroimidazoles compounds, which is commonly used as antiprotozoal and antibacterial of anaerobic type.15 Although MNZ has side effects involving diarrhea, nausea, stomach pain, potential mutagenicity, dizziness, headache, loss of appetite, constipation, changes in taste, and carcinogenic effects.16,17 The random prevalence of metronidazole as one of the antibiotics products in surface and groundwater is a serious problem on the ecosystem organisms and a dangerous effect on human life, and hence, it has encouraged researchers to think about eco-friendly treatment techniques.18,19 To avoid the hazardous effects of contaminated water, it is necessary to protect the environment from the accumulation of antibiotics by applying physical or chemical treatment techniques. Currently, there are favorable chemical technologies that have emerged in the field of wastewater treatment, such as adsorption, chemical coagulation, ozonation, and polymeric membrane.20,23 However, all of the techniques mentioned above are more expensive for widespread application in developing countries. One of the promising wastewater treatment methods is photocatalytic degradation. Heterogeneous photocatalysis is one of the well-known advanced water treatment technologies that can be applied to its high potential for the decomposition of organic pollutants and antibiotics in the aqueous medium.15,24 This method is one of advanced oxidation process (AOPs) branches that based on the excitation of semiconductors (metal oxides) under irradiation to create electron/hole pairs and react with both water and dissolved oxygen to generate both oxidant radicals like hydroxyl and superoxide which play a considerable role in the decomposition of organic pollutants as eco-friendly methods.25,26 Heterogeneous photodegradation is widely used on a large scale for removing the persistent organic pollutants from aqueous solutions through their simplicity in design, extremely regeneration potential, free sludge operation, and low cost.27 There are various catalytic materials including nano-sized materials,28,29 carbon nanotubes, and graphene oxide have been enhanced to eliminate organic compounds from aqueous solutions.30,31 Recently, nanoparticles are a suitable option because of their large surface in order to complete chemical reactions and decay of organic pollutants.32
Magnesium oxide nanoparticle (MgO NP) is one of the most extensively investigated metal oxide nanoparticles composed from a basic oxides group, which can be widely applied as a catalyst beside used as a buffer layer due to its simple structure, non-toxicity, low cost, and high surface area with a few defect sites.33 In particular, MgO NP has the capability to absorb the X-rays and Ultraviolet radiation due to a broad energy band gap of 3.18–4.85 eV.34 Hence, MgO NP has the ability to participate in the reactions of oxidation and reduction with the proposed organic compounds due to their large surface area that promotes interaction with the oxygen restricted.35,36
Regarding the above scope, the present work aims to investigate the adsorption nature and photocatalytic performance of the synthesized MgO NP as a novel catalyst to decompose MNZ molecules as a model of an antibiotic in aqueous solution. After describing MgO NP characteristics by XRD, SEM, EDX, and TEM techniques, the effects of different parameters, such as pH, MgO NP quantity, MNZ concentration, sodium anions, and other experimental factors affecting the adsorption and photodegradation performance were conducted. Equilibrium modeling and thermodynamics studies were conducted on MNZ adsorption data using MgO NP as well as, photodegradation kinetics have been investigated. GC-MS, Chemical Oxygen Demand (COD) test and UV-Vis spectra analyses were used to evaluate the proficiency of catalytic activity of MgO NP in the photodegradation of MNZ molecules with respect to mono-component systems.
Materials and Methods
Chemical and Reagents
Metronidazole (MNZ) with molecular weight 171.15 g/mol and purity, 97% was purchased from Sigma Aldrich, USA. The physical and chemical properties of MNZ are shown in Table 1. Magnesium nitrate hexahydrate [Mg(NO3)2.6H2O]; 99% was purchased from Merck (Germany). All stock solutions were performed by dissolving a certain amount of substances to prepare the experimental solutions of different concentrations in deionized water (resistance ≈ 18.2 MΩ cm at 25°C from 2001-D Siemens System, USA). Other chemicals were purchased from Merck (Germany).
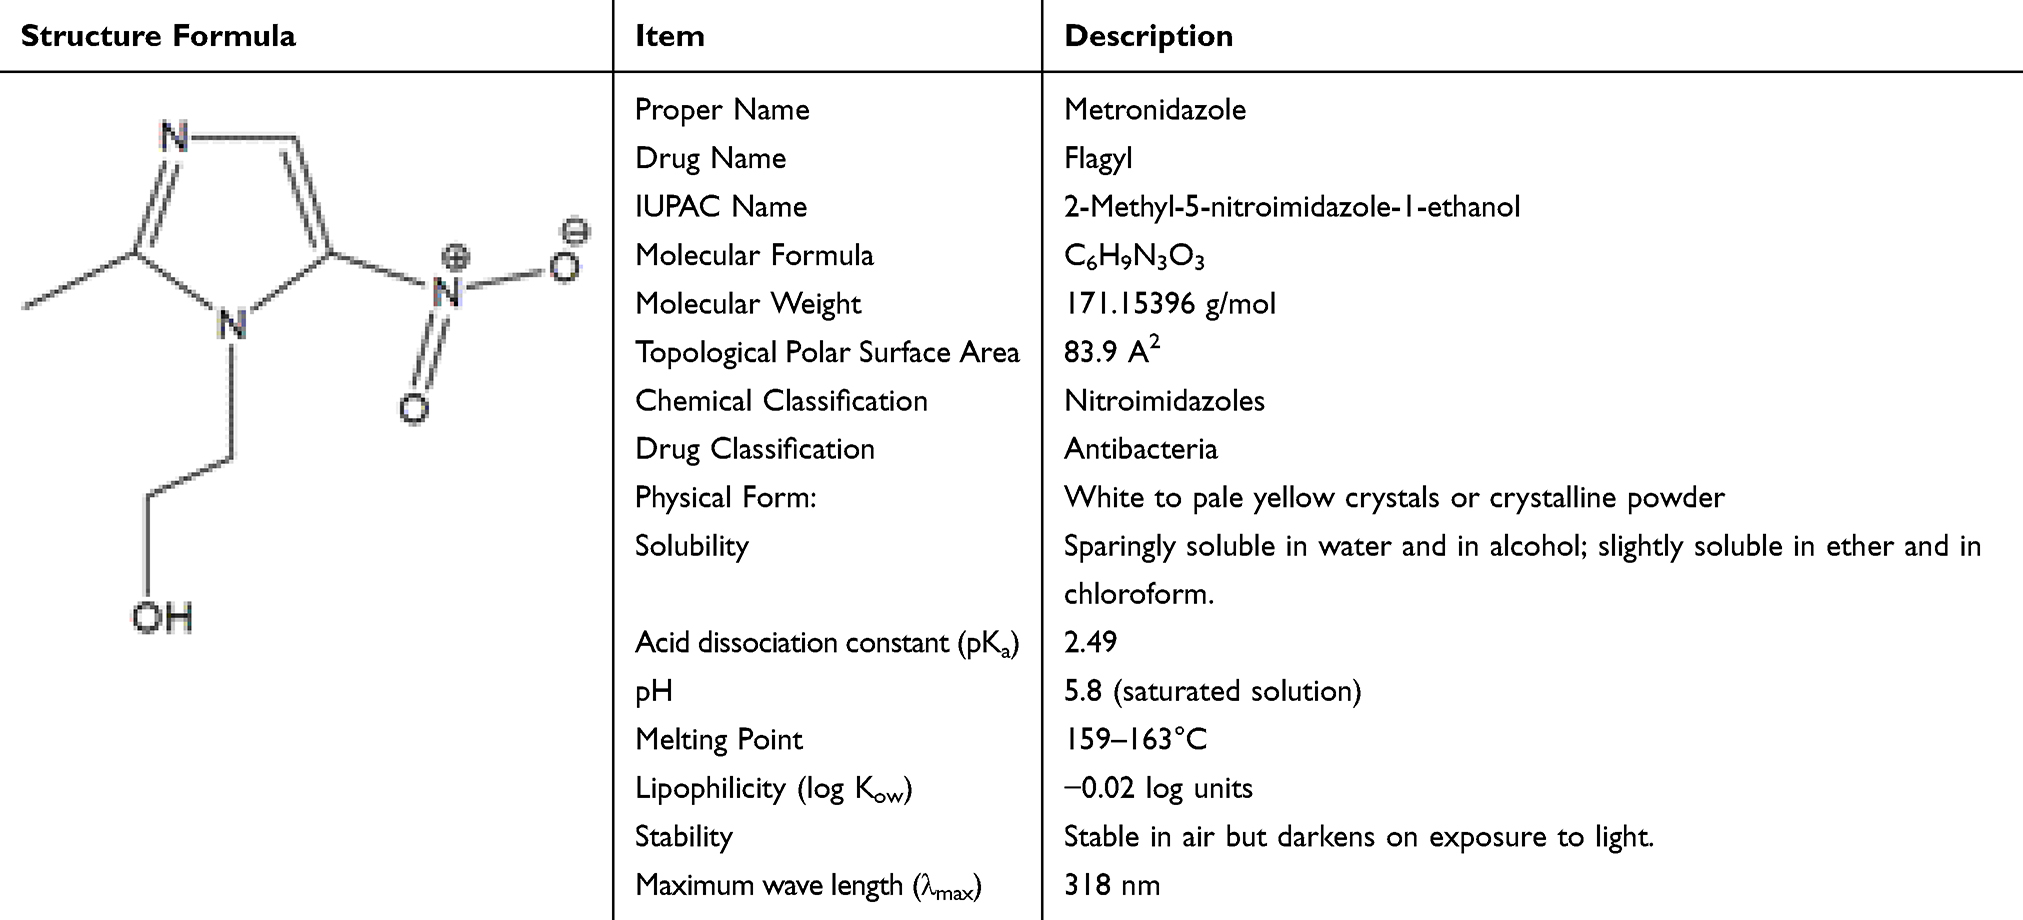 |
Table 1 Structure and Physicochemical Classification of Metronidazole |
Synthesis of MgO Nanoparticles
MgO nano-crystallites were synthesized by the co-precipitation method, which includes several steps, such as mixing, stirring, filtering, drying, and calcination. Briefly, 5.21 g of Magnesium nitrate hexahydrate [Mg(NO3)2.6H2O] was dissolved in 200 mL of distilled water in the beaker (one liter) and 200 mL of a 0.2 M NaOH solution was added drop-wise into [Mg(NO3)2] solution with continuous stirring at room temperature for 2 h under the magnetic stirrer to form a white suspension. After dropping, the obtained precipitates were centrifuged (Centrific, Model228, Fisher Scientific) for 15 min at 3000 rpm to form the white precipitate. Subsequently, a white precipitate was filtered and washed several times with deionized water and ethanol, and then dried in the oven at 110°C for 4 h. Finally, the fine precipitates were performed by calcination at 550°C for 3 h for the formation of the crystalline structure of MgO NP, in order to produce nanoparticles with regular shapes.
Characterization Techniques and Instruments
The phase evaluation of samples was performed by using X-ray diffractometer (Rotoflux, Model 10.61, Germany) with Ni-filtered Cu-Kα radiation (0.15406 Å). The XRD diffractometer was carried out at 20 mA and 30 kV at room temperature ≈ 25ºC with a step size of 0.05 and diffraction range of 2θ = 10º–70º. The diffraction pattern of MgO NP was compared with the reference data from the standards compiled by the Joint Committee on Powder Diffraction and Standards (JCPDS), which involved card No.04–0829 for MgO. Energy-dispersive X-ray spectroscopy (EDX) coupled with SEM was performed for the semi-quantitative test of the samples. The morphological characteristic of MgO NP was examined by scanning electron microscope (SEM, JSM 8404, JEOL Limited, Japan). The size particle and morphology of samples were inspected in a transmission electron microscope (TEM, JEM 2100Plus, JEOL Limited, Japan) which performed at 100 kV. UV/Vis spectra were conducted for detecting the MNZ concentration at 318 nm by using AquaMate 8000 Ultraviolet-visible spectrophotometer (Thermo Orion, USA). The specific surface determined by BET instrument (Micromeritics Gemini 2375 and Gemini V, Germany); Ammonia measurement (9512HP Ion Selective Electrodes, Thermo Scientific Orion, Germany, APHA 4500-NH3D); Chemical oxygen demand (COD) and nitrite analyzer (DR3900 HACH Ultraviolet-visible spectrophotometer, USA, APHA 5220D and 4500NO2-B, respectively); The pH of the suspensions was determined using a portable pH meter (HQ11D, HACH Instruments, USA). GC–MS measurements were performed by using an Agilent 6890 Plus equipped with an Agilent 5973N mass selective detector (Agilent Technologies, Atlanta, GA, USA) operated in the negative chemical ionization mode and a Gerstel Multi-Purpose System II (Gerstel, Müheim der Ruh, Germany) for sample injection. Chloroform (HPLC grade, 99.9% purity, Lough-borough, UK) was used to extract MNZ before and after the degradation procedures; then withdrawn by 2 mL auto-sampler glass vial sealed with a Teflon®-lined septa. The GC was fitted with a DB-5ms capillary column (35 m × 0.3 mm i.d., 0.3 m film thickness; carrier gas: Helium) from Agilent J&W Scientific (Folsom, CA, USA). The following temperature program was employed: 85°C; 20°C min−1 to 230°C; 35°C min−1 to 320°C and hold for 3 min. The injector temperature was 260°C, and all injections were made in the splitless mode. The MS interface temperature was set at 300°C. The MS system was maintained at about 3×10⁻⁷ Torr with methane as the buffer gas and MS scan parameter: 20–7000. The source and analyzer temperatures were held constant at 150°C. The emission current was optimized at ~50μA.
Adsorption and Photocatalytic Performances
The simple photo-batch reactor is a batch system consisting of 500 mL Borosilicate glass round bottom flask covered with aluminum foil to improve the irradiation of light then it is mounted on a bath stirrer to mix the solution at certain reaction intervals as in Figure S1 (see Supplementary Data). Based on the optimum experimental condition, 0.1 g of MgO NP was added as a photocatalyst to 200 mL of 80 mg/L of MNZ solution to distinguish the efficiency of adsorption and photodegradation process. In the beginning, the adsorption process was investigated in the dark with stirring for 60 min to evaluate adsorption/desorption equilibrium. Under light irradiation, photocatalytic was monitored for a certain time by using a 400 W UV-visible metal halide lamp, with a peak intensity at 254 nm (Philips, Holland). 10 mL of suspension was withdrawn and centrifuged (10,000 rpm), then estimated the absorbance of MNZ by UV/Vis spectrophotometer at λ = 318 nm.15 In particular, both the ventilation fan and temperature sensor were installed on the side of a simple photo-batch reactor to reduce the overheating of UV-lamp at 25–27°C. According to the absorbance data of MNZ samples before and after irradiation, the corresponding concentrations were calculated on the basis of a typical calibration curve. Finally, the removal proportion of the MNZ by adsorption and photodegradation process (R%) was computed by the average values of triplicate measurements.
Toxicity Evaluation
Heamolytic and brine shrimp lethality assays were conducted for toxicity assessment of pre-and post-decomposed metronidazole molecule at different concentrations (20, 60, and 100 mg/L).37,38
Results
Structural Features of MgO Nanoparticles
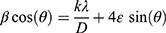
Figure 1A reveals the XRD pattern for the prepared MgO NP. The XRD spectrum includes three peaks that were virtually specified at scattering angle (2θ) of 36.8, 42.8, and 62.1 that corresponding to hkl planes of (111), (200), and (220), respectively. Readily, the diffraction peaks indicate to the cubic crystal phase according to compare with the standard data from JCPDS card No.04–0829 of MgO NP (Periclase, PDF 71–1176).39 In addition, no secondary peaks can be observed, which confirmed that the prepared MgO NP with a well-formed crystalline nature and high purity. Hence, the average crystalline sizes and lattice strains of the prepared MgO NP by inserting the XRD pattern data on the software of the origin 9 to estimate the full width at half maximum (fwhm) as in Figure 1A. Table S1 (see Supplementary Data) listed the collected data from the current pattern to calculate the crystallite size according to Williamson-Hall Eq (1).40,41
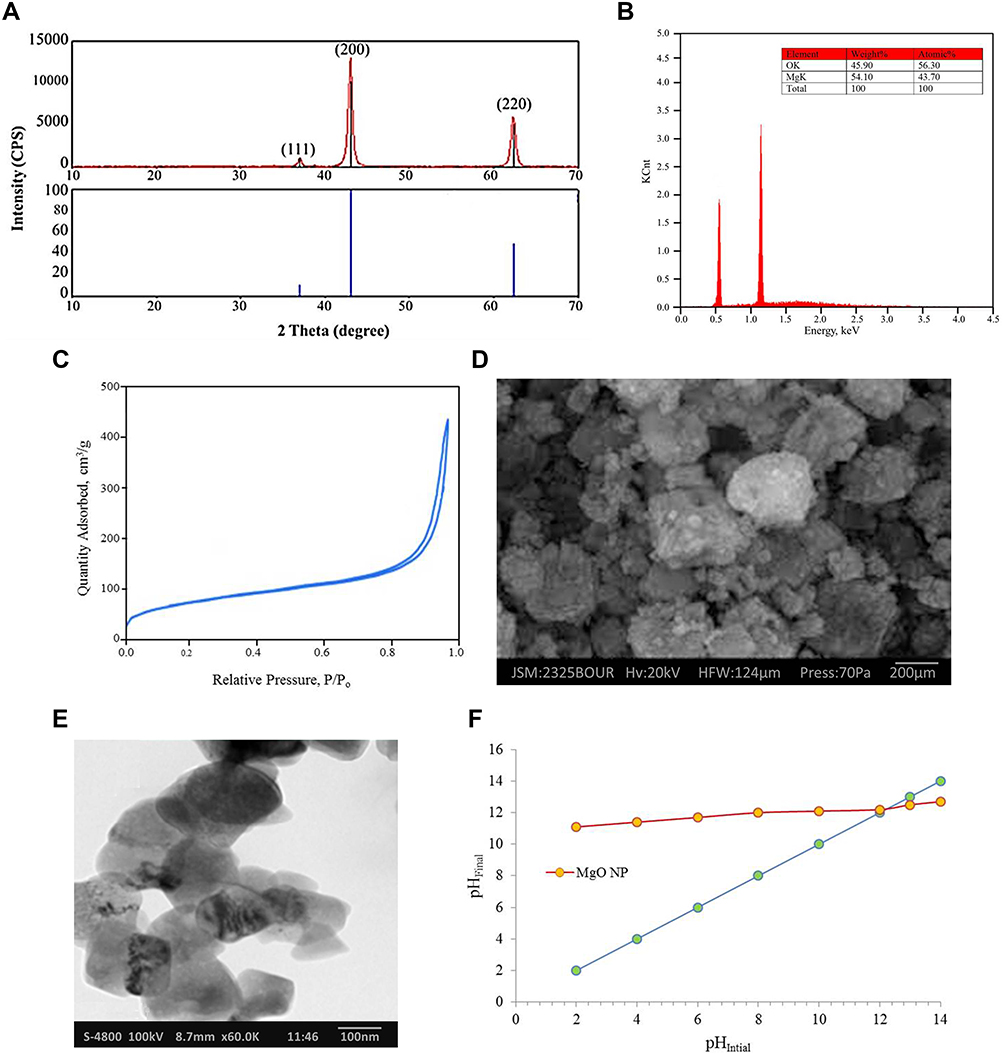 |
Figure 1 Synthesized MgO NP by co-precipitation method: (A) XRD patterns spectra, (B) EDX spectrum, (C) N2 adsorption-desorption isotherms for MgO NP, (D) SEM micrograph, (E) TEM image, and (F) pHpzc determination of MgO NP. |
where λ is the wavelength of radiation source Cu-kα (0.154056 nm), k is Scherrer constant closer to one according to the structural shape of MgO NP, θ is the Bragg angle (in radians), β is computerized values of fwhm (in radians), 4ε is the lattice strain and d is the crystallite size. As in Figure S2 (see Supplementary Data), the linear equation (y = 4 x 10⁻⁵x + 0.0065) can be derived from the linear plot of (βcosθ) against (4sinθ), which is calculated to estimate the slope (ε) and intercept (kλ/d). Therefore, the typical crystallite size of 21.33 nm was determined for the MgO NP while item 4ε recorded the strain value of 0.00001. Consequently, the W-H equation can be applied to decide the actual relationship between the crystallite size and strain values where any change in the crystallite size can be traced back to the strain variation. In contrast, the average crystallite size of 36.38 nm and strain of 0.0042 were obtained from Debye-Scherer equation. Finally, the average crystalline size of the W-H equation is smaller than that calculated from the Scherer equation due to increasing the tensile strain of the prepared MgO NP.40,42
EDX spectrum indicated the purity of the prepared MgO NP of the proposed synthesis method (co-precipitation method) and so validated the elemental structure as in Figure 1B. The results displayed that there are no peaks of other elements with a promising magnesium ratio recorded at 1.15 keV in the spectrum due to preparation of fine precipitates after calcination at 550°C for 3 h.43
Brunauer, Emmett, and Teller abbreviated as BET instrument used to determine the specific surface area (m2/g) of the synthesized MgO NP including the distribution of pore size. In general, the BET of the photocatalyst possesses an essential role in adsorption that supported photocatalytic activity. The synthesized MgO NP has a favorable surface area of 299.8 m2/g, micropore area of 43.5 m2/g, adsorption pore width of 82.9Å, and desorption pore width of 97.1Å. The N2 adsorption-desorption of MgO NP is shown in Figure 1C. Hence, higher adsorption level was observed at low relative pressure (P/Po < 0.5). The high formation of micropores boosted better nitrogen adsorption at low relative pressure.44,45
As in Figure 1D, the SEM image indicated that the morphology of MgO NP consisted of different magnifications of crystallites that aggregated in three-dimensional form. Based on the SEM images, the prepared MgO NP appeared homogenous in a cubic phase with a slight variation in particle size that is ascribed to the presence of more faces in nano-crystallines due to its semi-uniform geometrical shape.45
Figure 1E reveals the TEM image for the total size of MgO NP particle that is slightly equal or larger than the calculated crystallite size from the XRD technique. Generally, nanoparticles consist of different sizes of crystallites so that the XRD test is an appropriate method to estimate the average size of individual crystallites; hence, TEM can be appropriated for measuring grain size.40,46,47 Figure 1E shows that the shape of nanoparticles is highly cubic phase and homogeneous crystalline structures with no observable pores.
It is necessary to decide the pH value of point zero charge (pHpzc) for the MgO NP before using in the batch experiments to predict the actual charge on the surface. Moreover, the charge on the MgO NP surface is positive at a solution pH lower than that corresponding to pHpzc of the surface and is negative at a solution pH higher than pHpzc. The pHpzc value is decided by measurement of the initial pH of suspensions of MgO NP (0.1 g in 10 mL 0.2 M NaCl solution) was adjusted in the range between 2–14 by using 0.1M HCl or 0.1M NaOH with stirring (200 rpm) for 24 h. For Figure 1F, the final pH readings were plotted to determine pHpzc as a function of the initial pH values, where the value of pHpzc 12.4 was recorded at the intersection of the linear curve with the straight line.15
Photocatalysis Degradation Results
Effect of MgO NP Dosage
The influence of catalyst mass was investigated by changing the amount of MgO NP from 0.01 to 0.5 g/L on the degradation of MNZ solution (80 mg/L, stirring 300 rpm, pH 6, Temp. 30°C). Figure 2 displays an increase in the degradation efficiency under irradiation with increasing the catalyst mass up to 0.1 g/L and then decreased. Hence, the optimum MgO NP mass for degradation of MNZ is 0.1 g/L. The apparent decrease in the degradation rate after the catalyst mass of 0.01 g/L may be ascribed to the effect of screening for an excessive MgO NP amount in the solution which reduces light penetration and thus reduces the rate of photodegradation. Moreover, the decrease in the degradation rate may be interpreted by decreasing photons absorption and boosted scattering of light on the basis of blocking light transmission during the overdose of the catalyst. On the other hand, the lack of surface area was identified while increasing the catalyst dose due to agglomeration according to its particles interactions that limit the active sites.47–49
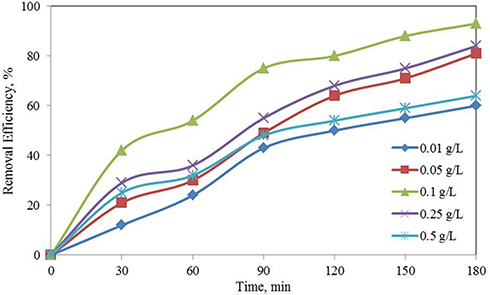 |
Figure 2 Effect of catalyst dosage on the photocatalytic degradation of MNZ under the experimental conditions specified (pH = 6, [MNZ]o= 80±0.02 mg/L, contact time = 180 min, stirring = 300 rpm and Temp.=30±2°C). |
Effect of pH Value
The pH values of the MNZ solution have a significant effect on the whole photodegradation efficiency and particularly on the adsorption capacity. The results indicated (Figure 3A) that the increase of pH from 3 to 7 leads to an increase in removing MNZ. Based on the pHpzc of the MgO NP and pKa value of MNZ are about 12.4 and 2.55, respectively. The maximum removal percentage occurred at pH 6 (92.2%) over the entire time of the reaction. Moreover, Figure 3B summarizes a decrease in the degradation efficiency of the results obtained at pH values more than 7. At more acidic (pH < 4), MNZ molecules (negatively charged) may completely cover by H+ ions as the protonated form and repel with the positively charged of the MgO NP surface. However, at 4 < pH < 7, the presence of free electron pairs of N and O atoms in MNZ molecules can attract the positively charged of the MgO NP surface. On the other hand, at more basic (7 < pH up to 10), the catalyst (positively charged) may completely be covered by OH− ions; then, competition between MNZ molecules and the OH− ions increased. Hence, the removal efficiency decreased because of the repulsion force between MNZ molecules and hydroxyl ions.15,50,51
 |
Figure 3 (A) The effect of pH on the photocatalytic degradation of MNZ, (B) plot of ln(Co/Ct) versus reaction time, t, at different pH: under the experimental conditions specified ([MNZ]o = 80±0.02 mg/L, MgO NP = 0.1 g/L, stirring = 300 rpm and Temp.=30±2°C). |
Effect of the Initial MNZ Concentration
In order to detect the optimum concentration of MNZ solution, some experiments were conducted by varying the initial MNZ concentrations from 20 to 100 mg/L to identify the optimal application of the system according to the evaluation of the degradation rate against the substrate concentration. Figure 4A represents the maximum degradation removal of MNZ in the solution is 80 mg/L. The decrease in the degradation rate after the MNZ initial concentration of 80 mg/L may be based on the spread of more MNZ molecules around the catalyst particles in the solution that increases the adsorption process on the active sites and thus decreases the photogenerated rate of hydroxyl radicals to interact with the MNZ molecules. Typical linear plot of ln(Ct/Co) vs irradiation time as a function of MNZ concentration as in Figure 4B. Based on a very short lifetime of the hydroxyl radicals (a few nanoseconds), the degradation activity decreases with low concentrations are less than 80 mg/L due to the lower capability of the collision between MNZ molecules and generated hydroxyl radicals which may be relatively deactivated in side reactions. The results demonstrated that the decrease in the degradation rate beyond the MNZ concentration of 80 mg/L can be ascribed to the presence of a greater amount of MNZ molecules that were adsorbed on the active sites of the MgO NP catalyst. Otherwise, the high concentration of MNZ solution was expected to exceed this problem and hence the process efficiency may be increased. Consequently, higher MNZ concentrations can absorb a large number of photons while the covered catalyst can absorb lesser photons that difficulty pass to the MgO NP catalyst. Certainly, the results obtained may accurately reflect that photocatalysis is a promising process at low concentrations of MNZ (less than 100 mg/L).15,50
 |
Figure 4 (A) Effect of the initial MNZ concentration on photocatalytic degradation of MNZ, (B) plot of ln(Ct/Co) versus reaction time, t, at different MNZ concentrations; under conditions: (pH 6, MgO NP: 0.1 g/L, stirring 300 rpm and Temp. 30±2°C). |
Effects of Sodium Inorganic Salts
In general, water bodies contain large amounts of inorganic anions which have a significant effect on other constituents of water quality.47 Hence, photocatalytic activity of the MgO NP catalyst was investigated for 180 min by the effect of different inorganic salts at a certain concentration 10 mg/L as (NaNO3, NaCl, Na2SO4, Na2HPO4, NaHCO3, and Na2CO3) under irradiation. Based on the significant role that these anions play in the aqueous media as scavengers for most reactive species photogenerated during degradation of organic compounds. Therefore, scavenging experiments were conducted by using different anions as following (NO3- and SO42-) for the photogenerated electrons (CO32-, HCO3−, and HPO42-) for hydroxyl radical and (Cl−) for hydroxyl radical and photogenerated holes with each other (a dual role). In the present work, the importance of photogenerated reactive species is ascribed to their role in the degradation of MNZ molecules. Consequently, the photodegradation extent of MNZ molecules decreased differentially during the addition of each scavenging agent depending on the type of scavenger as in Figure 5. These results demonstrated the inhibition pattern of MNZ degradation based on scavenging generated electron/hydrogen pairs and hydroxyl radicals that have contributed to MNZ degradation. The inhibition of MNZ degradation may be illustrated according to the role of scavenging agents in the following reactions to form new radicals as (X2•–, X• and HXO•–, where X is inorganic ions) to confirm the proposed mechanism of the photodegradation process.
 |
Figure 5 Effect of absence and addition of inorganic anions on the photocatalytic degradation of MNZ (MgO NP = 0.1 g/L, [MNZ]o = 80±0.02 mg/L, pH= 6, Stirring = 300 rpm and Temp.= 30±2°C). |
X−n + hVB+ → X•
X• + X−n → X2•−n
X−n + •OH → HOX•-n
Moreover, most inorganic anions tend to react rapidly on →active sites on the MgO NP due to their small size. AS displayed in Table 2, the pattern of photodegradation by the following inorganic anions was as the following: HCO3−>HPO42-> CO32-> SO42-> NO3−>Cl−. Based on the results, the influence of Cl− and NO3− anions is more significant than bicarbonate to confirm that the photoactivity depending on photogenerated holes/electrons then •OH radicals in MNZ degradation.47,52
 |
Table 2 Apparent Pseudo-First Order Rate Constants, Kap (Min−1), of Degradation of MNZ on MgO NP in Presence of Inorganic Salts |
Effect of Temperature
Effect of temperature on photodegradation activity of the catalyst (MgO NP) was studied in the range of temperature 303–333 K by retaining the experimental conditions constant (80 mg/L MNZ and 0.1 g/L of MgO Np). Figure 6A displays the temperature effect on the adsorption/photocatalytic processes of MNZ molecules by using the MgO NP. During the adsorption process, the rate of degradation or adsorption capacity is slightly increased with increasing temperature solution may be ascribed to acquire adequate energy to engage in an interaction. The increase in adsorption capacities of MgO NP with an increase in temperature may also be attributed to the pore size enlargement. In particular, the photodegradation activity in presence of the catalyst usually depends on temperature; thus, the results indicated a high rate of degradation with increasing temperatures due to the endothermic nature of the reactants with a regular increase of activation energy.48,53 Figure 6B displays a linear relationship of plots of ln(Co/Ct) versus time to study the effect of temperature on the reaction rate of MNZ degradation, which confirmed that pseudo-first-order model fits this process. Hence, the rate constant increases gently from 1.28 × 10⁻² to 1.49 × 10⁻² min−1 over the temperature range of 30°C to 60°C, respectively. On the basis of the above observations, any increase in temperature leads to an increase in the movability of MNZ molecules, especially at the beginning of the photocatalytic process. Thus, the temperature increase may enhance competition between the various elements of the degradation process to more effectively compete to generate more electron-hole pairs.48,53,54
 |
Figure 6 (A) The effect of different temperatures on the photocatalytic degradation of MNZ, (B) plot of ln(Co/Ct) versus reaction time at variation of the reaction temperature: under the experimental conditions specified ([MNZ]o = 80±0.02 mg/L, MgO NP = 0.1 g/L, stirring = 300 rpm and pH=6). |
Thermodynamic Study for Adsorption and Photodegradation Processes
Thermodynamic investigations are necessary to estimate the feasibility of the adsorption/photodegradation processes that were performed at different temperatures as well as evaluate the nature of the reaction and the activation energy as in Table 3. Adsorption thermodynamic pattern was investigated using the thermodynamic equilibrium parameters decided at different concentrations and temperatures in order to confirm the potential adsorption mechanism.

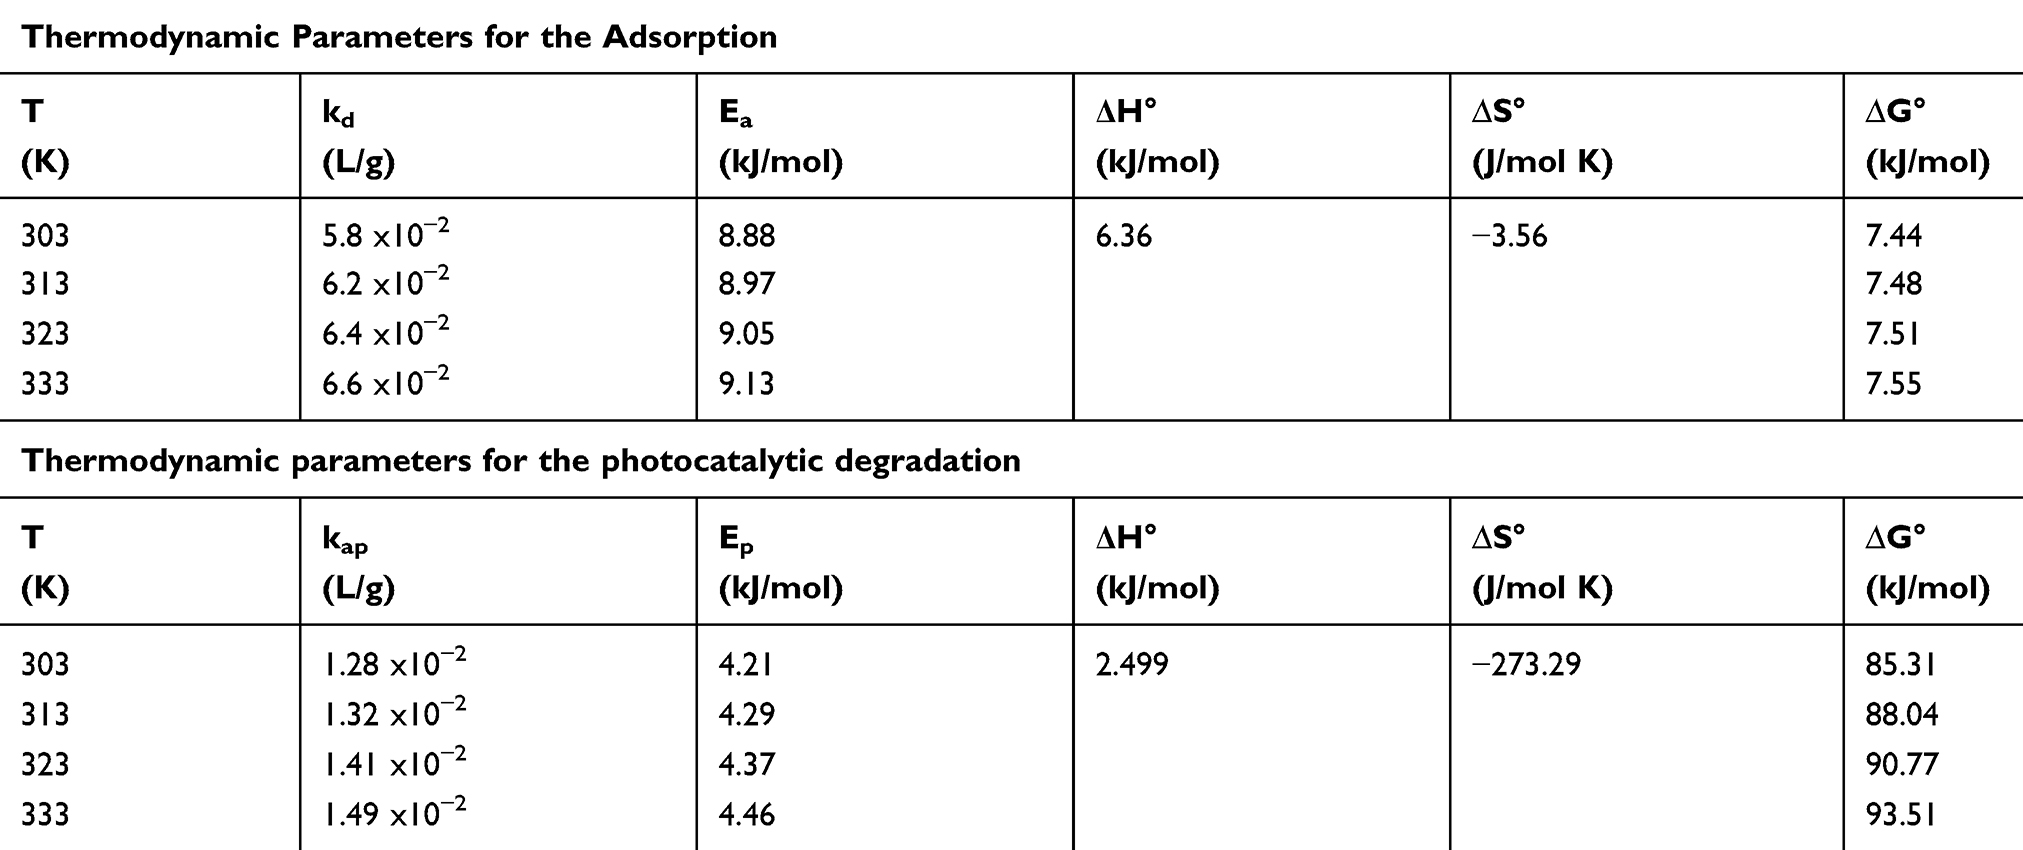 |
Table 3 Values of Kinetics and Thermodynamic Parameters for the Adsorption and Photocatalytic Degradation of MNZ on MgO NP |
where kd is the thermodynamic equilibrium constant (L/g) can be decided from (qe/Ce), Ce is residual equilibrium concentration (mg/L), qe is the quantity of MNZ molecules adsorbed per unit weight of MgO NP at equilibrium (mg/g), ΔH° is the enthalpy change (kJ/mol), ΔG° is the Gibbs energy change (kJ/mol) and ΔS° is the entropy change (J/mol. K), Ead is the apparent activation energy of the adsorption (J/mol), R is the gas constant (8.31 J/K mol) and T is the solution temperature (K).48,55
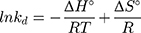
Based on the above equations, the linear plot of van’t Hoff between lnkd vs 1/T, the parameters of thermochemical reaction ΔH° and ΔS° can be determined as in Figure 7A. Hence, the values of ΔG° at different temperatures can be determined on the basis of enthalpy (ΔH°) and entropy (ΔS°) to describe the most suitable adsorption behavior for the current experimental data. Consequently, the results of thermodynamic considerations indicated that the ΔG° values are the principal factor to detect the adsorption characteristics. The observed positive ΔG° values (32.34 to 35.2 kJ/mol) indicate that MNZ adsorption type is non-spontaneously as in Table 3.56,57 According to the small gap between energetic potentials of the process components that is responsible for the redistribution of MNZ molecules in the system. Moreover, the increase of positive ΔG° values with the raise of temperature suggests a slight increase of adsorption at high temperatures. On the basis of the tendency of some water molecules to form a shell of hydration ions that are impeded the adsorption process at low temperature. Positive ΔH° value (3.54 kJ/mol) demonstrates the endothermic behavior of the adsorption reaction. Based on ΔH° value, the apparent activation energy of the adsorption can be obtained according to (∆H°= Ead - RT). Therefore, the results of the activation energy values (Ead, 8.88 −9.13 kJ/mol) are in the required range for the ion exchange and chemisorption (8–16 kJ/mol). Therefore, the results of thermodynamic parameters suggest that the dominant adsorption for MNZ ions/molecules is the chemisorption adsorption, while ion exchange is not favorable for removing MNZ due to MgO NP is high purity according to the results of XRD and EDX analyses. Also, negative values of ΔS° suggest that the type of MNZ adsorption in solution is chemisorption due to the favorable process that was carried out by the replacement of a small (limited) amount of ions.56,57
 |
Figure 7 (A) Van’t Hoff plot of lnkd versus 1/T for adsorption of MNZ onto MgO NP, (B) Arrhenius plot of lnkap versus 1/T for degradation of MNZ by MgO NP, and (C) plot of ln(kap/T) versus l/T. Under condition: (MgO NP = 0.1 g/L, [MNZ]o = 80±0.02 mg/L, pH= 6, Stirring = 300 rpm). |
On the other hand, thermodynamic parameters for the photodegradation process were investigated according to Arrhenius equation by using pseudo-first-order rate constants (kap).
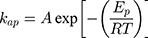
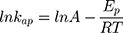
where kap is the pseudo-first-order rate constants (L/g) that can be decided by plotting ln(Co/Ct) against time, Ep is the apparent activation energy of the photocatalytic degradation (J/mol) and A is the Arrhenius constant (min g/mg). Figure 7B displays the Arrhenius plot of lnkap versus 1/T for photocatalytic degradation of MNZ by using MgO NP. Thus, a slope of the linear plot is (-Ep/R) as evident in the Arrhenius equation, from which the apparent activation energy (Ep) can be determined. Hence, the mean activation energy (Ep≈4.332 kJ/mol) is less than the required range of ion exchange and chemical adsorption (8–16 kJ/mol). The thermodynamic parameters obtained for the photodegradation process of MNZ by using MgO NP are summarized in Table 3. Figure 7C displays a linear plot of ln(kap/T) versus 1/T yielded a straight line from which the change in the standard enthalpy (ΔHo) could be deduced from the slope of linear plot (-ΔHo/R). Therefore, the entropy (ΔSo) and the change in free energy (ΔGo) were determined according to Arrhenius and Eyring equations:


where KB is Boltzmann’s constant (1.380649 × 1 0−23 J/K) and h is Planck’s constant (6.62607015 × 10⁻³⁴ J.s). Based on the obtained results, the positive ΔH° and ΔG° values suggest that the photocatalytic process depends on the thermal activity to form new holes and electrons on the catalyst surface. In particular, an increase of rate constant (kap) with increasing temperature indicated that the photodegradation of MNZ by the MgO NP was an endothermic process. Moreover, any increase in temperature of more than 80°C causes a decrease of dissolved oxygen concentration in the suspension that is undesirable for the photoactivity process. In contrast, the negative ΔS° value (−273.29 J/mol K) reflects that a reduction in the randomness of the solid/liquid interface during the photodegradation step. Hence, high negative ΔS° value suggests that no significant change occurs in the internal structure of the catalyst during the photodegradation process. Finally, thermodynamic parameters suggest the removal of MNZ molecules depends on photodegradation more than chemisorption process.58,59
Adsorption and Photocatalytic Reaction Performance
Based on the optimum data obtained from the photo-batch reactor, MNZ solution under the UV light without using the photocatalyst (Photolysis process); The data was stable up to 180 min due to the absence of MgO NP, which enhances the important role of adsorption and degradation procedures of the MNZ molecules. In contrast, under the dark (Adsorption process); There was a slight decrease in the initial MNZ concentration by using MgO NP until equilibrium as given in Figure 8A. Under UV light with using the photocatalyst, the initial MNZ concentration decreased slowly because of the adsorption of MNZ onto MgO NP then further decreased under UV irradiation up to 90%. Figure 8A illustrates changes in the removal percentage of MNZ molecules under different procedures.60
 |
Figure 8 (A) Effect of different processes on MNZ removal, (B) decomposition of MNZ at equilibrium conditions: (I) dark adsorption experiment, (II) photodegradation process under light radiation. |
Basically, adsorption-desorption experiment was executed under a dark condition before visible light irradiation. Moreover, it was revealed that the adsorption equilibrium between MgO NP and MNZ molecules had been extended to 40 min. The photocatalytic experiments were carried out under light irradiation conditions, after 60 min of dark adsorption process in order to investigate the efficiency of photodegradation experiments and adsorption process between MgO NP and MNZ molecules.48
Figure 8B presents the effect of the photodegradation process on MNZ molecules by using MgO NP for three hours. Therefore, the decomposition of MNZ under irradiation could be slowly with no significant changes with using 0.01 and 0.5 mg MgO NP. As for 0.01 mg of MgO NP reported the lowest value, after adsorbing 18% of MNZ, about 26% of MNZ was decomposed during the photocatalytic process, reaching 44% in total, while 0.5 mg of MgO NP showed much higher activity than above kind of MgO NP under the irradiation exposure. It was clearly observed that 0.1 mg of MgO NP displayed the excellent performance in the decomposition of MNZ where recorded about ≈93.2% in total, after adsorbing 35.7% of MNZ then the efficiency of the photodegradation process reaching 57.5%. As presented in Figure 8B, in the first hour under irradiation, it was indicated that the rate of degradation was very fast, and approximately 40% of MNZ was decomposed. In the next hour, >19% of the MNZ was degraded, reaching 83% of the total MNZ. After irradiation, 93.2% of the total MNZ was removed after 3 h.15,60,61
Discussion
Isotherm Models for Adsorption Study
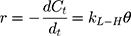
The adsorption isotherm data clarified the equilibrium relationship between the quantity of MNZ adsorbed and unit mass of MgO NP in the liquid/solid phase at a certain temperature range (30°C–60°C). It becomes necessary to detect and investigate an appropriate isotherm model to evaluate the removal behavior of the adsorption step. Consequently, the recorded experimental data were investigated by using the following linear form equations of isotherm models including Dubinin–Radushkevich (D-R), Langmuir, Freundlich, Temkin, Redlich–Peterson (R-P) and Toth models as in (Figure 9A–E).48,62,63 Table 4 states the data of various parameters calculated from all the isotherm plots. Dubinin Radushkevich model is more common and does not depend on a homogenous adsorbent surface, it focuses on adsorbent porosity and the adsorption energy that suggests the type of adsorption process by equation (12).

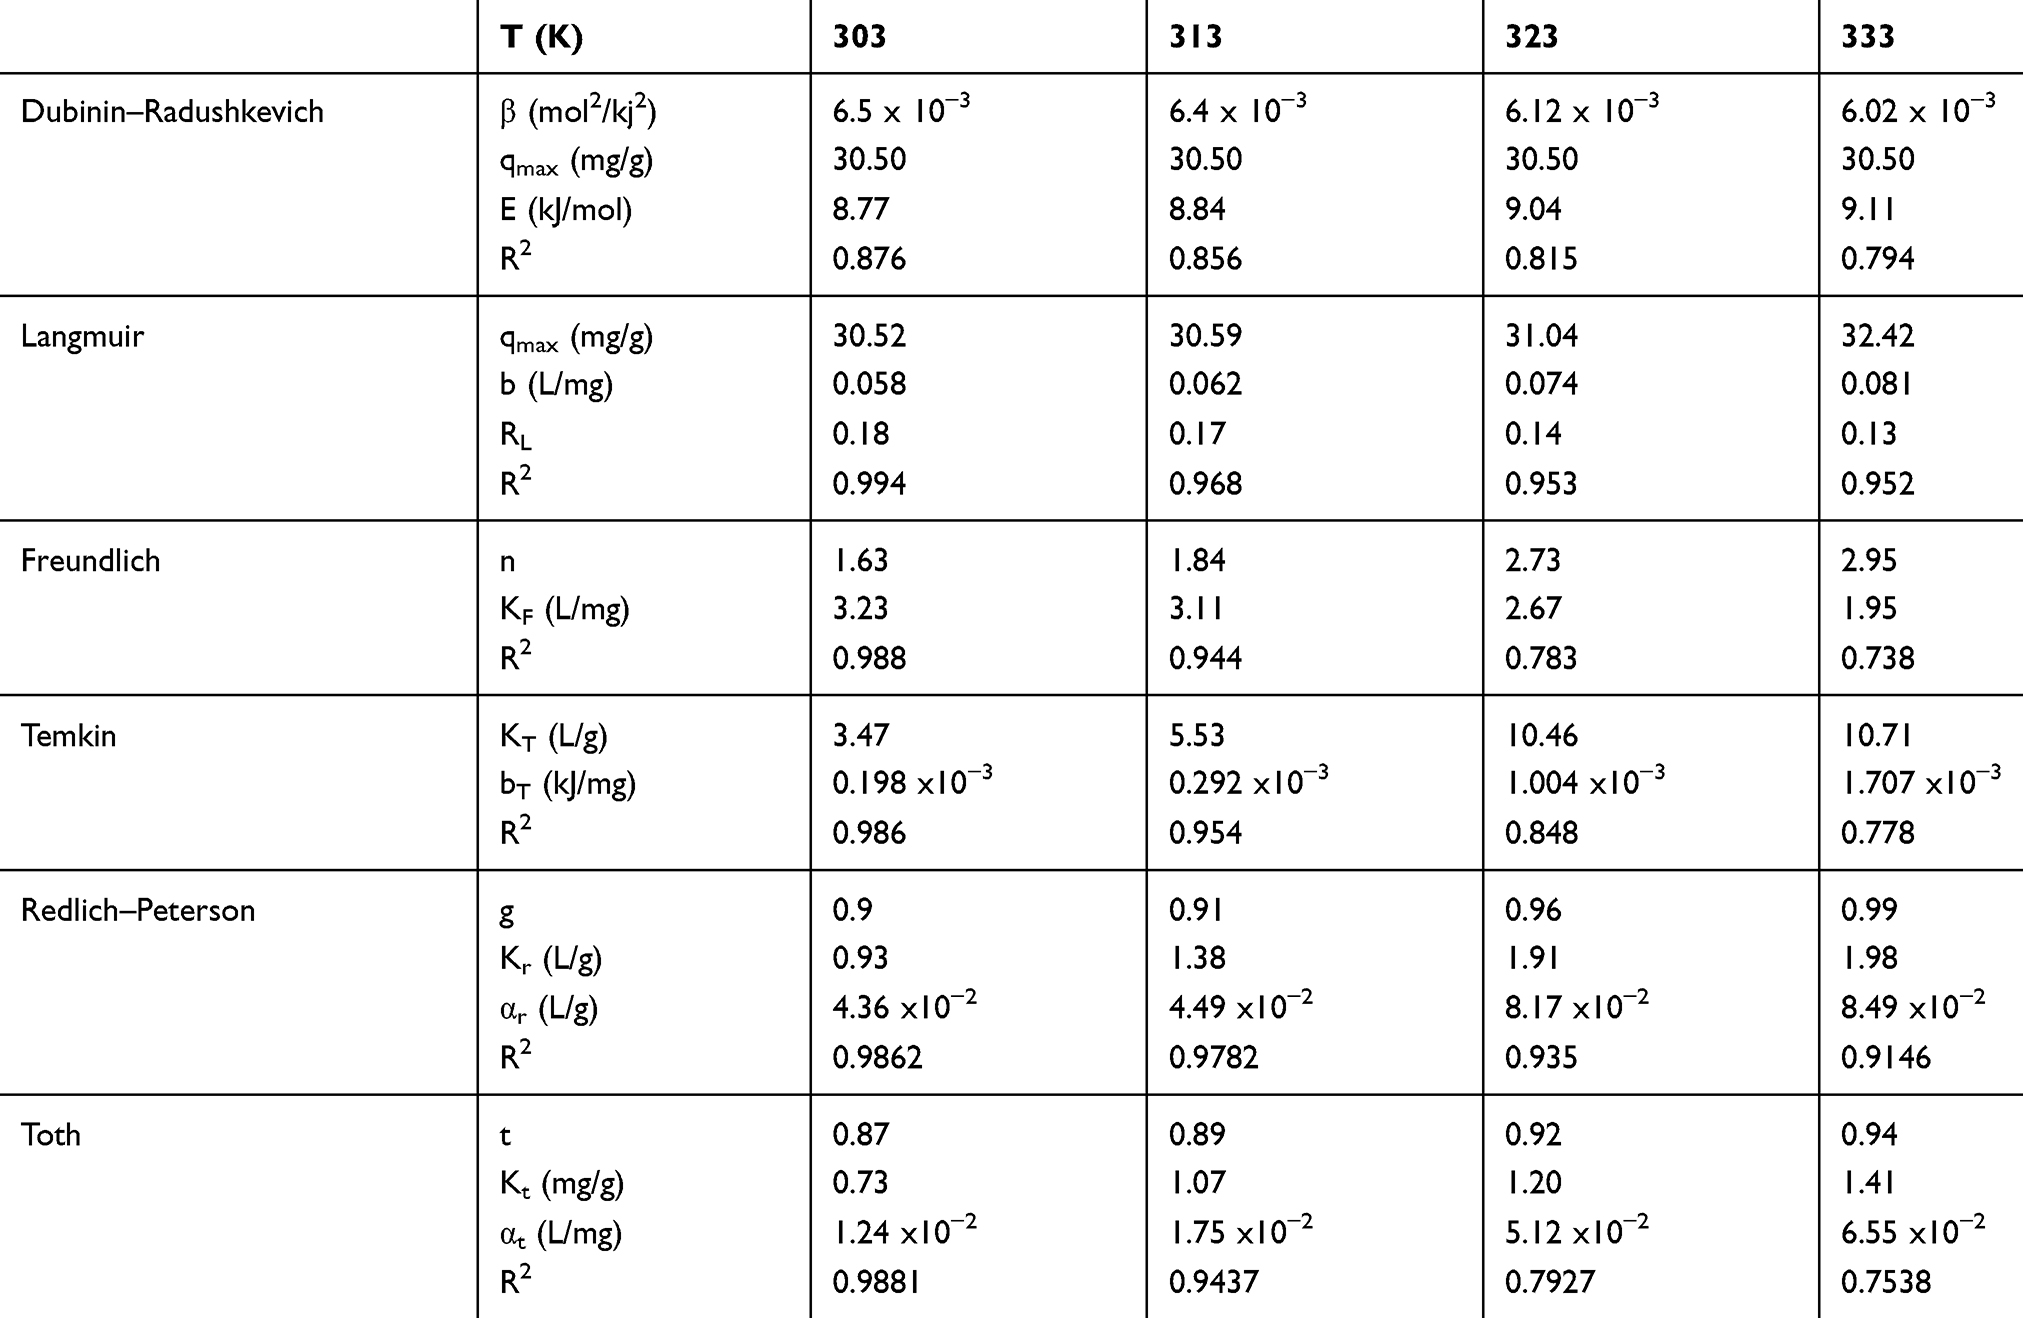 |
Table 4 The Results of Adsorption Isotherm Parameters of MNZ on MgO NP from Batch Experiments |
 |
Figure 9 Linear fitting plots of (A) Dubinin Radushkevich, (B) Langmuir, (C) Freundlich, (D) Temkin, (E) Redlich–Peterson, (F) Toth isotherm models for the adsorption of MNZ onto MgO NP. |
where qe is the quantity of MNZ molecules adsorbed per unit weight of MgO NP at equilibrium (mg/g), qd is the D-R isotherm constant correlated with the degree of MNZ sorption by the MgO NP (mg/g), β is associated with apparent energy of adsorption (mol2/kJ2); ε is the potential of Polanyi (ε= RT ln(1 + 1/Ce)), R is the gas constant (8.314 J/mol K) and T is temperature of solution (K). Figure 9A shows the plots of D-R isotherm that plotted between lnqe and ε2 to determine the values of β and qmax from the slope and intercept, respectively. Therefore, the mean value of the apparent energy of adsorption is the calculated value for the change of free energy to transfer one mole of MNZ molecule to the surface of MgO NP based on (Ea= (2β)−0.5). The result of the mean calculated value of (Ea ≈ 8.94 kJ/mol) suggests the current reaction of the chemisorption type.62 On the basis of the standard range of free energy for the ion exchange and chemisorption is (8–16 kJ/mol) that boosts the chemical type for the proposed adsorbent more than ion exchange due to high purity of MgO NP based on the results of XRD and EDX analyses.65,66
The Langmuir model is the simplest mathematical equation that can be employed to clarify monolayer adsorption.65
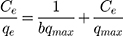
where Ce is the equilibrium concentration of the solution (mg/L); qe is the amount of MNZ adsorbed per unit mass of MgO NP (mg/g) at equilibrium; qmax is the maximum adsorption capacity for a complete monolayer (mg/g), and b is a Langmuir constant related to the affinity of the binding sites and energy of adsorption (L/mg). A high b value indicates a high affinity. The values of qmax and b were determined for MNZ, respectively, from intercept and slope of the linear plots of Ce/qe versus Ce as presented in Figure 9B. On the other hand, the Freundlich isotherm is not limited to describe uniform adsorption but also characterize heterogeneous adsorption at certain sites with different intensity and with unconformable adsorption sites.62,63

where KF is a Freundlich constant related to adsorption capacity (L/g), 1/n is an empirical parameter related to adsorption intensity. Furthermore, a plot of lnqe versus lnCe gives a straight line with KF and 1/n determined from the intercept and the slope, respectively, as observed in Figure 9C.
Based on the summarized data of isotherm parameters are in Table 4, the magnitude of RL (RL= 1/1 + bCi) was less than one however the n value was greater than one thus adsorption reaction was appropriate. Langmuir isotherm best described the removal of MNZ onto MgO NP based on the correlation coefficient value (R2= 0.994), this suggests that adsorption nature in the MNZ-MgO NP system was onto the uniform sites rather than onto multilayer adsorption.64–66 The maximum capacity of the monolayer’s adsorption for MNZ onto MgO NP was determined to be 32.42 mg/g, a high removal percent of the adsorbed MNZ molecules was detected within the adsorption process.
The Temkin isotherm model supposes that the heat of adsorption components decreases regularly with the increase in the formation of the monolayers’ adsorbent surface up to maximum distribution. Temkin isotherm can be applied by using the following Eq. (15):
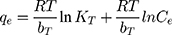
where KT (L/mg), is the equilibrium constant that regarding the maximum binding energy and bT (kJ/mg), is the variation of adsorption energy that is correlated with the adsorption heat (ΔH°ad). The values of KT and bT were determined for MNZ ions/molecules, respectively, from intercept and slope of the linear plots of qe versus lnCe as in Figure 9D. In the ambient temperature range (30°C), the interaction between the MNZ and MgO NP is possibly small due to the presence of a lower number of exposed adsorption sites. However, at high temperatures (50°C and 60°C), the chemical binding between MNZ molecules and MgO NP increases due to the increase of complex formation, chelation, and electrostatic attraction. Therefore, chemisorption plays a vital role to recognize the binding mechanism when the adsorption heat (-ΔHoad) is more than 8 kJ/mol.67 The low R2 value, decided from Temkin model, implied that the adsorption heat of MNZ molecules in a layer gradually reduced with the surface coverage of the MNZ-MgO NP interaction. Hence, the results confirmed that multilayer adsorption has occurred.67 However, the results obtained from the Temkin model indicate the values of bT display a different impression to the other recorded for qmax for Langmuir and D-R models.66
Adsorption data of MNZ onto MgO NP were evaluated by Redlich-Peterson (R-P) model is one of the important isotherm models of three-parameters that combine the characteristics of Langmuir and Freundlich isotherms. Hence, this isotherm has a multifunctional possibility to investigate the adsorption process for mono and multilayer adsorption.64,66 Therefore, the R-P parameters (g, Kr and αr) can be computerized from the linear plots between lnCe/qe vs lnCe by sigma plot software according to the following logarithmic Eq. (16):
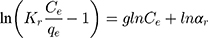
where Kr (L/mg) and αr (L/mg) are the R-P constants, g is the exponent which describes the surface homogeneity, if the value of g is close to the unity, the R-P isotherm is well compatible with the Langmuir isotherm.66 In contrast, the deviation of g value from the unity returns to the heterogeneous surface as applied with Freundlich isotherm but indicates the Henrys’ equation when it is equal to zero. Redlich–Peterson model was also investigated to adequate the equilibrium data of the adsorption of MNZ onto MgO NP and the obtained parameters are deduced from Figure 9E. Based on the results in Table 4, the observed values of g parameter mean the R-P isotherm is more compatible with the Langmuir isotherm which also indicates the monolayer distribution of the complex formation on the adsorbent surface.66,68
Toth isotherm is another model of three-parameters equations which includes the features of Langmuir and Freundlich isotherms and also can be attained of potential theory and Langmuir equation.66,69 Hence, this isotherm is also used to decrease the error rate between the values of empirical data and the estimated equilibrium data. Toth model is most accurate to characterize heterogeneous and multilayer adsorption systems that suitable for low and high adsorbate concentrations. The linear form of the Toth model is expressed by the logarithmic equation (17):

where Kt (mg/g) and αt (L/mg) are the Toth equilibrium constants, t is the exponent of Toth equation which characterizes the surface heterogeneity. In the same manner, if the value of t is close to the unity, the Toth isotherm is well favorable with the Langmuir isotherm. Whereas, if the obtained t values are more than the unity, the Freundlich isotherm can be appropriate to describe the adsorption system. Figure 9F represents the linear plots between lnqe against lnCe by sigma plot software to determine the parameters of Toth isotherm. As shown in Table 4, the values of t are close to the unity to demonstrate that monolayer adsorption type as appeared with Langmuir isotherm. In general, the results indicated that the R-P and Toth parameters increase with increasing temperature to reflect the endothermic nature of the system.64,66,69
Photocatalytic Efficiency and Kinetic Study
Elimination of MNZ molecules through the photodegradation process by using MgO NP as catalyst during irradiation time of thee hours as in Figure 8B. Actually, during the first hour of the photodegradation process, the rate of degradation was high by increasing the interval time. Hence, the rate of photocatalytic degradation was decreased regularly due to the intermediate compounds that were formed through the reaction and then effect on the activity of catalyst.68,70
Generally, photocatalytic degradation kinetics of heterogeneous organic compounds could be successfully illustrated using the Langmuir–Hinshelwood (L–H) equation to describe the kinetics of photocatalytic process of MNZ over the MgO NP surface. Moreover, the L–H model was usually used to cover the relationship between initial rate of photocatalytic and initial concentration of the reactant. Where, the L–H model was enhanced to express gas-liquid reactions, but now it was widely utilized for solid-liquid reactions. The degradation rate (r) is directly proportional to the surface catalyst fraction covered by MNZ (θ), which is expressed as follows (Eq. (18)):
where r is the initial rate of reaction (mg/min), Ct is the concentration of MNZ at an interval time (mg/L), θ is the coverage ratio of pollutants on the MgO NP surface and kL–H is the reaction rate constant (mg/min). According to Langmuir isotherm theory, the coverage ratio was proportional to adsorption capacity and the concentration of the reactant. Kad was stated as adsorption equilibrium constant to measure the adsorption capacity of MgO NP and coverage ratio was identified by the following expression:

Certainly, the reaction rate relied on the concentration of holes/electrons pairs and •OH radicals where the photocatalytic process based on their reaction with MNZ molecules on the catalyst surface.

where θ•OH is the fraction of sites covered by hydroxyl radicals and θC is the fractional site coverage by MNZ. These two last variables were deduced as the next:

where KO2 and Kad are equilibrium adsorption constants, and i is the intermediate products of MNZ degradation. Eq. (22) can be modified by making the following assumption:

From the above equation, Ki and Ci are the adsorption equilibrium constant and concentration for intermediates, respectively. Moreover, an assumption of the adsorption rate was equivalently described using the coverage ratio of the MNZ over the surface of MgO NP. Substituting Eq. (23) into Eq. (22) gives the following expression:

Certainly, the partial pressure of oxygen remained constant for all photocatalytic runs, the fraction of sites covered by hydroxyl radicals was considered to be constant. Thus, Eq. (24) can be expressed as:

According to Figure 8B, the photocatalytic reaction rate was faster than the adsorption rate. So the overall photocatalytic reaction rate was mainly dominated by the adsorption rate. By substituting kc from Eq. (25) to Eq. (24), the rate of reaction (r) can be expressed as Eq. (26)
where kc is the reaction rate constant (mg/min), that determines according to some variables such as initial catalyst dose and electrons-holes efficiency, Kad is the Langmuir–Hinshelwood adsorption equilibrium constant (L/mg). For highly diluted solutions (Co ≤ 10−3 mol/L ≈100 mg/L) the term “Kad Co” is negligible with respect to the unit.67–69 Thus, Eq. (26) can be simplified as the form of an apparent first-order Eq. (27):

Under the current experimental conditions, the photooxidation process can be simplified to the first-order kinetic expression with an apparent rate constant that must include competitive adsorption by intermediates, therefor the Eq. (27) can be described as the expression below:


By integration of Eq. (28) from Co to Ct, the first-order kinetic model can be deduced as the next equation:

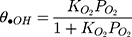
where kap represents the first-order constant that included hydroxyl groups and holes attack rate coefficients and that of adsorption onto the catalyst surface. By plotting ln(Co/Ct) versus irradiation time (t), Eq.(12) to obtain a straight line whose slope is kap. As shown in Figure 10A, the kinetic study shows a straight line with linear regression coefficient (R2) which indicates that the kinetics of the photocatalytic degradation of MNZ on the catalyst surface was fitted to the Langmuir–Hinshelwood model. According to the majority of previous researches, the rate of reaction depended on the concentration of electrons/holes pairs and •OH radical. The rate-determining step of the photocatalytic reaction was considered to be the reaction of electrons/holes pairs or •OH radicals with MNZ molecules over the catalyst surface. Subsequently, the semi-logarithmic graphs of normalized concentrations of MNZ, ln(Co/Ct), under UV-radiation in the presence of MgO loading (0.1 g/L) versus reaction time specified good linearity indicating pseudo-first-order reaction with respect to the MNZ concentration.15,41,52,54
 |
Figure 10 (A) Plot of ln(Co/Ct) versus reaction time at different initial concentrations of MNZ, and (B) rate constant of photocatalytic degradation as a function of initial MNZ concentration, (C) Langmuir-Hinshelwood model outcomes for the decomposition of MNZ at different initial concentrations; (MgO NP: 0.1 g/L, pH 6, Stirring: 300 rpm and Temp. 30±2°C). |
Substantially, multiplying the apparent constants (kap) obtained through the slope of the straight line in the plot of Figure 10A by the initial concentration (Co) yields the initial rate (ro) for first-order reactions. Under variable experimental conditions that were used in the current study, the L–H model is fit for determining the rate constant to compare the reaction rate.71 As displayed in Figure 10B, the results of the initial degradation rate (ro) of MNZ were as a function of the initial concentration. The linear form for Eq. (27) could be performed as follows:
It is worth noting that the obtained reaction rate constant (kap) for the degradation of MNZ was determined by linear regression (Figure 10B). Therefore, the regression coefficient (R2) value was higher than 0.9, which confirmed the proposed kinetics for the degradation of MNZ in this study. The constants kc and Kads for the Langmuir–Hinshelwood model were acquired with fitting kap at different MNZ concentrations using the software package Minitab (Version 17) and are tabulated in Table 5.
 |
Table 5 Apparent first-Order Rate Constant (Kap) and Initial Rates Constants (Ro) of MNZ |
Based on the above results, the low values of kap were observed with increasing the initial MNZ concentrations, while low concentrations of MNZ recorded fewer values for kap.69 Generally, the purpose of this kinetic modeling was applied to the reaction rate constants that might be useful for comparison with other photodegradation processes. Hence, the plot of 1/ro versus 1/Co according to Eq. (30), as in Figure 10C. It was found that a strong linear relationship with a high correlation coefficient (R2 > 0.99). Consequently, the calculated values of rate constants (kc and Kads) indicated that the degradation of MNZ occurred mainly by MgO NP as displayed in Table 5.71
Figure 10C displays the much-known graph of L-H model that was widely applied in the kinetic study of photocatalytic reactions. The L-H model was used to study photocatalytic degradation of MNZ over the MgO NP under UV irradiation that enhanced the reaction rate due to the high energy of the photoactivity system. According to the modified form of the L-H model, which was focused on the effect of applied conditions such as the MgO NP weight, initial MNZ concentration and reaction time. It was expected that the rate constant (b) obtained from the corresponding isotherms considering the Langmuir model with the adsorption constant (Kad) that was derived from the Langmuir–Hinshelwood model for the degradation of MNZ by MgO NP were not equivalent.71
Actually, the above result was identical to several previous studies. Hence, the adsorption equilibrium constant derived from the Langmuir–Hinshelwood kinetic model was larger than the dark equilibrium constant those obtained from the adsorption isotherms. First of all, the observed difference could possibly be attributed to the fact that the hydrophilic nature depends on the presence of water clusters on the surface of the catalyst under humid air conditions. As well as, these results could be attributable in part to the shortage of the adsorption sites on MgO NP surface were not equally irradiated; thus, electrons distribution could affect the photocatalytic reactions.71,72
Characterization of Intermediate Products
UV-Vis Spectra of MNZ During Photocatalytic Reaction
Figure 11A represents the UV-Vis spectra of the solution includes MNZ molecules (80 mg/L) under the optimum conditions (318 nm) through the photodegradation process by the MgO NP catalyst for 180 min. The absorbance spectra displayed that the intensity of obvious peak at 318 nm decreased continuously with increasing the photodegradation time, which demonstrated the decomposition of MNZ molecule. Based on the photoactivity, the intensity of absorbance increased again at 220 nm to suggest the existence of the nitro group and nitrogen that separated from MNZ molecules were degraded to form nitrite ion. Consequently, these results boosted the role of the proposed catalyst to degrade MNZ completely under the applied conditions.15,73
 |
Figure 11 (A) Decrease in UV-Vis absorption spectra of MNZ solution during its photodegradation by MgO NP catalyst; (B) variation in COD, Ammonia and Nitrite concentrations during photocatalytic degradation of MNZ solutions onto MgO NP (MgO NP: 0.1 g/L, [MNZ]o: 80±0.02 mg/L, pH 6, Stirring: 300 rpm and Temp. 30±2°C). |
Mineralization of MNZ Molecule
Based on the results of Ammonia (NH3) and Nitrite (NO2) concentrations before and after the photodegradation system was performed to evaluate the mineralization of the MNZ molecules along irradiation time under applied conditions. As in Figure 11B, the obtained values of NH3 and NO2 concentrations regularly increased when the time of the photodegradation process was increased. In contrast, the latter COD values were less than those measured at the beginning of the photodegradation process. Hence, the observed data confirmed the successful mineralization of MNZ molecules and so its degradation process intermediates into NH3, NO2,CO2 and water.15
GC–MS Analysis of MNZ During Photocatalytic Reaction
Based on GC-MS analysis, the monitoring of the photodegradation pathway was sufficiently carried out to recognize the by-products formed through the degradation of MNZ molecules in the suspension over MgO NP under applied conditions. Figure 12 displays the GC-MS chromatograms of MNZ solution before (A) and after (B) photodegradation process by using MgO NP at a retention time of 34.4 min. Hence, GC chromatogram indicated the disappearance of the obvious peak of MNZ molecule at retention time 3.544 min with new several peaks appeared in the time of the degradation process of MNZ under applied conditions which confirmed by the mass spectrum of the fragments as in Figure 12C. Although there are several competing sites in the MNZ molecule, but it became possible to propose a typical path to attack the electrons/holes pairs and hydroxide radicals at irradiation times. In this manner, the proposed pathway for the photodegradation of MNZ molecule is consistent with the previous studies that suggested photodegradation occurred by hydroxyethyl cleavage, nitro-reduction, and N-denitration to form aliphatic compounds, which would be decomposed to CO2, NH3 and NO2 in the last step as in Scheme 1. Based on the obtained results from UV–Vis spectra and Chemical Oxygen Demand (COD) analysis, hence, we were significantly able to recognize the latter compounds that produced from the photodegradation system such as CO2, NH3 and NO2. As observed, the decrease in the recorded pH values through photodegradation stages along irradiation time from initial pH 6 to 4.3, that to confirm the degradation of MNZ molecules to produce some acids as Maleic acid, Oxalic acid and Oxamic acid which also decomposed by attack hydroxyl to water, NH3 and CO2. Finally, structural changes were determined for MNZ during the adsorption and photodegradation processes according to the UV-Vis and GC-MS spectrum in addition to measuring NH3, NO2 and COD concentrations. Consequently, these results strongly confirm that the degradation of MNZ solution is significantly ascribed to the photocatalytic degradation rather than the adsorption of MNZ onto MgO NP.15,16,73
 |
Scheme 1 Proposed degradation mechanism of MNZ by MgO NP. |
 |
Figure 12 GC chromatograms in GC-Mass analysis of MNZ solution before (A) and after (B) photodegradation process by MgO NP (C) Typical mass spectrum of the fragment appeared at a retention time of 34.4 min; Condition: (MgO NP: 0.1 g/L, [MNZ]o: 80±0.02 mg/L, pH 6, Stirring: 300 rpm and Temp. 30±2°C). |
Toxicity Assessment and Reusability Results
Toxicity Evaluation of Treated and Un-Treated MNZ Molecule
Once photocatalytic degradation of MNZ molecules occurred, the oxidative and reductive processes are concerned with electrons/holes pairs and •OH radical to produce different intermediate fragments of MNZ degraded, as well as these intermediates may be greater toxic than the MNZ molecule. Consequently, under applied conditions, it is necessary to appraise the toxicity of MNZ after the current treatment technique to decide the efficiency of the photodegradation process. Based on toxicity tests such as heamolytic and brine shrimp assay that applied to evaluate the detoxification effect for different concentrations of MNZ solution before and after treatment operations as listed in Table 6. For heamolytic assay, the obtained results indicated the decrease in cytotoxicity up to 88.21% (20 mg/L MNZ initial concentration), 79.84% (60 mg/L), and 67.32% (100 mg/L). Also, the brine shrimp assay revealed a sufficient reduction in cytotoxicity as in Table 6. For 20 mg/L, 60 mg/L, and 100 mg/L MNZ initial concentrations, the mortality rate of the brine shrimp nauplii before treatment was estimated at 52.2%, 55.81% and 61.23%, while the death rate decreased significantly after the degradation process up to 22.21%, 26.8%, and 34.37%, respectively. Consequently, the toxicological evaluation indicated that the toxicity rate of the MNZ molecule and its intermediates had reduced considerably after the photodegradation process in the presence of MgO NP, and this was demonstrated by heamolytic and brine shrimp tests.37,38
 |
Table 6 Toxicity Assays of Treated and Untreated MNZ Molecule |
The Reusability Study
It is necessary to investigate the environmental and economic feasibility while re-using synthetic photocatalysts without a significant reduction in its activity. Therefore, the MgO NP was recycled in four consecutive runs to monitor its efficiency through the photocatalytic process under applied pre-conditions. Based on the characteristics of the catalyst, MgO NP was dried after each run at 100°C for 15 min and then reused in the next run (repeated three times) to remove the adsorbed MNZ molecules on the catalyst. As mentioned in the previous studies, a decrease in the photoactivity of the catalysts during consecutive use was ascribed to reuse catalysts at high temperatures. Figure 13A represents the kinetic results of the reusing study of the catalyst in the batch experiments of the photodegradation of MNZ molecules in four consecutive runs. The mean values for the MNZ photodegradation rate constants (kap) can be determined from the slopes of the linear plots between ln(Ct/Co) vs irradiation time as in Figure 13B. According to the obtained results of triplicate measurements for kap values in successive photodegradation runs (0.0135± 0.002, 0.0136± 0.003, 0.0137± 0.005, and 0.0138± 0.007 min−1) were determined for the first to fourth runs, respectively. A comparison between the obtained kap values in the first and fourth runs was carried out by the statistical analysis of “t-test”. Consequently, the results suggested that the rate constants obtained after four reusing runs of the MNZ photodegradation are not significantly different on the basis of the experimental t-value is less than the critical value of the t-test data calculated. The adsorption of MNZ molecules on the catalyst and existence of intermediates may lead to a slight decrease in the activity during successive four runs. Figure 13C indicates there is a slight decrease in the efficiency of 2.1% (93.2–91.1%) after the fourth run of photodegradation; even so, the final efficiency is satisfactory for the degradation activity by using MgO NP. Therefore, the obtained results suggest an appropriate activity for the recycled catalyst after the fourth run and the possibility of applying it for its economic viability.15,50,51
 |
Figure 13 (A) The results obtained in the reusing experiments of the MNZ molecules photodegradation during 4 reusing runs; (B) plot of ln(Ct/Co) versus reaction time; (C) the efficiency percent of the degradation of MNZ solution by MgO NP for the results obtained in case (A) ([MNZ]o: 80±0.02 mg/L, MgO NP: 0.1 g/L, stirring 300 rpm at pH 6). |
Cost Study
Egyptian magnesite ore (43.32% MgO) is spread in the Eastern Desert as raw material with low cost; moreover, the real cost of collection, transportation, and processing to reuse as a typical adsorbent or catalyst would equalize about 80 USD/ton. Comparing the eco-feasibility study of MgO with other photocatalysts for wastewater treatment, the chemical processing of available catalyst to prepare nanoparticles may lead to a cost increase of about 6 times while commercial Titania is about 300 times more expensive than MgO NP. Recently, large amounts of environmental waste from Metronidazole molecules have been observed in their various forms due to their ease of use of food additives for livestock and fish farms in developing countries. The proposed method gives a useful economic feature over commercial photocatalysts and other modified adsorbents.
Conclusion
The synthesized MgO NP was characterized and applied for the adsorption and photocatalytic activity of MNZ from aqueous solution as a function of initial pH, MgO NP dose, contact time, temperature, and concentration of MNZ. XRD results indicated the mean crystallite sizes of MgO NP are about 22.33 nm and 36.38 nm by Williamson-Hall and Scherrer equations, respectively. This change in crystallite size can be ascribed to the coincident influences of the crystalline size and the expansion of strain. The maximum adsorption capacity of MgO NP was 30.52 mg/g at optimum state of pH 6, MgO NP amount 0.1 g, contact time 180 min, 30±2°C, and 80 mg/L initial MNZ concentration and also the applied preconditions were appropriate to the best degradation yield (93.2%). The MNZ adsorption onto MgO NP followed Langmuir, as well as thermodynamics studies revealed the endothermic type and non-spontaneous adsorption nature of MNZ molecules. Reduction of the initial pH of the solution from 6 to 4.3 during 180 min photocatalytic process demonstrates degradation of MNZ molecules to intermediates of acids as maleic acid, oxalic acid and oxamic acid which also decomposed by attack hydroxyl to water, NH3 and CO2. UV-Vis spectra for the photodegradation process indicated that change in the intensity at 220 nm is ascribed to the existence of the nitro group and nitrogen atom after degradation of MNZ molecules to nitrite ion. Results revealed that a comparison of adsorption and photodegradation performance of MgO NP indicates that the degradation of MNZ molecules significantly tends to its photocatalytic activity more than adsorption efficiency. Based on the obtained results of the photodegradation rate (kap) of MNZ molecules on the MgO NP during irradiation time 180 min, we suggest that this catalyst immobilizes onto glass or polymer for application in photodegradation of other organic pollutants in visible light.
Acknowledgments
Both authors would like to thank the staff of Central Laboratory for Environmental Quality Monitoring for their cooperation during measurements for providing necessary facilities to accomplish the work. Special thanks devoted to Central Laboratory for Tanta University to support present research and the required devices.
Disclosure
Sabah Ibrahim reports grants, personal fees, and non-financial support from Sabah, outside the submitted work. The authors report no other potential conflicts of interest for this work.
References
1. Felis E, Kalka J, Sochacki A, et al. Antimicrobial pharmaceuticals in the aquatic environment – occurrence and environmental implications. Eur J Pharmacol. 2019;866:172813. doi:10.1016/j.ejphar.2019.172813
2. Le Corre KS, Ort C, Kateley D, Allen B, Escher BI, Keller J. Consumption-based approach for assessing the contribution of hospitals towards the load of pharmaceutical residues in municipal wastewater. Environ Int. 2012;45:99–111. doi:10.1016/j.envint.2012.03.008
3. Manyi-Loh C, Mamphweli S, Meyer E, Okoh A. Antibiotic use in agriculture and its consequential resistance in environmental sources: potential public health implications. Molecules. 2018;23(4):795. doi:10.3390/molecules23040795
4. Landers TF, Cohen B, Wittum TE, Larson EL. A review of antibiotic use in food animals: perspective, policy, and potential. Public Health Rep. 2012;127(1):4–22. doi:10.1177/003335491212700103
5. Martin MJ, Thottathil SE, Newman TB. Antibiotics overuse in animal agriculture: a call to action for health care providers. Am J Public Health. 2015;105(12):2409–2410. doi:10.2105/ajph.2015.302870
6. Arnold KE, Boxall ABA, Brown AR, et al. Assessing the exposure risk and impacts of pharmaceuticals in the environment on individuals and ecosystems. Biol Lett. 2013;9(4):20130492. doi:10.1098/rsbl.2013.0492
7. Abbas G, Javed I, Iqbal M, Haider R, Fida Hussain F, Qureshi N. Adsorption of non-steroidal anti-inflammatory drugs (diclofenac and ibuprofen) from aqueous medium onto activated onion skin. Desalin Water Treat. 2017;95:274–285. doi:10.5004/dwt.2017.21465
8. González-Pleiter M, Gonzalo S, Rodea-Palomares I, et al. Toxicity of five antibiotics and their mixtures towards photosynthetic aquatic organisms: implications for environmental risk assessment. Water Res. 2013;47(6):2050–2064. doi:10.1016/j.watres.2013.01.020
9. Watkinson AJ, Murby EJ, Kolpin DW, Costanzo SD. The occurrence of antibiotics in an urban watershed: from wastewater to drinking water. Sci Total Environ. 2009;407(8):2711–2723. doi:10.1016/j.scitotenv.2008.11.059
10. Sarmah AK, Meyer MT, Boxall ABA. A global perspective on the use, sales, exposure pathways, occurrence, fate and effects of veterinary antibiotics (VAs) in the environment. Chemosphere. 2006;65(5):725–759. doi:10.1016/j.chemosphere.2006.03.026
11. Schwartz T, Kohnen W, Jansen B, Obst U. Detection of antibiotic-resistant bacteria and their resistance genes in wastewater, surface water, and drinking water biofilms. FEMS Microbiol Ecol. 2003;43:325–335. doi:10.1111/j.1574-6941.2003.tb01073.x
12. Sacher F, Lang FT, Brauch HJ, Blankenhorn I. Pharmaceuticals in groundwaters: analytical methods and results of a monitoring program in Baden-Wurttemberg, Germany. J Chromatogr A. 2001;938(1–2):199–210. doi:10.1016/s0021-9673(01)01266-3
13. Lindsey ME, Meyer M, Thurman EM. Analysis of trace levels of sulfonamide and tetracycline antimicrobials, in groundwater and surface water using solid-phase extraction and liquid chromatography/mass spectrometry. Anal Chem. 2001;73(19):4640–4646. doi:10.1021/ac010514w
14. Hanna N, Sun P, Sun Q, et al. Presence of antibiotic residues in various environmental compartments of Shandong province in eastern China: its potential for resistance development and ecological and human risk. Environ Int. 2018;114:131–142. doi:10.1016/j.envint.2018.02.003
15. Derikvandi H, Nezamzadeh-Ejhieh A. Synergistic effect of p-n heterojunction, supporting and zeolite nanoparticles in enhanced photocatalytic activity of NiO and SnO2. J Colloid Interface Sci. 2017;490:314–327. doi:10.1016/j.jcis.2016.11.069
16. Ammar HB, Brahim MB, Abdelhédi R, Samet Y. Green electrochemical process for metronidazole degradation at BDD anode in aqueous solutions via direct and indirect oxidation. Sep Purif Technol. 2016;157:9–16. doi:10.1016/j.seppur.2015.11.027
17. Heta S, Robo I. The side effects of the most commonly used group of antibiotics in periodontal treatments. Med Sci. 2018;6(1):6. doi:10.3390/medsci6010006
18. Ternes TA, Meisenheimer M, Mcdowell D, et al. Removal of pharmaceuticals during drinking water treatment. Environ Sci Technol. 2002;36:3855–3863. doi:10.1021/es015757k
19. Fang Z, Chen J, Qiu X, Qiu X, Cheng W, Zhu L. Effective removal of antibiotic metronidazole from water by nanoscale zero-valent iron particles. Desalination. 2011;268:60–67. doi:10.1016/j.desal.2010.09.051
20. Nasseh N, Barikbin B, Taghavi L, Nasseri MA. Adsorption of metronidazole antibiotic using a new magnetic nanocomposite from simulated wastewater (isotherm, kinetic and thermodynamic studies). Compos B Eng. 2018;159:146–156. doi:10.1016/j.compositesb.2018.09.034
21. Ramavandi B, Akbarzadeh S. Removal of metronidazole antibiotic from contaminated water using a coagulant extracted from Plantago ovata. Desalin Water Treat. 2014;55(8):2221–2228. doi:10.1080/19443994.2014.928909
22. Honrmandrad Z, Asadipour A, Malakootian M. Investigating the use of ozonation process with calcium peroxide for the removal of metronidazole antibiotic from aqueous solutions. Desalin Water Treat. 2017;77:315–320. doi:10.5004/dwt.2017.20764
23. Nadour M, Boukraa F, Benaboura A. Removal of diclofenac, paracetamol and metronidazole using a carbon-polymeric membrane. J Environ Chem Eng. 2019;7:103080. doi:10.1016/j.jece.2019.103080
24. Nezamzadeh-Ejhieh A, Hushmandrad S. Solar photodecolorization of methylene blue by CuO/X zeolite as a heterogeneous catalyst. Appl Catal A-Gen. 2010;388(1–2):149–159. doi:10.1016/j.apcata.2010.08.042
25. Nosuhi M, Nezamzadeh-Ejhieh A. High catalytic activity of Fe(II)-clinoptilolite nanoparticles for indirect voltammetric determination of dichromate: experimental design by response surface methodology (RSM). Electrochim Acta. 2017;223:47–62. doi:10.1016/j.electacta.2016.12.011
26. Farzadkia M, Esrafili A, Baghapour MA, Shahamat YD, Okhovat N. Degradation of metronidazole in aqueous solution by nano-ZnO/UV photocatalytic process. Desalin Water Treat. 2014;52:4947–4952. doi:10.1080/19443994.2013.810322
27. Konstas PS, Kosma C, Konstantinou I, Albanis T. Photocatalytic treatment of pharmaceuticals in real hospital wastewaters for effluent quality amelioration. Water. 2019;11:2165. doi:10.3390/w11102165
28. Ben-Moshe T, Dror I, Berkowitz B. Oxidation of organic pollutants in aqueous solutions by nanosized copper oxide catalysts. Appl Catal B Environ. 2009;85:207–211. doi:10.1016/j.apcatb.2008.07.020
29. Kalidhasan S, Dror I, Berkowitz B. Atrazine degradation through PEI-copper nanoparticles deposited onto montmorillonite and sand. Sci Rep. 2017;7:1415–1427. doi:10.1038/s41598-017-01429-5
30. Sarkar B, Mandal S, Tsang YF, Kumar YF, Kim KH, Ok YS. Designer carbon nanotubes for contaminant removal in water and wastewater: a critical review. Sci Total Environ. 2018;612:561–581. doi:10.1016/j.scitotenv.2017.08.132
31. Wang Y, Pan C, Chu W, Vipin AK, Sun L. Environmental remediation applications of carbon nanotubes and graphene oxide: adsorption and catalysis. Nanomater. 2019;9:439–464. doi:10.3390/nano9030439
32. Gomathi Devi L, Murthy BN, Girish Kumar S. Heterogeneous photocatalytic degradation of anionic and cationic dyes over TiO2 and TiO2 doped with MO6+ ions under solar light: correlation of dye structure and its adsorptive tendency on the degradation rate. Chemosphere. 2009;76:1163–1166. doi:10.1016/j.chemosphere.2009.04.005
33. Camtakan Z, Erenturk SA, Yusan SD. Magnesium oxide nanoparticles: preparation, characterization, and uranium sorption properties. Environ Prog Sustain Energy. 2011;31:536–543. doi:10.1002/ep.10575
34. Karthik K, Dhanuskodi S, Gobinath C, Prabukumar S, Sivaramakrishnan S. Fabrication of MgO nanostructures and its efficient photocatalytic, antibacterial and anticancer performance. J Photochem Photobiol B. 2019;190:8–20. doi:10.1016/j.jphotobiol.2018.11.001
35. Jung HS, Lee JK, Kim JY, Hong KS. Crystallization behaviors of nanosized MgO particles from magnesium alkoxides. J Colloid Interface Sci. 2003;259(1):127–132. doi:10.1016/S0021-9797(03)00034-1
36. Wong CW, Chan YS, Jeevanandam J, et al. Response surface methodology optimization of mono-dispersed MgO nanoparticles fabricated by ultrasonic-assisted Sol–Gel method for outstanding antimicrobial and antibiofilm activities. J Clust Sci. 2020;31:367–389. doi:10.1007/s10876-019-01651-3
37. Iqbal M, Nisar J. Cytotoxicity and mutagenicity evaluation of gamma radiation and hydrogen peroxide treated textile effluents using bioassays. J Environ Chem Eng. 2015;3(3):1912–1917. doi:10.1016/j.jece.2015.06.011
38. Shahab-ud-Din AMZ, Qureshi K, Bhatti IA, et al. Hydrothermal synthesis of molybdenum trioxide, characterization and photocatalytic activity. Mater Res Bull. 2018;100:120–130. doi:10.1016/j.materresbull.2017.11.044
39. El-Sayyad GS, Mosallam FM, El-Batal AI. One-pot green synthesis of magnesium oxide nanoparticles using Penicillium chrysogenum melanin pigment and gamma rays with antimicrobial activity against multidrug-resistant microbes. Adv Powder Technol. 2018;29(11):2616–2625. doi:10.1016/j.apt.2018.07.009
40. Tamiji T, Nezamzadeh-Ejhieh A. Study of kinetics aspects of the electrocatalytic oxidation of benzyl alcohol in aqueous solution on AgBr modified carbon paste electrode. Mater Chem Phys. 2019;237:121813. doi:10.1016/j.matchemphys.2019.121813
41. Omrani N, Nezamzadeh-Ejhieh A. A novel quadripartite Cu2O-CdS-BiVO4-WO3 visible-light driven photocatalyst: brief characterization and study the kinetic of the photodegradation and mineralization of sulfasalazine. J Photoch Photobio A. 2020;400:112726. doi:10.1016/j.jphotochem.2020.112726
42. Aly KA, Khalil NM, Algamal Y, Saleem QMA. Estimation of lattice strain for zirconia nano-particles based on Williamson-Hall analysis. Mater Chem Phys. 2017;193:182–188. doi:10.1016/j.matchemphys.2017.01.059
43. Umaralikhan L, Jamal Mohamed Jaffar M. Green synthesis of MgO nanoparticles and it antibacterial activity. Iran J Sci Technol Trans Sci. 2016;42(2):477–485. doi:10.1007/s40995-016-0041-8
44. Wan Isahak WNR, Ramli ZAC, Mohamed Hisham MW, Yarmo MA. Magnesium oxide nanoparticles on green activated carbon as efficient CO2 adsorbent. AIP Conf Proc. 2014;1571:882–889. doi:10.1063/1.4858766
45. Sutradhar N, Sinhamahapatra A, Pahari SK, et al. Controlled synthesis of different morphologies of MgO and their use as solid base catalysts. J Phys Chem C. 2011;115(25):12308–12316. doi:10.1021/jp2022314
46. Ungár T, Tichy G, Gubicza J, Hellmig RJ. Correlation between subgrains and coherently scattering domains. Powder Diffr. 2005;20(4):366–375. doi:10.1154/1.2135313
47. Omrani N, Nezamzadeh-Ejhieh A. Focus on scavengers’ effects and GC-MASS analysis of photodegradation intermediates of sulfasalazine by Cu2O/CdS nanocomposite. Sep Purif Technol. 2020;235:116228. doi:10.1016/j.seppur.2019.116228
48. Noreen S, Khalid U, Ibrahim SM, et al. ZnO, MgO and FeO adsorption efficiencies for direct sky Blue dye: equilibrium, kinetics and thermodynamics studies. J Mater Res Technol. 2020;9(3):5881–5893. doi:10.1016/j.jmrt.2020.03.115
49. Jafari S, Nezamzadeh-Ejhieh A. Supporting of coupled silver halides onto clinoptilolite nanoparticles as simple method for increasing their photocatalytic activity in heterogeneous photodegradation of mixture of 4-methoxy aniline and 4-chloro-3-nitro aniline. J Colloid Interface Sci. 2017;490:478–487. doi:10.1016/j.jcis.2016.11.087
50. Pourtaheri A, Nezamzadeh-Ejhieh A. Enhancement in photocatalytic activity of NiO by supporting onto an Iranian clinoptilolite nano-particles of aqueous solution of cefuroxime pharmaceutical capsule. Spectrochim Acta A. 2015;137:338–344. doi:10.1016/j.saa.2014.08.058
51. Ajoudanian N, Nezamzadeh-Ejhieh A. Enhanced photocatalytic activity of nickel oxide supported on clinoptilolite nanoparticles for the photodegradation of aqueous cephalexin. Mater Sci Semicond Process. 2015;36:162–169. doi:10.1016/j.mssp.2015.03.042
52. Omrani N, Nezamzadeh-Ejhieh A, Alizadeh M. Brief study on the kinetic aspect of photodegradation of sulfasalazine aqueous solution by cuprous oxide/cadmium sulfide nanoparticles. Desalin Water Treat. 2019;162:290–302. doi:10.5004/dwt.2019.24352
53. Shams-Ghahfarokhi Z, Nezamzadeh-Ejhieh A. As-synthesized ZSM-5 zeolite as a suitable support for increasing the photoactivity of semiconductors in a typical photodegradation process. Mater Sci Semicond Proc. 2015;39:265–275. doi:10.1016/j.mssp.2015.05.022
54. Nezamzadeh-Ejhieh A, Ghanbari-Mobarakeh Z. Heterogeneous photodegradation of 2,4-dichlorophenol using FeO doped onto nano-particles of zeolite P. J Ind Eng Chem. 2015;21:668–676. doi:10.1016/j.jiec.2014.03.035
55. Ghasemi Z, Younesi H, Zinatizadeh AA. Kinetics and thermodynamics of photocatalytic degradation of organic pollutants in petroleum refinery wastewater over nano-TiO2 supported on Fe-ZSM-5. J Taiwan Inst Chem Eng. 2016;65:357–366. doi:10.1016/j.jtice.2016.05.039
56. Li H, Zhang D, Han X, Xing B. Adsorption of antibiotic cipro-floxacin on carbon nanotubes: pH dependence and thermodynamics. Chemosphere. 2014;95:150. doi:10.1016/j.chemosphere.2013.08.053
57. Kariim I, Abdulkareem AS, Abubakre OK. Development and characterization of MWCNTs from activated carbon as adsorbent for metronidazole and levofloxacin sorption from pharmaceutical wastewater: kinetics, isotherms and thermodynamic studies. Sci Afr. 2019;7:e00242. doi:10.1016/j.sciaf.2019.e00242
58. Naeem K, Weiqian P, Ouyang F. Thermodynamic parameters of activation for photodegradation of phenolics. Chem Eng J. 2010;156:505–509. doi:10.1016/j.cej.2009.10.026
59. Barakat NAM, Kanjwal MA, Chronakis IS, Kim HY. Influence of temperature on the photodegradation process using Ag-doped TiO2 nanostructures: negative impact with the nanofibers. J Mol Catal a Chem. 2013;366:333–340. doi:10.1016/j.molcata.2012.10.012
60. Qureshi K, Ahmad MZ, Bhatti IA, Zahid M, Nisar J, Iqbal M. Graphene oxide decorated ZnWO4 architectures synthesis, characterization and photocatalytic activity evaluation. J Mol Liq. 2019;285:778–789. doi:10.1016/j.molliq.2019.04.13
61. Farzadkia M, Bazrafshan E, Esrafili A, Yang JK, Shirzad-Siboni M. Photocatalytic degradation of Metronidazole with illuminated TiO2 nanoparticles. J Environ Health Sci Eng. 2015;13:1. doi:10.1186/s40201-015-0194-y
62. Shirzadi H, Nezamzadeh-Ejhieh A. An efficient modified zeolite for simultaneous removal of Pb(II) and Hg(II) from aqueous solution. J Mol Liq. 2017;230:221–229. doi:10.1016/j.molliq.2017.01.029
63. Heidari-Chaleshtori M, Nezamzadeh-Ejhieh A. Clinoptilolite nano-particles modified with aspartic acid for removal of Cu(ii) from aqueous solutions: isotherms and kinetic aspects. New J Chem. 2015;39(12):9396–9406. doi:10.1039/c5nj01631b
64. Nezamzadeh-Ejhieh A, Kabiri-Samani M. Effective removal of Ni(II) from Aqueous solutions by modification of nano particles of clinoptilolite with dimethylglyoxime. J Hazard Mater. 2013;260:339–349. doi:10.1016/j.jhazmat.2013.05.014
65. Anari-Anaraki M, Nezamzadeh-Ejhieh A. Modification of an Iranian clinoptilolite nano-particles by hexadecyltrimethyl ammonium cationic surfactant and dithizone for removal of Pb(II) from aqueous solution. J Colloid Interface Sci. 2015;440:272–281. doi:10.1016/j.jcis.2014.11.017
66. Nasiri-Ardali M, Nezamzadeh-Ejhieh A. A comprehensive study on the kinetics and thermodynamic aspects of batch and column removal of Pb(II) by the clinoptilolite–glycine adsorbent. Mater Chem Phys. 2020;240:122142. doi:10.1016/j.matchemphys.2019.122142
67. Sathishkumar P, Arulkumar M, Ashokkumar V, et al. Modified phyto-waste Terminalia catappa fruit shells: a reusable adsorbent for the removal of micropollutant diclofenac. RSC Adv. 2015;5:30950–30962. doi:10.1039/c4ra11786g
68. Ng JCY, Cheung WH, McKay G. Equilibrium studies of the sorption of Cu(II) ions onto chitosan. J Colloid Interface Sci. 2002;255:64–74. doi:10.1006/jcis.2002.8664
69. Benzaoui T, Selatnia A, Djabali D. Adsorption of copper (II) ions from aqueous solution using bottom ash of expired drugs incineration. Adsorpt Sci Technol. 2017;36(1–2):114–129. doi:10.1177/0263617416685099
70. Ahmad MZ, Bhatti IA, Qureshi K, et al. Graphene oxide supported Fe2(MoO4)3 nano rods assembled round-ball fabrication via hydrothermal route and photocatalytic degradation of nonsteroidal anti-inflammatory drug. J Mol Liq. 2019;301:112343. doi:10.1016/j.molliq.2019.112343
71. Mehrotra K, Yablonsky GS, Ray AK. Kinetic studies of photocatalytic degradation in a TiO2 slurry system: distinguishing working regimes and determining rate dependences. Ind Eng Chem Res. 2003;42:2273–2281. doi:10.1021/ie0209881
72. Melián EP, Díaz OG, Araña J, Rodríguez JMD, Rendón ET, Melián JAH. Kinetics and adsorption comparative study on the photocatalytic degradation of o-, m- and p-cresol. Catal Today. 2007;129:256–262. doi:10.1016/j.cattod.2007.08.003
73. Fang Z, Qiu X, Chen J, Qiu X. Degradation of metronidazole by nanoscale zero-valent metal prepared from steel pickling waste liquor. Appl Catal B-Environ. 2010;100(1–2):221–228. doi:10.1016/j.apcatb.2010.07.035
 © 2020 The Author(s). This work is published and licensed by Dove Medical Press Limited. The
full terms of this license are available at https://www.dovepress.com/terms
and incorporate the Creative Commons Attribution
- Non Commercial (unported, 3.0) License.
By accessing the work you hereby accept the Terms. Non-commercial uses of the work are permitted
without any further permission from Dove Medical Press Limited, provided the work is properly
attributed. For permission for commercial use of this work, please see paragraphs 4.2 and 5 of our Terms.
© 2020 The Author(s). This work is published and licensed by Dove Medical Press Limited. The
full terms of this license are available at https://www.dovepress.com/terms
and incorporate the Creative Commons Attribution
- Non Commercial (unported, 3.0) License.
By accessing the work you hereby accept the Terms. Non-commercial uses of the work are permitted
without any further permission from Dove Medical Press Limited, provided the work is properly
attributed. For permission for commercial use of this work, please see paragraphs 4.2 and 5 of our Terms.