Back to Journals » International Journal of Chronic Obstructive Pulmonary Disease » Volume 11 » Issue 1
Differences in the effects of Asian dust on pulmonary function between adult patients with asthma and those with asthma–chronic obstructive pulmonary disease overlap syndrome
Authors Watanabe M, Noma H, Kurai J, Sano H, Ueda Y, Mikami M, Yamamoto H, Tokuyasu H, Kato K, Konishi T, Tatsukawa T, Shimizu E, Kitano H
Received 30 September 2015
Accepted for publication 10 December 2015
Published 28 January 2016 Volume 2016:11(1) Pages 183—190
DOI https://doi.org/10.2147/COPD.S97460
Checked for plagiarism Yes
Review by Single anonymous peer review
Peer reviewer comments 2
Editor who approved publication: Prof. Dr. Richard Russell
Masanari Watanabe,1 Hisashi Noma,2 Jun Kurai,1 Hiroyuki Sano,3 Yasuto Ueda,1 Masaaki Mikami,4 Hiroyuki Yamamoto,5 Hirokazu Tokuyasu,6 Kazuhiro Kato,7 Tatsuya Konishi,8 Toshiyuki Tatsukawa,8 Eiji Shimizu,1 Hiroya Kitano9
1Department of Respiratory Medicine and Rheumatology, Tottori University Faculty of Medicine, 36-1 Nishi-cho, Yonago, 2Department of Data Science, The Institute of Statistical Mathematics, 10-3 Midori-cho, Tachikawa, Tokyo, 3Department of Respiratory Medicine and Allergology, Kinki University Faculty of Medicine, 377-2 Ohnohigashi, Osakasayama, 4Hosshoji Clinic, 286-4 Hosshoji, Saihaku, 5Saihaku Hospital, 397 Yamato, Saihaku, 6Department of Respiratory Medicine, Matsue Red Cross Hospital, 200 Horomachi, Matsue, 7Department of Respiratory Medicine, San-in Rosai Hospital, 1-8-1 Kaikeshinden, Yonago, 8Department of Respiratory Medicine, Matsue City Hospital, 32-1 Noshirachou, Matsue, 9The Board of Directors, Tottori University, 36-1 Nishi-cho, Yonago, Japan
Background: Asian dust (AD) exposure exacerbates pulmonary dysfunction in patients with asthma. Asthma–chronic obstructive pulmonary disease overlap syndrome (ACOS), characterized by coexisting symptoms of asthma and chronic obstructive pulmonary disease, is considered a separate disease entity. Previously, we investigated the effects of AD on pulmonary function in adult patients with asthma. Here, we present the findings of our further research on the differences in the effects of AD exposure on pulmonary function between patients with asthma alone and those with ACOS.
Methods: Between March and May 2012, we conducted a panel study wherein we monitored daily peak expiratory flow (PEF) values in 231 adult patients with asthma. These patients were divided into 190 patients with asthma alone and 41 patients with ACOS in this study. Daily AD particle levels were measured using light detection and ranging systems. Two heavy AD days (April 23 and 24) were determined according to the Japan Meteorological Agency definition. A linear mixed model was used to estimate the association between PEF and AD exposure.
Results: Increments in the interquartile range of AD particles (0.018 km-1) led to PEF changes of –0.50 L/min (95% confidence interval, –0.98 to –0.02) in patients with asthma alone and –0.11 L/min (–0.11 to 0.85) in patients with ACOS. The PEF changes after exposure to heavy AD were –2.21 L/min (–4.28 to –0.15) in patients with asthma alone and –2.76 L/min (–6.86 to 1.35) in patients with ACOS. In patients with asthma alone, the highest decrease in PEF values was observed on the heavy AD day, with a subsequent gradual increase over time.
Conclusion: Our results suggest that the effects of AD exposure on pulmonary function differ between patients with asthma alone and ACOS, with the former exhibiting a greater likelihood of decreased pulmonary function after AD exposure.
Keywords: Asian dust, asthma, asthma–chronic obstructive pulmonary disease overlap syndrome, peak expiratory flow, pulmonary function
Introduction
Asian dust (AD), called also yellow dust, originates in East Asia deserts and is the second largest sand dust emission in the world.1 Therefore, AD transports a large amount of particulate matter to East Asia. Over the last decade, AD has become a serious problem because it contains several industrial pollutants emitted by the rapidly expanding industries and the increasing number of cars on the roads in East Asia.2–7 Numerous studies have shown that ADS is associated with hospital visits and admission, cardiovascular onset and mortality, and cerebrovascular and pulmonary disease. AD aggravates mortality and increases the requirement for emergency treatment and hospitalization for cardiovascular disease and pulmonary disease.8–11 In particular, AD exposure is associated with exacerbation of asthma. In children with asthma, South Korean studies showed that AD is associated with an increase in acute respiratory symptoms and changes in the peak expiratory flow (PEF).12,13 AD can also increase the risk of hospital visits for exacerbation of asthma.14 Both Kanatani et al15 and Ueda et al16 reported that AD was associated with an increased risk of hospitalization in children with asthma. Our previous studies also demonstrated that AD could aggravate lower respiratory symptoms and pulmonary function in adult patients with asthma.17,18 The interesting aspect is that the effects of AD on asthma occur over several days after the exposure.
In the spectrum of chronic airway diseases, asthma and chronic obstructive pulmonary disease (COPD) are common and highly prevalent in the general population. Although both asthma and COPD exhibit variable degrees of airway inflammation, airway obstruction, and airway hyperresponsiveness,19,20 both are different and independent diseases. Several studies have demonstrated differences in inflammatory cell recruitment, mediator production, and therapeutic responses between asthma and COPD.21,22 Airway flow limitation is progressive and mostly irreversible in COPD, whereas it is typically intermittent and reversible in asthma.23 Of late, there is evidence of an increasing number of patients with some coexisting manifestations of asthma and COPD, a condition known as asthma–COPD overlap syndrome (ACOS).24,25 ACOS primarily affects individuals with long-standing asthma, particularly current or former smokers.24 Patients with ACOS exhibit high mortality rates, poorer health-related quality of life, and higher exacerbation rates compared to patients with asthma or COPD alone.24–28 Therefore, we speculate that the effects of AD exposure on pulmonary function differ between patients with asthma and those with ACOS, although few studies have actually investigated these differences.
In 2012, we conducted a panel study to investigate the effects of AD exposure on pulmonary function in adult patients with asthma in western Japan and demonstrated that heavy exposure to AD particles was significantly associated with decreased pulmonary function in this population.18 In this study, we performed subgroup analyses to investigate differences in the effects of AD exposure on pulmonary function between patients with asthma alone and those with ACOS among the 2012 cohort.
Methods
Study design
In our panel study conducted from March to May 2012, we measured daily PEF values in 231 patients with asthma aged >18 years.18 The patients resided in Yonago City, Matsue City, Sakaiminato City, Yasugi City, or Saihaku Town, all of which are located within 25 km of Tottori University Hospital in Yonago City, western Japan. On the basis of the Global Initiative for Asthma (GINA)29 criteria, the patients were diagnosed with asthma if they presented with a history of intermittent wheezing and exhibited airway hyperresponsiveness to methacholine or exhibited reversible airflow limitations (12% and 200 mL variability in the forced expiratory volume in 1 second [FEV1]). If patients had other disorders or dementia, they were exempt from recruitment into the study. When patients were unable to measure pulmonary function and understand the methods of measuring PEF with a peak flow meter (Mini-Wright, Harlow, England, American Thoracic Society scale), they were excluded from recruitment. To study differences in the effects of AD on pulmonary function between adult patients with asthma alone and those with ACOS, we divided the 231 patients into 190 patients with asthma alone and 41 patients with ACOS in the present study. ACOS was clinically diagnosed on the basis of the GINA29 and Global Initiative for Chronic Obstructive Lung Disease (GOLD) guidelines (2014),30 which dedicated a joint chapter to ACOS to underline the clinical importance of this syndrome. Briefly, patients with a previous diagnosis of asthma, a smoking history of at least 10 pack-years, persistent airflow limitations (postbronchodilator FEV1/forced vital capacity [FVC] ratio, <0.7), and respiratory symptoms were diagnosed with ACOS. Diagnoses of allergic rhinitis and chronic sinusitis were made by an otolaryngologist. This study was approved by the institutional ethics committee (Ethics Committee of Tottori University, Approval Number 1656), and all patients provided written informed consent for participation.
Monitoring of air pollutants and definition of a heavy AD day
Concentrations of nitrogen dioxide (NO2), ozone, particulate matter smaller than 2.5 μm (PM2.5), sulfur dioxide (SO2), and suspended particulate matter (SPM) are monitored at many locations in Japan by the Japanese Ministry of the Environment. For this analysis, we collected data for SPM, SO2, and NO2 from the Yonago observatory and collected data for PM2.5 from the Matsue observatory.
Light detection and ranging (LIDAR) systems can measure particulate matter as nonspherical airborne particles, which are equivalent to sand dust particles, and spherical airborne particles, which are equal to air pollution aerosols, by simultaneously illuminating a target with two laser beams of different wavelengths and analyzing the reflected light.31,32 These systems can also measure the amount of AD particles transported for long distances from East Asia to Japan because they are simultaneously applied within <1 km above the ground, and measurements are continuously obtained from various locations in Japan, South Korea, People’s Republic of China, Mongolia, and Thailand.31,32 Accordingly, the levels of nonspherical particles measured by LIDAR measurements are equivalent to the quantity of AD particles. The levels of spherical particles, which consist of organic aerosols, inorganic sulfates, and nitrates, are measured at 15 minutes intervals, and daily particle levels are determined from the median value of 96 measurements collected over a 24 hours period from midnight of one day to midnight of the following day.31,32 For this analysis, LIDAR data for spherical and nonspherical particles were obtained from the Matsue observatory. Values measured at 120–150 m above the ground, which is the minimum altitude required by LIDAR systems to measure nonspherical and spherical particles, were used. LIDAR measurements do not distinguish particles by size and lack defined criteria for heavy AD. Therefore, a heavy AD day was determined according to the information provided by the Japan Meteorological Agency, which was based on a criterion of visibility <10 km due to sand dust arising from the East Asian deserts combined with meteorological satellite data.
Recording of daily PEF values and asthma control test (ACT) scores
From February to May 2012, morning PEF levels were recorded daily by all patients using a peak flow meter. February was used as the trial period. PEF values were measured three times in the morning, before the inhalation of corticosteroids or β2-agonists or consumption of oral drugs. Each patient recorded the best of the three obtained values. Scores for the Japanese version of the Asthma Control Test (ACT-J) were recorded at the end of each month.33
Statistical analysis
The Mann–Whitney U-test and the chi-squared test were used for comparisons between patients with asthma alone and those with ACOS. For evaluating the effects of exposure to AD, AD particle levels detected by LIDAR, and daily average SPM and PM2.5 levels, we adopted linear mixed models, which can appropriately account for correlations among repeated measurements within a subject.34,35 The daily (24 hours) average levels of air pollutants (SO2, NO2, and ozone) and meteorological variables such as daily temperature, humidity, and atmospheric pressure were used. The linear mixed models included a random intercept for subjects for accounting the correlations of repeated measurements and the following covariates were adjusted: individual characteristics (age, sex, smoking, treatment steps, and ACT scores); meteorological variables such as daily temperature, humidity, and atmospheric pressure; and the exposures of interest. Estimates are presented as the absolute change in the PEF value per interquartile range (IQR) change in exposure, with 95% confidence intervals (CIs). We also performed significance tests for assessing the differences in effects between the two strata. To investigate differences in the effects of heavy exposure to AD on PEF according to patient characteristics, we conducted stratified analyses according to the presence/absence of rhinosinusitis and %FEV1 values. The effects of heavy exposure to AD and the postexposure effects on PEF from 0 (heavy AD day) to 5 days after the heavy exposure were also evaluated, considering the effects of dust exposure on PEF can persist for up to 3 days.12 For the statistical analyses, we used SPSS software (Japanese version 22.0 for Windows; SPSS Japan Inc., Tokyo, Japan) and R version 3.0.3 (R Foundation for Statistical Computing, Vienna, Austria); especially for the analyses of linear mixed models, we adopted the lme4 package of R. All quoted P-values are two sided and the significance levels were set at 0.05.
Results
Patient characteristics
The PEF values of all 231 registered patients were recorded daily for >95% of the study period from March to May. The characteristics of patients with asthma alone and those with ACOS are listed in Table 1. A treatment step, maintenance treatment, and pulmonary function tests were performed, and ACT scores were obtained on February 2012. There were significant differences between the two groups with regard to age, sex, smoking status, FEV1, %FEV1, FEV1/FVC, the presence of rhinosinusitis, treatment steps, inhaled corticosteroid dose, and long-acting β2-agonist use. Patients with ACOS were older than those with asthma alone and exhibited poorer pulmonary function and a lower prevalence of rhinosinusitis.
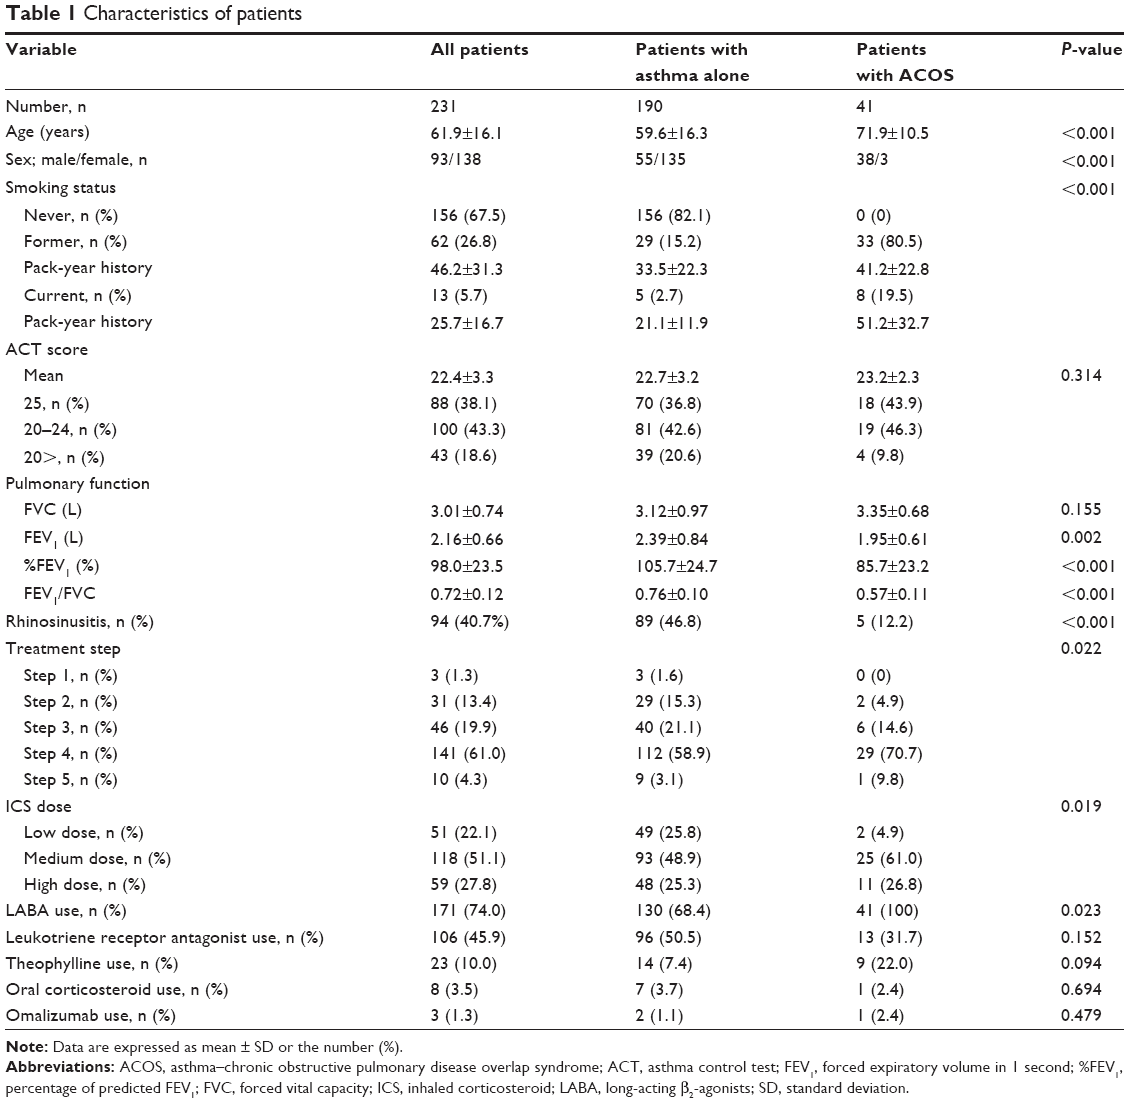 | Table 1 Characteristics of patients |
Levels of AD particles, SPM, and PM2.5
The daily levels of AD particles, SPM, and PM2.5 are shown in Figure 1. Two heavy AD days were identified by the Japan Meteorological Agency, one on April 23 and another on April 24.
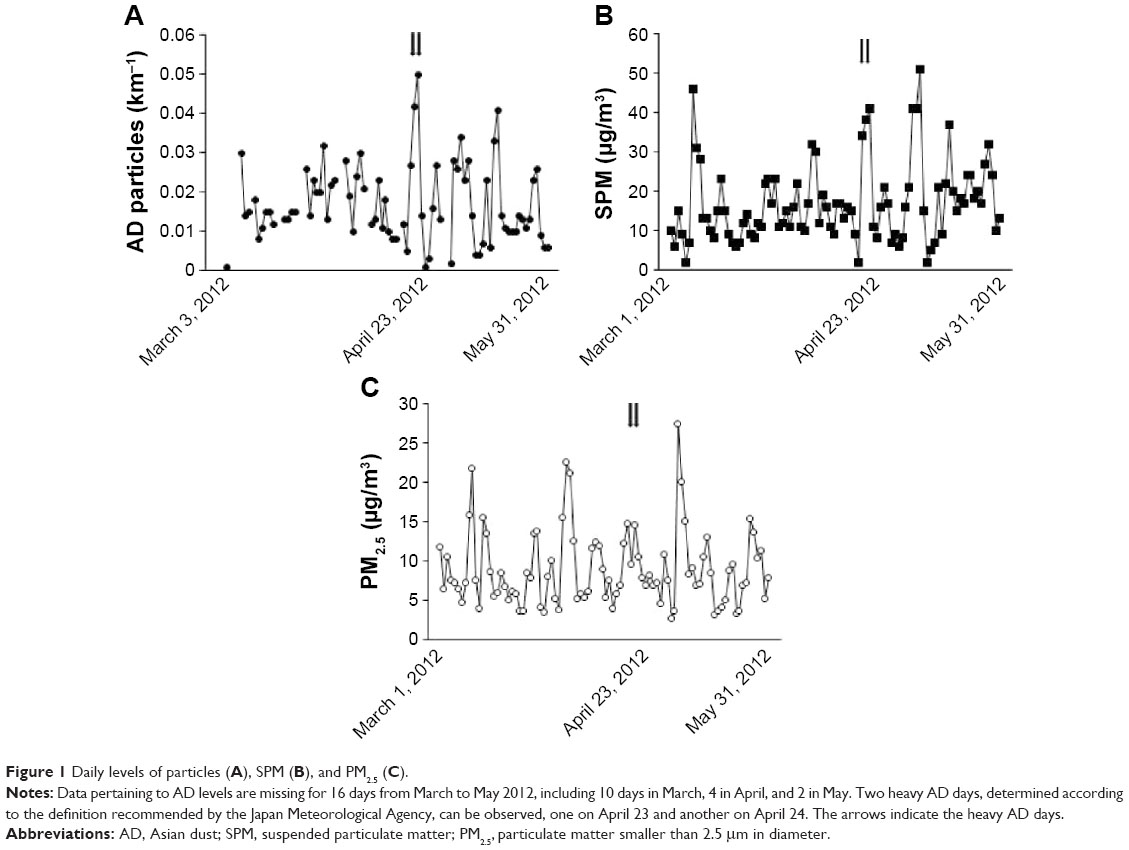 | Figure 1 Daily levels of particles (A), SPM (B), and PM2.5 (C). |
PEF changes
The results of changes in PEF per IQR increase in the levels of AD particles, SPM, and PM2.5 after adjustment for individual characteristics and meteorological variables are listed in Table 2. Patients with asthma alone exhibited a significant association between PEF values and exposure to AD particles and spherical particles, but not between PEF values and exposure to SPM and PM2.5. However, no significant associations were observed for the overall cohort and for patients with ACOS. In addition, there were no significant effect modifications between the two strata (P=0.474, 0.265, and 0.527 for AD particles, SPM, and PM2.5, respectively). Associations between PEF values and heavy exposure to AD are listed in Table 3. There was a significant negative association between heavy exposure to AD and PEF levels in all patients and patients with asthma alone. To facilitate evaluation of the effects of heavy AD exposure on PEF values in all patients and patients with asthma alone, the changes are shown from 0 (heavy AD day; lag 0 days) to 5 days after heavy exposure (lag 0–5 days). The highest decrease was observed on day 0, and the values gradually improved with time. There were also no observed significant effect modifications in these evaluations (eg, P=0.781 for lag 0 day).
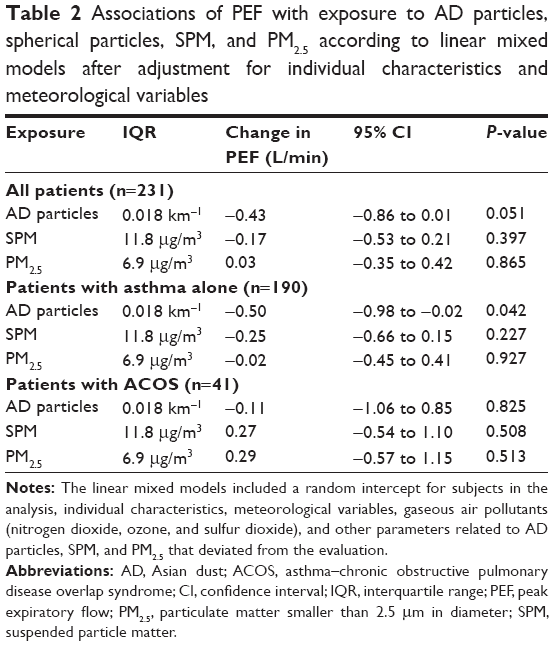 | Table 2 Associations of PEF with exposure to AD particles, spherical particles, SPM, and PM2.5 according to linear mixed models after adjustment for individual characteristics and meteorological variables |
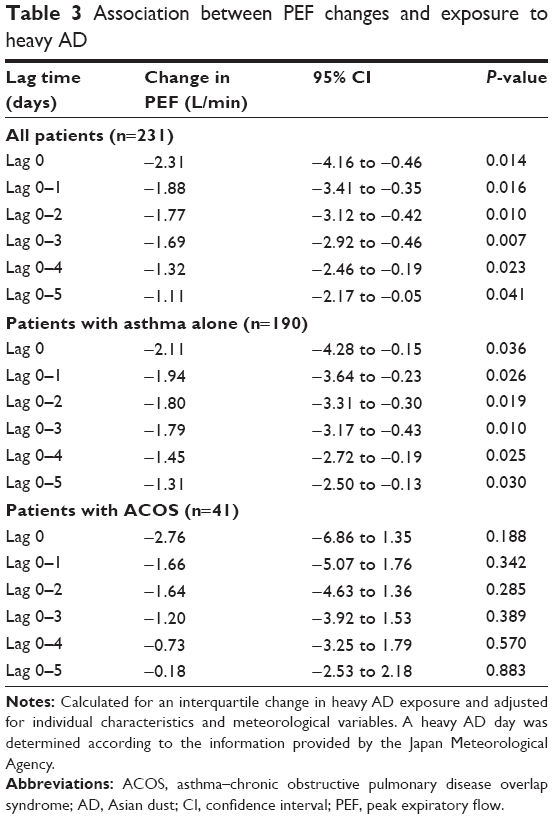 | Table 3 Association between PEF changes and exposure to heavy AD |
Table 4 presents the association between daily PEF levels after heavy AD exposure and patient characteristics; a significant association was observed for patients with rhinosinusitis.
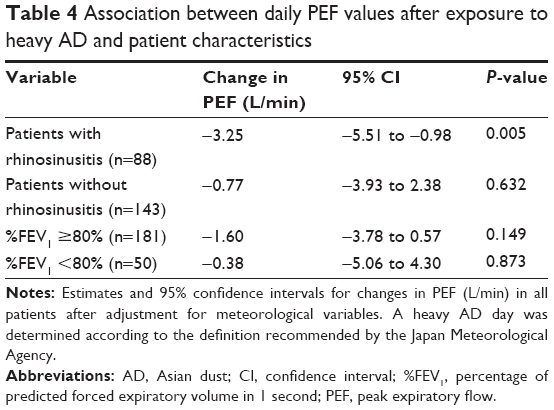 | Table 4 Association between daily PEF values after exposure to heavy AD and patient characteristics |
Discussion
Some studies have shown that exposure to AD is associated with an increased risk of hospitalization and deterioration of pulmonary function and respiratory symptoms in patients with asthma.12–18 ACOS was recently defined as a new entity.29,30 Patients with ACOS are more likely to develop frequent and severe respiratory exacerbations compared to patients with asthma alone.36 However, few studies have demonstrated differences in the effects of AD exposure on pulmonary function between patients with asthma alone and those with ACOS. To the best of our knowledge, this study is the first to compare patients with asthma alone and those with ACOS and specifically link asthma with a greater decrease in pulmonary function after AD exposure. The study also demonstrated that PEF values were associated with daily levels of AD particles, but not with daily levels of SPM and PM2.5, in patients with asthma alone.
ACOS primarily affects elderly patients, particularly smokers, with a long-term history of asthma.24–30 We avoided bias caused by patient characteristics such as age, sex, and smoking history by including a random intercept for subjects in the analysis. In addition, we treated treatment steps and ACT scores as fixed effects. After eliminating this important bias, we found different effects of AD exposure in patients with asthma alone and those with ACOS. The pathophysiology of ACOS is mostly unknown. However, smokers with asthma develop pathological changes similar to those observed in COPD.37,38 Differences in the pathophysiology of asthma and ACOS may have led to the differences observed in our study.
Nasal dysfunction due to concomitant rhinosinusitis in patients with asthma is a risk factor for deterioration.39 In this study, the prevalence of rhinosinusitis was significantly different between patients with asthma alone and those with ACOS, and subgroup analyses revealed that an attenuation of pulmonary function was more likely after heavy AD exposure in patients with rhinosinusitis. Thus, this could have been one of the reasons for the different effects of AD exposure in patients with asthma alone and those with ACOS. Asthma is known to be associated with a high prevalence of rhinosinusitis,39 while ACOS has shown no clear association thus far. Studies on nose–lung interactions and functional complementarity in ACOS may be important to further clarify the effects of AD exposure on pulmonary function in patients with asthma alone and those with ACOS.
The size distribution of AD particles is primarily 3.3–4.7 μm, with the diameter ranging from 0.5 to 10 μm.40 Therefore, most studies have investigated the effects of AD exposure on health according to the levels of particulate matter measuring <10 μm in diameter (PM10) and PM2.5. In Japan, SPM is defined by the National Air Quality Standard as any particle with a diameter of <10 μm with a 100% cutoff,41 whereas PM10 is defined as any particle measuring less than 10 μm in diameter with a 50% cutoff. However, SPM, PM10, and PM2.5 are a complex mixture of various solid and liquid particles. Therefore, AD particles cannot be clearly distinguished from other particulate matter on the basis of SPM, PM10, and PM2.5. To overcome this problem, Japanese studies started using LIDAR data.15,16 In this study, patients with asthma alone showed a significant association between PEF values and daily levels of AD particles and AD particle levels on heavy exposure days as measured by LIDAR systems.
Understandably, pulmonary function was poorer in the overall cohort than in patients with asthma alone. When patients were classified into two groups according to %FEV1 in subgroup analyses, both ≥80% and <80% groups showed no association between PEF values and heavy AD exposure. These results suggest that poor pulmonary function was not a risk factor for a decrease in PEF values after AD exposure.
This study has some limitations. First, there may be a potential for selection bias because the included patients regularly attended respiratory clinics and were treated by chest physicians. In particular, untreated patients with ACOS may also exhibit an aggravation of pulmonary dysfunction after AD exposure. Therefore, our results may have underestimated the effects of AD exposure on pulmonary function. Second, we were unable to estimate the amount of exposure to SPM, PM2.5, and AD particles for each individual. Finally, we did not assess the amount of pollen, which may affect pulmonary function in patients with concomitant rhinosinusitis.
Conclusion
Within the limitations of the study, the results suggest that the effects of AD exposure on pulmonary function differ between patients with asthma alone and those with ACOS, with the former exhibiting a greater likelihood of a decrease in pulmonary function after exposure to AD. Patients with asthma alone may show a greater decrease in pulmonary function by exposure to AD than those with ACOS.
Acknowledgments
The authors thank Atsushi Shimizu and Nobuo Sugimoto (National Institute for Environmental Studies) for providing LIDAR data. The study was supported by the Environmental Research and Technology Development Fund (5C-1154 and 5-1453) of the Japanese Ministry of the Environment, and Tottori Prefecture. The sponsors had no role in the study design; in the collection, analysis, and interpretation of data; in the writing of the report; or in the decision to submit the article for publication.
Author contributions
MW, JK, HS, ES, and HK conceived the study. MW, HN, and HS participated in the design. MW, JK, YU, MM, HY, HT, KK, TK, and TT collected the data. MW and HN performed the analysis. MW, HN, JK, and HS drafted the manuscript. All authors had full access to all study data and take full responsibility for the data integrity and accuracy of analysis. All authors further contributed toward data analysis, drafting and critically revising the paper and agree to be accountable for all aspects of the work.
Disclosure
The authors report no conflicts of interest in this work.
References
Tanaka TY, Chiba M. A numerical study of the contribution of dust source regions to the global dust budget. Global Planet Change. 2006;52:88–104. | ||
Hioki T, Nakanishi S, Mukai H, Murano K. Analysis of long-lange transported and local air pollution with trace metal concentration ratio and lead isotope ratio in precipitation. J Jpn Soc Atmos Environ. 2008;43(2):100–111. | ||
Hioki T, Kimoto T, Hasegawa S, Mukai H, Ohara T, Wakamatsu S. Analysis of long-range transported and local air pollution with trace metal concentration ratio in aerosols collected at Matsuyama, Osaka and Tsukuba, Japan. J Jpn Soc Atmos Environ. 2009;44(2):91–101. | ||
Wuebbles DJ, Lei H, Lin J. Intercontinental transport of aerosols and photochemical oxidants from Asia and its consequences. Environ Pollut. 2007;150(1):65–84. | ||
Onishi K, Kurosaki Y, Otani S, Yoshida A, Sugimoto N, Kurozawa Y. Atmospheric transport route determines components of Asian dust and health effects in Japan. Atmos Environ. 2012;49:94–102. | ||
Chen H, Goldberg MS, Villeneuve PJ. A systematic review of the relation between long-term exposure to ambient air pollution and chronic diseases. Rev Environ Health. 2008;23(4):243–297. | ||
Huang RJ, Zhang Y, Bozzetti C, et al. High secondary aerosol contribution to particulate pollution during haze events in China. Nature. 2014;514(7521):218–222. | ||
Chen YS, Sheen PC, Chen ER, Liu YK, Wu TN, Yang CY. Effects of Asian dust storm events on daily mortality in Taipei, Taiwan. Environ Res. 2004;95(2):151–155. | ||
Kwon HJ, Cho SH, Chun Y, Lagarde F, Pershagen G. Effects of the Asian dust events on daily mortality in Seoul, Korea. Environ Res. 2002;90(1):1–5. | ||
Lai LW, Cheng WL. The impact of air quality on respiratory admissions during Asian dust storm periods. Int J Environ Health Res. 2008;18(6):429–450. | ||
Yang CY, Chen YS, Chiu HF, Goggins WB. Effects of Asian dust storm events on daily stroke admissions in Taipei, Taiwan. Environ Res. 2005;99(1):79–84. | ||
Park JW, Lim YH, Kyung SY, et al. Effects of ambient particulate matter on peak expiratory flow rates and respiratory symptoms of asthmatics during Asian dust periods in Korea. Respirology. 2005;10(4):470–476. | ||
Yoo Y, Choung JT, Yu j, et al. Acute effects of Asian dust events on respiratory symptoms and peak expiratory flow in children with mild asthma. J Korean Med Sci. 2008;23(1):66–71. | ||
Park J, Lim MN, Hong Y, Kim WJ. The Influence of Asian Dust, Haze, Mist, and Fog on Hospital Visits for Airway Diseases. Tuberc Respir Dis. 2015;78(4):326–335. | ||
Kanatani KT, Ito I, Al-Delaimy WK, Adachi Y, Mathews WC, Ramsdell JW. Toyama Asian Desert Dust and Asthma Study Team. Desert-dust exposure is associated with increased risk of asthma hospitalization in children. Am J Respir Crit Care Med. 2010;182(12):1475–1481. | ||
Ueda K, Nitta H, Odajima H. The effects of weather, air pollutants, and Asian dust on hospitalization for asthma in Fukuoka. Environ Health Prev Med. 2010;15(6):350–357. | ||
Watanabe M, Yamasaki A, Burioka N, et al. Correlation between Asian dust storms and worsening asthma in Western Japan. Allergol Int. 2011;60(3):267–275. | ||
Watanabe M, Noma H, Kurai J, et al. Effect of Asian dust on pulmonary function in adult asthma patients in Western Japan: a panel study. Allergol Int. Epub 20 November, 2015. Available from: http://dx.doi.org/10.1016/j.alit.2015.10.002. Accessed January 2, 2016. | ||
Postma DS, Kerstjens HAM. Characteristics of airway hyperresponsiveness in asthma and chronic obstructive pulmonary disease. Am J Respir Crit Care Med. 1998;158(5 Pt 3):S187–S192. | ||
Scichilone N, Battaglia S, La Sala A, Bellia V. Clinical implications of airway hyper-responsiveness in COPD. Int J Chron Obstruct Pulmon Dis. 2006;1(1):49–60. | ||
Blanchette CM, Gutierrez B, Ory C, Chang E, Akazawa M. Economic burden in direct costs of concomitant chronic obstructive pulmonary disease and asthma in a Medicare advantage population. J Manag Care Pharma JMCP. 2008;14(2):176–185. | ||
Zeki AA, Schivo M, Chan A, Albertson TE, Louie S. The asthma-COPD overlap syndrome: a common clinical problem in the elderly. J Allergy. 2011;2011:861926. | ||
Sorino C, Scichilone NA, Battaglia S, Augugliaro G, Bellia V. Mechanisms in chronic obstructive pulmonary disease: comparisons with asthma. Minerva Pneumologica. 2009;48:15–29. | ||
Tai A, Tran H, Roberts M, Clarke N, Wilson J, Robertson CF. The association between childhood asthma and adult chronic obstructive pulmonary disease. Thorax. 2014;69(9):805–810. | ||
Diagnosis of diseases of chronic airflow limitation: asthma COPD and Asthma-COPD overlap syndrome (ACOS). Based on the global strategy for asthma management and prevention and the global strategy for the diagnosis, management and prevention of chronic obstructive pulmonary disease, 2014. Available from: http://www.ginasthma.org/local/uploads/files/AsthmaCOPDOverlap.pdf. Accessed December 30, 2015. | ||
Gibson PG, Simpson JL. The overlap syndrome of asthma and COPD: what are its features and how important is it? Thorax. 2009;64(8):728–735. | ||
Menezes AM, Montes de Oca M, Perez-Padilla R, et al. Increased risk of exacerbation and hospitalization in subjects with an overlap phenotype: COPD-asthma. Chest. 2014;145(2):297–304. | ||
Pleasants RA, Ohar JA, Croft JB, et al. Chronic obstructive pulmonary disease and asthma-patient characteristics and health impairment. COPD. 2014;11(3):256–266. | ||
Global strategy for asthma management and prevention, global initiative for asthma (GINA) [updated 2014]. Available from: http://www.ginasthma.org/. Accessed December 30, 2015. | ||
Global Initiative for Chronic Obstructive Lung Disease. Global strategy for the diagnosis, management and prevention of chronic obstructive pulmonary disease NHLBI/WHO Workshop Report. Updated 2014. | ||
Sugimoto N, Lee CH. Characteristics of dust aerosols inferred from lidar depolarization measurements at two wavelengths. Appl Opt. 2006;45(28):7468–7474. | ||
Sugimoto N, Matsui I, Shimizu A. Lidar network observations of tropospheric aerosols. Proc SPIE. 2008;7153. doi:10.1117/12.806540. | ||
Toyama M, Hasegawa T, Sakagami T, et al; Niigata Asthma Treatment Study Group. Depression’s influence on the asthma control test, Japanese version. Allergol Int. 2014;63(4):587–594. | ||
Laird NM, Ware JH. Random-effects models for longitudinal data. Biometrics. 1982;38(4):963–974. | ||
Verbeke G, Molenberghs G. Linear Mixed Models for Longitudinal Data. 2nd ed. New York, NY: Springer Verlag; 2009. | ||
Hardin M, Silverman EK, Barr RG, et al; COPDGene Investigators. The clinical features of the overlap between COPD and asthma. Respir Res. 2011;12:127. | ||
Thomson NC, Chaudhuri R, Livingston E. Asthma and cigarette smoking. Eur Respir J. 2004;24(5):822–833. | ||
Jensen E, Dahl R, Steffensen F. Bronchial reactivity to cigarette smoke; relation to lung function, respiratory symptoms, serum-immunoglobulin E and blood eosinophil and leukocyte counts. Respir Med. 2000;94(2):119–127. | ||
Bousquet J, Khaltaev N, Cruz AA, et al; World Health Organization; GA(2)LEN; AllerGen. Allergic rhinitis and its impact on asthma (ARIA) 2008 update (in collaboration with the World Health Organization, GA(2)LEN and AllerGen). Allergy. 2008;63(86):8–160. | ||
Mori I, Nishikawa M, Tanimura T, Quan H. Change in size distribution and chemical composition of kosa (Asian dust) aerosol during long-range transport. Atomos Environ. 2003;37(30):4253–4263. | ||
Special Committee on National Air Quality Standard of Particulate Matter. Data for decision on the National Air Quality Standard of Particulate Matter. J Jap Atmos Environ. 1973;8:1–57. Japanese. |
 © 2016 The Author(s). This work is published and licensed by Dove Medical Press Limited. The
full terms of this license are available at https://www.dovepress.com/terms
and incorporate the Creative Commons Attribution
- Non Commercial (unported, 3.0) License.
By accessing the work you hereby accept the Terms. Non-commercial uses of the work are permitted
without any further permission from Dove Medical Press Limited, provided the work is properly
attributed. For permission for commercial use of this work, please see paragraphs 4.2 and 5 of our Terms.
© 2016 The Author(s). This work is published and licensed by Dove Medical Press Limited. The
full terms of this license are available at https://www.dovepress.com/terms
and incorporate the Creative Commons Attribution
- Non Commercial (unported, 3.0) License.
By accessing the work you hereby accept the Terms. Non-commercial uses of the work are permitted
without any further permission from Dove Medical Press Limited, provided the work is properly
attributed. For permission for commercial use of this work, please see paragraphs 4.2 and 5 of our Terms.