Back to Journals » International Journal of Nanomedicine » Volume 11
Development of transmucosal patch loaded with anesthetic and analgesic for dental procedures and in vivo evaluation
Authors Nidhi M, Patro M N, Kusumvalli S, Kusumdevi V
Received 18 August 2015
Accepted for publication 9 December 2015
Published 20 June 2016 Volume 2016:11 Pages 2901—2920
DOI https://doi.org/10.2147/IJN.S94658
Checked for plagiarism Yes
Review by Single anonymous peer review
Peer reviewer comments 2
Editor who approved publication: Dr Thomas Webster
Malviya Nidhi,1 M Nagaraju Patro,1 Somisetty Kusumvalli,2 Vemula Kusumdevi1
1Department of Pharmaceutics, Al-Ameen College of Pharmacy, 2Department of Endodontics and Conservative Dentistry, Sri Rajiv Gandhi College of Dental Sciences, Bengaluru, Karnataka, India
Abstract: Most of the dental surgeries require preoperative anesthetic and postoperative analgesic for painless procedures. A multidrug transmucosal drug delivery system loaded with lignocaine (Lig) base for immediate release and solid lipid nanoparticles (SLNs) of diclofenac (Dic) diethylamine for prolonged release was developed. SLNs were prepared by solvent emulsion–evaporation method with Precirol ATO 5 and Geleol as lipids and Pluronic F 68 as surfactant and optimized with Box–Behnken design for particle size and entrapment efficiency. SLNs were incorporated into the transmucosal patch (TP) prepared with hydroxypropyl cellulose-LF (HPC-LF) and with a backing layer of ethyl cellulose. Optimized SLNs and TP were characterized for Fourier transform infrared spectrophotometry, differential scanning calorimetry, scanning electron microscopy, X-ray diffraction, in vitro release, ex vivo permeation through porcine buccal mucosa, Caco-2 permeability, and residual solvent analysis by gas chromatography. The TP was also evaluated for swelling index, in vitro residence time, tensile strength, and mucoadhesive strength. Preclinical pharmacokinetic, pharmacodynamic, and histopathological studies by application of TP on the gingiva of New Zealand rabbits were carried out. Particle size and entrapment efficiency of the optimized SLN “S8” were determined as 98.23 nm and 84.36%, respectively. The gingival crevicular fluid and tissue concentrations were greater than plasma concentrations with increase in Cmax and area under the curve (AUC) of Lig and Dic when compared to the control group. Pain perception by needle prick showed prolonged combined anesthetic and analgesic effect. The developed TP loaded with Lig base and Dic diethylamine-SLNs exhibited immediate and complete permeation with tissue accumulation of Lig followed by controlled prolonged release and tissue accumulation of Dic at the site of application. Thus, it could be anticipated from the in vivo studies that the developed TP provides immediate initial anesthetic effect, and the analgesic effect would be prolonged for 24 hours, since optimal gingival crevicular fluid and tissue levels of analgesic would be achieved, while the tissue remains anesthetized.
Keywords: solid lipid nanoparticle, Box–Behnken design, transmucosal patch, pharmacokinetics and pharmacodynamics, Caco-2 permeability, histopathology
Corrigendum for this paper has been published
Introduction
Most of the dental procedures, namely deep tooth scaling, root canal treatment, tooth extraction, and apicoectomy employed for the prevention and treatment of dental problems and diseases, require preoperative anesthetic and postoperative analgesic.1 Patients are most often concerned about the dental pain; thus, its prevention is more important rather than the treatment.2 In the current study, we aimed to design a patient-friendly and easy-to-administer transmucosal drug delivery system: a bilayer transmucosal patch (TP) containing lignocaine (Lig) and diclofenac (Dic) diethylamine-solid lipid nanoparticle (DDEA-SLN) to be applied over the gingiva of oral cavity producing a local effect to control the dental pain. Immediate release of Lig would ensure painless surgery followed by controlled and prolonged release of Dic.
Lig is available as solutions, gels, ointments, sprays, and injectables. The drawback of these dosage forms is either one of the following: involuntary swallowing, inaccuracy of dose delivered and loss of drug due to salivation, large dose size, or pain due to prick of needle. DDEA used for topical applications is often prescribed in dentistry and administered such that optimal serum levels should be established either preoperatively or prior to patient discharge, while the tissue remains anesthetized.3,4 Dic is available as suspensions, syrups, capsules, tablets, suppositories, and intramuscular/intravenous injections. Suppositories are unacceptable to certain patients, difficult to administer for patients with arthritis and physically challenged patients, and have unpredictable and variable in vivo absorption. Dose precision cannot be achieved unless suspensions are packed in unit dosage forms, and they have problems of instability, microbial contamination, and high cost for bulk product transportation. Solutions are less stable; unpleasant flavors are difficult to mask; they are bulky to carry around, with inaccuracy in dose; and accidental breakage of the container results in complete and messy loss of the contents. Capsules and tablets of Dic have the drawback of gastric irritation, delayed onset of action, high frequency of administration, and low bioavailability due to first-pass metabolism. Limitation of injectables is pain due to prick of needle at the site of injection and patient noncompliance. Thus, to overcome these drawbacks of Lig and Dic dosage forms, it was proposed to develop a TP.
SLNs are colloidal carriers of submicron size (50–1,000 nm) made from lipids that remain in a solid state at room temperature and body temperature. Solid matrix of SLNs allows controlled drug release that increases the bioavailability of the drug.5 SLNs can be conveniently prepared and scaled up using a wide variety of lipids, including lipid acids, glycerides, and waxes stabilized by biocompatible surfactants. Other advantages of SLNs are high drug-loading capacity for lipophilic drugs and use of physiological lipids.
TP has the advantage of site-specific delivery due to mucoadhesion, accuracy in dosing, local delivery for prolonged period, unidirectional release due to the backing layer, and noninvasive painless application of Lig.6 Thus, a TP that also contains DDEA-SLN could deliver the drug in a sustained and prolonged manner overcoming the drawback of first-pass metabolism, low bioavailability, and gastric irritation and reduce the high frequency of administration to once-a-day patch of Dic.
Materials and methods
Materials
Lig from AstraZeneca (London, UK), DDEA from Neon Laboratory Ltd (Mumbai, India), Compritol ATO 888, Precirol ATO 5, Geleol, and Labrafac PG (LPG) propylene glycol dicaprylate/dicaprate from Gattefosse (St-Priest, France), hydroxypropyl cellulose (HPC)-LF from Loba Chemie Pvt ltd (Mumbai, India), ethyl cellulose (EC; viscosity 20 cps and 50% ethoxy content) from Dow Cellulosic (Midland, MI, USA), and Noveon® AA-1 polycarbophil (PC) from Lubrizol were generous gift samples. Soya lecithin was purchased from Sigma-Aldrich (St Louis, MO, USA), and palmitic acid (PA), stearic acid, Pluronic F 68, and dichloromethane (DCM) were purchased from Himedia Laboratories (Mumbai, India). Milli Q water was used for preparation, and all other chemicals and reagents used were of analytical grade.
Methods
Selection of lipids
The mixture of DDEA:lipid (1:10) was melted slightly above the melting point of each lipid, stirred, cooled to room temperature, and subjected for differential scanning calorimetric (DSC) studies to estimate the solubility of DDEA in each lipid.7
Preparation of DDEA-SLN
SLN was prepared by solvent emulsion–evaporation method.8 DDEA (0.58% w/v), Precirol:Geleol (1:1, 0.16%–0.8% w/v), and soya lecithin (0.04% w/v) were dissolved in DCM (20% v/v) with sonication with mild heating to obtain a clear solution. This solution was added (1 mL/min) into a heated (80°C), stirred (4,000 rpm) aqueous phase (AP; 50–125 mL) containing Pluronic F 68 (0.1%–0.15% w/v) in water. The resulting suspension was stirred (20,000 rpm, Ultra Turrax IKA T25; IKA, Staufen im Breisgau, Germany) for 20 minutes and cooled at room temperature. The nanodispersion was freezed (−40°C, 12 hours) and lyophilized (16 hours) to obtain the dry powder, which was stored at 4°C in refrigerator for subsequent studies. Blank SLN was prepared similarly without employing DDEA.
Experimental design
Preliminary study was carried by varying the rotation speed, time of rotation, and volume of organic phase, and optimization was continued by Box–Behnken design. Box–Behnken design is a statistical type of response surface method (RSM) that is independent, rotatable, and quadratic having the treatment combinations at the midpoints of the edges of the process space and at the center that requires very less experimental runs and time.9,10
A three-factor, three-level design is suitable for exploring quadratic response surfaces and constructing second-order polynomial models with Design-Expert (Version 8.0.7; Stat-Ease Inc., Minneapolis, MN, USA). Polynomial equation generated by this experimental design is given as follows:
|
|
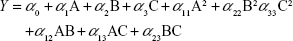
where Y is the predicted response, either particle size (PS) or entrapment efficiency (EE); α0 is the intercept; α1, α2, and α3 are linear coefficients; α11, α22, and α33 are squared coefficients; α12, α13, and α23 are interaction coefficients; and A, B, and C are the independent variables for amounts (% w/v) of lipid and surfactant and volume (mL) of AP, respectively.
Preparation of TP loaded with Lig base and DDEA-SLN
The selection and amount of polymer and permeation enhancers were standardized in preliminary studies carried out with LB. The TP was prepared with HPC-LF (4% w/v), PC (0.1% w/v), LPG (0.8% w/v), and DDEA-SLN equivalent to 3.48% w/v of DDEA in Milli Q water and stirred to obtain a uniform dispersion. This was sonicated to remove air bubbles and casted over a glass mold containing the backing layer.11,12 Over the dried mucoadhesive layer was added Lig base (1.87% w/v) and clove oil (0.8% w/v) in ethanol and dried. Briefly, the backing layer was casted by dissolving EC (4% w/v) and dibutyl phthalate (0.3% w/v) in ethyl acetate:acetone (1:1).
Physiochemical characterization of DDEA-SLN
PS and zeta potential
Mean PS and poly disperse index (PDI) were analyzed by Zetasizer-S90 (Malvern Instruments, Malvern, UK). An aliquot of lyophilized SLN was resuspended in distilled water, and analysis was performed at a fixed angle of 90°C to the incident light. Data were collected from three measurements, each having 20 runs. Zeta potential (ZP) of the samples was measured in Zetasizer Nano ZS90 (Malvern Instruments) in distilled water with a conductivity of 50 AS/cm at 25°C. ZP was calculated from Smoluchowski equation. All the determinations were performed in triplicate.
Drug content
Lyophilized SLN (10 mg) was dissolved in DCM and after suitable dilutions analyzed at 282 nm.
Entrapment efficiency
The SLN dispersion was centrifuged at 16,000 rpm for 30 minutes. The amount of DDEA in the clear supernatant was determined from its absorption at 282 nm with UV–visible spectrophotometer. Absorbance value obtained for blank SLN treated in a similar manner was used as the control value to compensate for any interference of the ingredients. All the determinations were performed in triplicate.
Drug EE was determined as per the following equation:
|
|
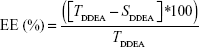
where TDDEA is the total amount of DDEA and SDDEA is the amount of drug measured in the supernatant.
Drug loading (DL) percentage13 was also calculated according to Equation 3.
|
|
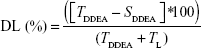
where TL is the total amount of lipid.
In vitro release study of DDEA-SLN
SLN equivalent to 58.03 mg of DDEA was placed inside the dialysis bag (molecular weight: 12,000–14,000 Da), tied at both ends, and dipped in 200 mL of dissolution medium (pH 7.4; phosphate buffer, 50 rpm; 37°C±0.5°C).14 Aliquots were withdrawn at preset time intervals and replaced by an equal volume of fresh media. After suitable dilution, the samples were analyzed spectrophotometrically at 282 nm.
Ex vivo permeation study of DDEA-SLN
Freshly excised layer of porcine buccal mucosa washed in isotonic phosphate buffer (pH 6.8) and trimmed from the sides was placed over Franz diffusion cell (effective surface: 4.9107 cm2).15 DDEA-SLN dispersion equivalent to 58.03 mg of DDEA was added to the donor compartment with phosphate buffer (pH 6.8, 5 mL). Receptor compartment contained phosphate buffer (50 mL, pH 7.4, 37°C±1°C, 50 rpm). An aliquot (2 mL) of the sample was withdrawn from receiver compartment at predetermined time intervals and replenished with an equal volume of fresh buffer. Samples were analyzed using UV–visible spectrophotometer.
Evaluation of TP
Prepared patches were evaluated for appearance, weight and thickness uniformity, folding endurance, and surface pH.
Swelling index of TP
The TP (1 cm2) was weighed and placed over a preweighed glass cover slip, which was submerged into simulated saliva (pH 6.8, 15 mL) placed in a Petri dish. At predetermined time, the cover slip was removed and weighed after wiping the excess of media. Swelling index (SI) was calculated14 using Equation 4.
|
|

where Wt and W0 are the weights of the patch at time t and 0 minutes.
In vitro residence time of TP
The TP (1.5×2 cm2) was hydrated and placed over the porcine buccal mucosa, which was glued to the surface of a glass slab vertically attached to the United States Pharmacopoeia (USP) disintegration apparatus.16 The glass slab moved up and down, so that the patch was completely immersed in the simulated saliva (pH 6.8, 800 mL, 37°C) at the lowest point and was out at the highest point. The time necessary for complete erosion or detachment of the patch from the mucosal surface was recorded.
Content uniformity of TP
The TP (1 cm2) was weighed and dissolved in 100 mL of DCM. The solution was filtered and after suitable dilution analyzed by high-performance liquid chromatography (HPLC; LC-2010; Shimadzu Corporation, Kyoto, Japan) at 210 nm. A Phenomenex C18 (150×4.6 mm) packed with 5 μm particle and a guard column: (4.0×3.0 mm, 5 μm) was used with the mixture of acetonitrile:sodium phosphate buffer (35:65, pH 6) and triethyl amine (0.1%) as the mobile phase at flow rate of 1 mL/min.
In vitro drug release of TP
The TP (1.5×2 cm2) was glued to a glass slide and placed at the bottom of the jar containing 50 mL of simulated salivary (pH 6.8, 37°C±0.5°C, 50 rpm) of USP dissolution apparatus type II (Electrolab TDT-08L; Mumbai, India).16 Samples were withdrawn from each station at predetermined time interval, filtered, diluted suitably, and analyzed at 210 nm.
Ex vivo permeation of TP
Ex vivo permeation studies of the TP (1.5×2 cm2) were carried out similar to the procedure described for DDEA-SLN, followed by analysis at 210 nm.
Tensile strength of TP
Tensile tester (H5KS; Tinius Olsen Ltd., Redhill, UK) equipped with a 50 kg load cell, pneumatic grip, and Horizon software was used to determine tensile stress and strain (elongation at break) of the TP (25×25 mm area). The grip separation was set at 10 mm, and the crosshead speed was 50 mm/min. Young’s modulus was calculated by the ratio of tensile stress to strain.
Mucoadhesive strength of TP
Porcine buccal mucosa was glued to a glass slide, which was attached to the immovable lower jaw. The TP (25×25 mm) was placed over the mucosa, and one edge (4 mm) was fixed to the movable upper jaw of tensile tester (H5KS; Tinius Olsen Ltd.). The force required to detach the TP from the mucosa was recorded.
Residual solvent analysis of DDEA-SLN and TP by gas chromatography
Analysis was performed using Shimadzu GC-MS-2010S gas chromatography (GC) mass spectra coupled with Pal CTC analytics automatic head space analyzer. Chromatograms and data were recorded by GC solutions software. The residual solvents DCM, ethyl acetate, acetone, and ethanol were separated on DB-624 capillary column (30×0.25 mm, 1.4 μm). Helium was used as carrier gas, and the flow rate was 1.0 mL/min. Approximately 1 mL of sample was injected to GC using auto sampler, and the split ratio was 1:10. Initially, the oven temperature was kept at 35°C for 5 minutes and increased at a rate of 10°C/min to 150°C, again increased at the rate of 20°C/min to 250°C. Injector and interface temperatures were kept at 250°C and 255°C, respectively. Head space analyzer oven was kept at 85°C, the samples were incubated for 30 minutes, and injection syringe was kept at 90°C. The standard and samples were prepared in 1-methyl 2-pyrrolidinone and analyzed in duplicate, and the quantification was performed by comparing the area of standard with that of samples where the detection limit was 10 ppm.
Differential scanning calorimetry
Thermograms of pure drugs, DDEA-SLN, and TP were taken by DSC (Mettler Toledo Star System). Weighed (7–10 mg) samples were placed in sealed aluminum pans under liquid nitrogen as coolant and scanned at 10°C/min from 40°C to 400°C.
Fourier transform infrared spectrophotometry
Pure drugs, DDEA-SLN, and TP were analyzed by KBr method over the wave number range of 4,000–400 cm−1 by Perkin Elmer Spectrum BX spectrophotometer.
X-ray diffraction
Powder X-ray diffraction (XRD) patterns of the pure drugs, DDEA-SLN, and TP were determined using Rigaku SmartLab® diffractometer equipped with a rotating target X-ray tube and wide-angle goniometry. X-ray source was Kα radiation from a copper target (λ=1.5418). X-ray tube was operated at a potential of 40 kV and a current of 30 mA. Scan range (2θ) was from 0° to 50° with a speed of 2° per minute at increments of 0.02°.
Scanning electron microscopy
Surface morphological study was carried out using electron microscope (Carl Zeiss Ultra 55 FESEM) for pure drugs, DDEA-SLN, and TP. A small amount of powder was manually dispersed onto a carbon tab (double adhesive carbon-coated tape) adhered to aluminum stubs. These sample stabs were coated with a thin layer (30 Å) of gold by employing Polaron-E 3000 sputter coater. Samples were examined and photographed under various magnifications with direct data capture of the images onto a computer.
Transport of LB and DDEA across Caco-2 cell monolayer
The optimized SLN and TP were sterilized by gamma radiation. The irradiation (25 kGy) was carried out by Cobalt-60 Gamma Chamber 4000-A at Microtrol Sterilization Services Pvt Ltd (Bengaluru, India). Caco-2 cell monolayer (monocultured) was established on transwell cell (Corning 3470; polyester clear; 24-well plate; pore size, 0.4 mm; insert membrane growth area, 0.33 cm2; insert diameter, 6.5 mm; nominal membrane thickness, 10 μm; pore density, 4×10⁶ pores/cm2; Sigma-Aldrich). Membrane integrity and complete confluence of monolayer were confirmed with lucifer yellow permeability assay by verifying the fluorescence leakage. Prior to transport, the culture medium was replaced by 600 mL of transport medium (Dulbecco’s Modified Eagle’s Medium [DMEM]-F12-buffered with 4-(2-hydroxyethyl)-1-piperazineethanesulfonic acid [HEPES]), 10% fetal bovine serum, and antibiotics penstrip (1% v/v), gentamicin (250 μg/mL), and chloramphenicol (23 ng/mL), and cells were allowed to equilibrate for 30 minutes. After the transport medium was discarded, 100 mL of pure drugs LB, DDEA, DDEA-SLN, and TP prepared in dimethyl sulfoxide (10% w/v) suspended in DMEM-F12-HEPES was applied to the apical side, and 600 mL of DMEM-F12-HEPES was added to the basolateral (BL) side. At predetermined time intervals, transepithelial electrical resistance was measured, and 50 mL of the aliquot was withdrawn from the BL side for quantification of the transported drug. An equal volume of fresh DMEM-F12-HEPES was added to the BL side to keep a constant volume. After the 12-hour transport study, the apparent permeability coefficient (Papp, cm/s) for each drug was calculated according to Equation 5:
|
|

where dQ/dt is the permeation rate of drug (mg/s), C0 is the initial concentration of each drug in the apical medium (mg/mL), and A is the area of monolayer (cm2).
Development of bioanalytical method for simultaneous estimation of LB and DDEA in biological samples viz, rabbit plasma, gingival crevicular fluid, and gingival tissue by HPLC method
Chromatographic conditions
The drug estimation was performed using gradient reverse phase HPLC17 (Shimadzu LC-2010 CHT) with pumps, a UV–visible-LC 2010 detector equipped with LC solution operating software. A Phenomenex C18 column (150 mm length, 4.6 mm internal diameter, and PS of 5 μm) was used as the stationary phase along with a guard column (4.0×3.0 mm, 5 μm). The mobile phase consisting of acetonitrile:sodium phosphate buffer (35:65, pH 6 with 0.1% of triethyl amine) was filtered through a 0.22 μm membrane filter and sonicated to remove air bubbles. The flow rate was 1.0 mL/min with a detection wavelength of 210 nm and sample injection volume of 50 μL.
Biological sample collection for analytical method development
Rabbit plasma was separated by cold centrifuging (5,000 rpm, 15 minutes, 5°C) the blood obtained at baseline in heparinized (10% v/v of 5,000 IU of heparin in 0.9% w/v of NaCl) Eppendorf tubes. Gingival crevicular fluid (GCF) stock solution was prepared by spiking the GCF samples from 32 periopapers, obtained at baseline from the rabbits, into 2 mL solution that contained acetonitrile.18 Weighed (0.0648 g) amount of gingival tissue was surgically removed from an anesthetized (Ketamine 40 mg/kg and Xylazine 5 mg/kg) rabbit, homogenized with phosphate buffer (17 mL, pH 7.4), and centrifuged to collect the supernatant.19 These biological samples were further utilized to construct the standard plots.
Preparation of standard solutions and calibration curve
Working standard solutions were prepared from standard stock solutions of LB (1,000 μg/mL), DDEA (1,000 μg/mL), and bupivacaine HCl (internal standard [IS], 1 μg/mL) in acetonitrile. Each kind of biological samples (250 μL) was treated with standard solutions of LB and DDEA (25 μL each) and IS (50 μL). Proteins were precipitated by addition of ice-cold acetonitrile (500 μL) and centrifuged at 5,000 rpm for 15 minutes. The amount of LB and DDEA present in the supernatant was quantified by HPLC method.20 Standard plot was constructed by plotting the ratio of area of drug: IS to obtain the straight-line equations. LB was linear at 0.05–1 μg/mL and DDEA at 0.05–4 μg/mL range.
In vivo studies with TP
White New Zealand male rabbits, weighing 2–2.5 kg, were procured from Biogene (Bengaluru, India) and labeled with picric acid for identification. Animals were maintained under standard laboratory conditions (20°C–25°C, 50%±5% relative humidity; 12-hour light/12-hour dark cycle). All experiments were performed in accordance with the guidelines of the Committee for Control and Supervision of Experiments on Animal, Ministry of Forest and Environment, Government of India, with approval from the Institutional Animal Ethics Committee, Al-Ameen College of Pharmacy, Bengaluru. The animals were thoroughly examined before experimentation and were acclimatized for 7 days to ensure their clinical conditions. They were fed with rabbit feed, carrot, cabbage, and cauliflower, and water was provided ad libitum. All these animals were housed under similar conditions and fasted overnight before the dosing. All the rabbits were divided into two groups with six animals each. The study was further divided into two phases within each group.
Grouping of animals
Group 1 received the TP (0.5×0.5 cm) containing LB (0.872 mg/kg) and DDEA (1.6248 mg/kg) placed over the anterior mandibular gingiva for 12 hours. Group 2 (control) received the 2% w/v Lox gel (Neon Laboratories Ltd.), containing Lig HCl administered as 1.008 mg/kg over the anterior mandibular gingiva and Voveran 50 mg (Novartis International AG, Basel, Switzerland) containing Dic sodium administered orally as 1.4 mg/kg. In both the groups, the dose maintained was 0.872 mg/kg of Lig and 1.3033 mg/kg of Dic. The gingiva was thoroughly wiped with wet cotton before placing the patch or the gel. Animals were anesthetized with Ketamine (40 mg/kg) and Xylazine (5 mg/kg). Sedation was maintained throughout the study period with the dose of each drug as and when required.
Sample collection during in vivo study
Phase 1
One day prior, the hairs were shaved over the marginal ear vein with the help of a hair remover cream. Alcohol was applied to clean the injection site. Blood samples were withdrawn from the marginal ear vein after applying xylene as topical irritant to dilate the vessel. Blood was drawn with a disposable needle (gauge 24) and collected in a heparinized Eppendorf tube. Plasma was separated as described earlier and stored in freezer below −5°C until utilized for drug analysis. At the same time intervals, GCF was withdrawn by placing the PerioPaper absorbent strip (Oraflow Inc., Plainview, NY, USA) at the gingival sulcus for 30 seconds. Immediately, the strips were placed in an Eppendorf tube and stored at −20°C until drug analysis.
Phase 2
After a wash-out period of five half-lives of each drug, the rabbits of each group received the same treatment. Tissue samples were withdrawn at the same time points by needle biopsy (needle gauge 18) from the mucogingival sulcus, placed in Eppendorf tubes containing 250 μL of pH 7.4 phosphate-buffered saline, and immediately refrigerated at −20°C until drug analysis.
Statistical analysis
Values were expressed in the mean ± standard error of the mean (n=6). Graph Pad Prism software, Version 6.0, was applied for the analysis. The data between two groups were analyzed by unpaired Student’s t-test, while one-way analysis of variance (ANOVA) followed by multiple comparisons was adopted in order to analyze data from multiple groups. Data were considered significant at P<0.05. Kinetica 5 software was utilized for calculation of the pharmacokinetic parameters.
Histopathological examination
The gingival mucosa of rabbits (the area where the TP was placed) was excised from each group and immediately fixed in formalin (10% v/v in buffer pH 7.4) at the completion of the studies. The tissue specimen was embedded in paraffin after being dehydrated in alcohol and subsequently cleared with xylene. Five-micrometer-thick serial histological sections were obtained from the paraffin blocks and stained with hematoxylin and eosin.21 The sections were examined under light microscope.
In vivo pharmacodynamic studies
New Zealand white rabbits (n=6) were procured and maintained as described earlier. Group 1: the lower gingiva was wiped with water; the TP was placed and held in place by applying force with thumb for 15 minutes. The duration of anesthesia and analgesia was determined at a depth of 1 mm of gingiva by needle prick (gauge # 28) method by a lancing device equipped with adjustable depth (Amkay Products Pvt. Ltd., Maharashtra, India) at predetermined time intervals 0.08 hour, 0.25 hour, 0.5 hour, 1 hour, and each hour, until the pain could be identified. Perception of pain was judged by observing the response shown as eye blink, head shake, and body shake or vibration.22 Positive control group (n=6) received the 2% w/v Lox gel (Neon Pharmaceutical Ltd.) at 0 minute and Voveran 50 mg (Novartis International AG) at 30 minutes by maintaining the same dose of drugs as that of TP and as mentioned earlier. A negative control (n=6) was also maintained, where no drug was applied or administered.
Results and discussion
Selection of lipids
Solubility of DDEA was determined in various lipids by DSC method. Figure 1A shows the thermograms of DDEA, lipids, and DDEA–lipid mixture and Table 1 illustrates melting point analysis. Characteristic melting point peak of DDEA (149.08°C) disappeared in all the mixtures, which indicated that the drug is soluble in all the lipids,23 namely, Compritol, Precirol, Geleol, PA, and stearic acid. But only in the case of Precirol and Geleol, maximum depression in melting point of the lipids was observed, indicating that DDEA is more soluble in these and comparatively less soluble in other lipids, and hence these were selected for preparation of DDEA-SLN.
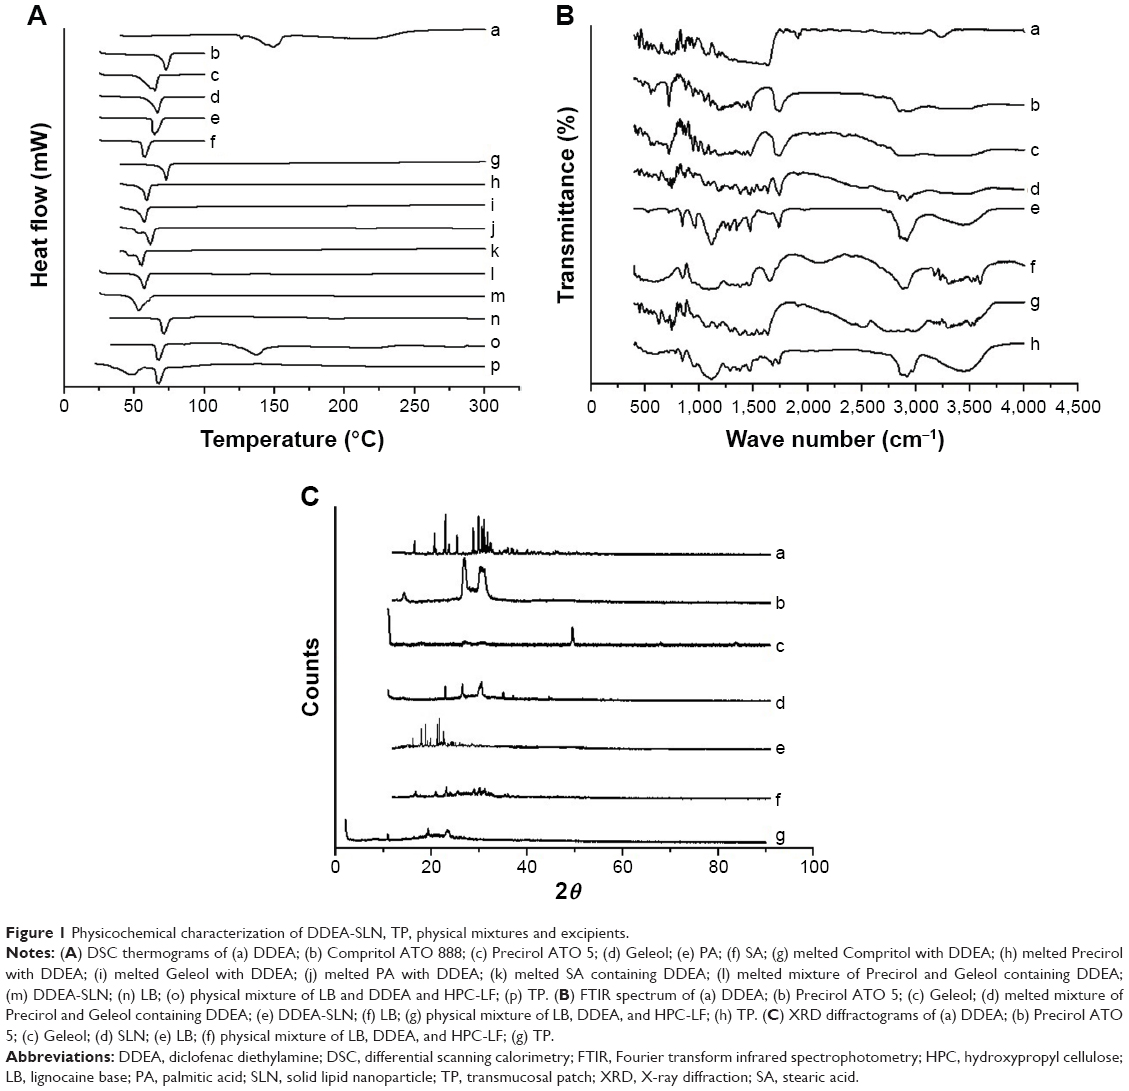 | Figure 1 Physicochemical characterization of DDEA-SLN, TP, physical mixtures and excipients. |
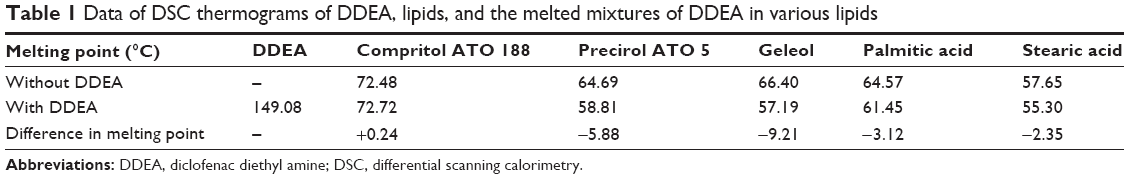 | Table 1 Data of DSC thermograms of DDEA, lipids, and the melted mixtures of DDEA in various lipids |
Preparation and evaluation of DDEA-SLN
The amount of soya lecithin was determined from preliminary studies and maintained constant in the optimization batches. The effect of the amount of lipids (Precirol and Geleol) and surfactant (Pluronic F 68) and the volume of AP on actual and predicted values of PS and EE, PDI, and DL of DDEA-SLN is shown in Table 2. DL efficiency varied from 6.93% (S4) to 37.33% (S16). SLNs were a nonsticky fluffy product after lyophilization. Content uniformity of various batches ranged from 88.92%±1.8% to 97.05%±2.3%. PS and EE ranged from 85.08±5 nm (S5) to 254.56±31 nm (S3) and 53.25%±1.67% (S3) to 86.84%±1.12% (S17), respectively. The PS (98.23 nm) and EE (84.36%) of SLN batch S8 were very close according to the point prediction of the design expert and correlated well with the desirable function criteria, and hence S8 was selected for further studies. PDI and ZP were determined as 0.15±0.037 mV and −29.333±0.71 mV, respectively, for the optimized batch S8. Uniformity of size distribution was indicated by a low value of PDI. Anionic charge and the value of ZP were within the limits of nontoxicity and imparted stability to the SLN.24
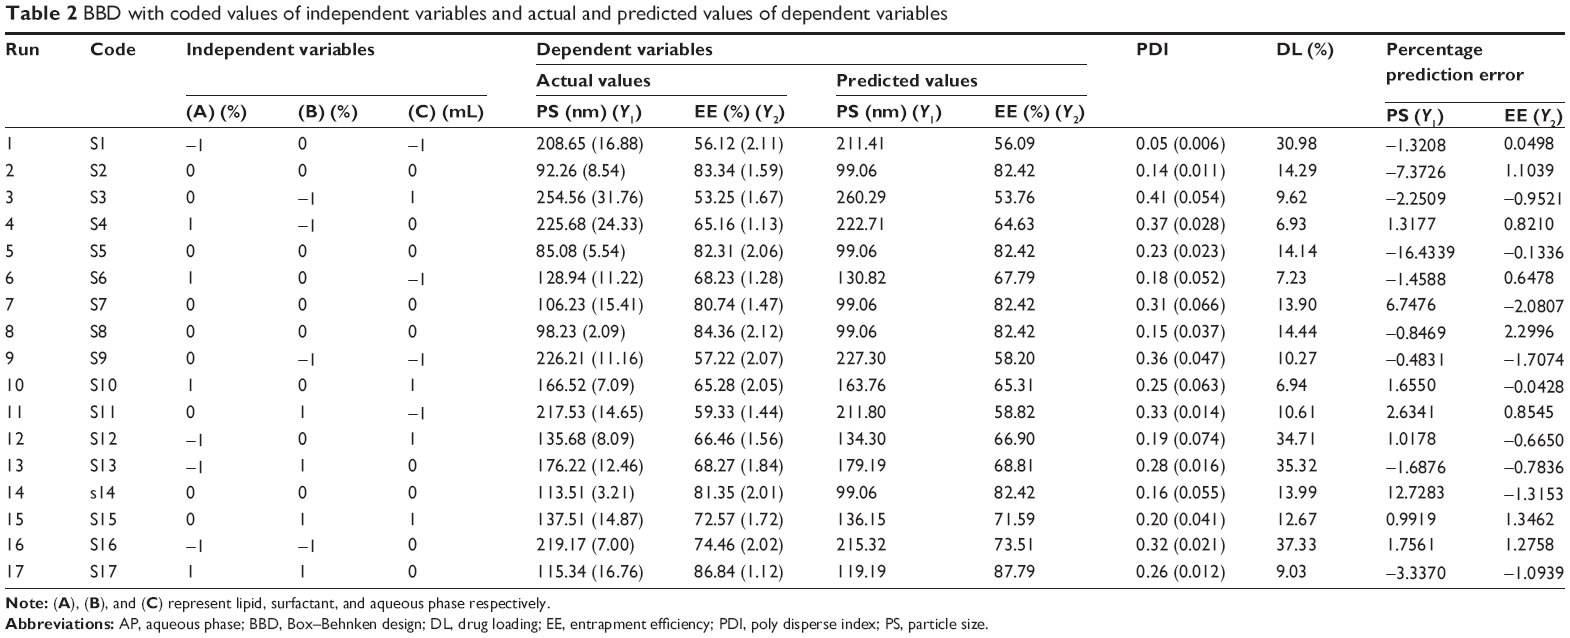 | Table 2 BBD with coded values of independent variables and actual and predicted values of dependent variables |
Experimental design and ANOVA
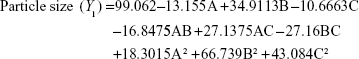
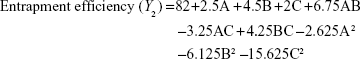
The three-dimensional surface plots for PS (Figure 2A–C) and EE (Figure 2D–F) were used to demonstrate the relationship and interaction between the coded/actual independent variables and the responses.25 This shows that there was a decrease in PS and an increase in EE with a decrease in the amount of lipid and an increase in the amount of surfactant and volume of AP. Mathematical models describing the relationship between variables (A, B, and C) and responses (Y1 and Y2) could be reduced to Equations 6 and 7, respectively.
|
|
|
|
 | Figure 2 ANOVA results of PS and EE as responses. |
The positive and negative value of the coefficients indicates favorable and unfavorable effect of the particular factor on the response. The fitting of the polynomial equation data is shown in ANOVA results (Table 3). Statistical significance of P-value <0.05 was considered for quadratic model of PS and EE. The model was found to be significant, and lack of fit was not significant. PS and EE were 79.39% and 55.23%, respectively, indicating that a “lack of fit F-value” this large could occur due to noise. A, B, C, AB, AC, BC, A2, B2, and C2 are significant model terms having a more pronounced effect on PS and EE. To evaluate the fitness of the second-order polynomial equation, multiple correlation coefficients R2 and adjusted R2 were employed as quality indicators (Table 3). The predicated R2 is in reasonable agreement with the adjusted R2 for PS as well as EE. Adequate precision measures the signal-to-noise ratio, and a ratio >4 is desirable, which was obtained in the case of PS and EE.
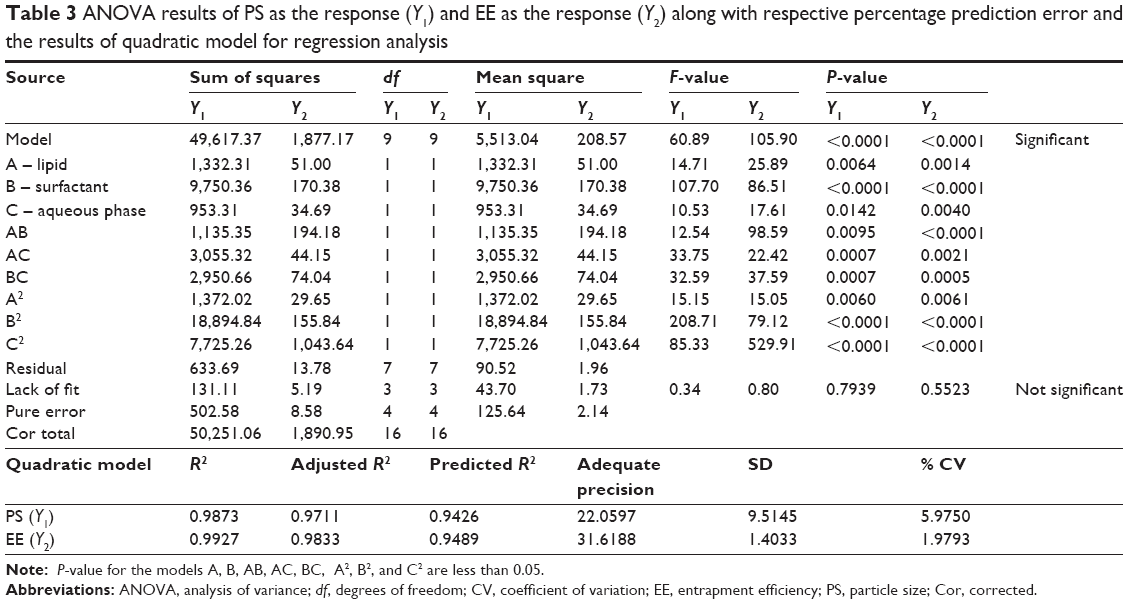 | Table 3 ANOVA results of PS as the response (Y1) and EE as the response (Y2) along with respective percentage prediction error and the results of quadratic model for regression analysis |
Response surface method
For validation of RSM results involving all the 17 runs, the experimental values of the responses were compared to the anticipated values26 (Table 2), which were close by with little difference for both PS and EE. The linear correlation plots between the actual and predicted response variables for PS and EE (Figure 2G and H) and their respective residual plots showing the scatter of the residuals versus run (Figure 2I and J) also confirmed the validity of RSM. The percentage prediction error (Table 2) assures the validity of generated equation and thus depicts the domain of applicability of RSM model. The percent prediction error ranged between −16.4339 (S5) and 12.7283 (S14) for PS and varied between −2.0807 (S7) and 2.2996 (S8) for EE. Point prediction of the design expert software was used to determine the optimized SLN batch as S8 with 99 nm PS and 82.42% as EE at 0.16% w/v of lipid, 0.15% w/v of surfactant, and 125 mL of aqueous volume. Low standard deviation, low coefficient of variation (CV), standard deviation expressed as a percentage of the mean, low magnitude of error, and the significant values of R2 (near to “one” for response Y1 and Y2) in the present investigation prove the high predictive ability of the RSM.
In vitro release study of DDEA-SLN
Slow and sustained release (98.74%±0.54%) until 24 hours (Figure 3) was preceded by initial rapid release (16.90%±2.33%) of DDEA. Initial burst release could be due to the rapid migration of the unentrapped drug, drug-enriched shells of SLN, and small sizes (large surfaces) of the nanoparticle. The sustained release was attributed to the diffusion through the lipid matrix.27 Kinetic mathematical models were used to fit the release data obtained, in order to select the one that best describes the profiles for the SLN, predicting the in vitro release mechanisms. Zero-order rate equation describes the system where the drug release rate is independent of drug concentration. First order describes the release rate as dependent of drug concentration. Korsmeyer–Peppas describes when the release is a nondiffusion process depending on the slope value “n” for spherical particles. Fickian diffusion when n≤0.45, non-Fickian diffusion (anomalous transport) when 0.45<n<0.89, case II transport (polymer swelling) when n=0.89, and super case II transport when n>0.89. Hixson–Crowell cube root law describes the release of drug from systems, where there is a change in surface area and diameter of particles. Drug release rate is dependent on the cube root of drug% remaining in matrix. Higuchi describes the release from insoluble matrix as a square root of time-dependent process based on Fickian diffusion. Regression coefficient (R2) of each model was used as an indicator for best-fitting release mechanism. Among these equations, regression results indicated that the best-fit mechanism for in vitro release was non-Fickian diffusion type with slope “n” value between 0.45 and 0.89 (Table 4). Slow release of DDEA from SLN suggests that DDEA is homogeneously dispersed in the lipid matrix. DDEA which is in amorphous form (confirmed by DSC and XRD studies) dissolves in lipid diffuses to the surface and undergoes partitioning between lipid and AP. Soluble DDEA is partitioned into AP from which it is dialyzed into the releasing medium. In the SLN, the amorphous DDEA molecules are incorporated into the crystalline matrix of the lipid, and their diffusional mobility is decreased. Diffusion through the carrier is the main mechanism of controlled release as described in Fick’s law of diffusion. Due to large DL, the degree of diffusion is decreased. There are too many molecules trying to diffuse, and they limit their own permeation (hindering effects).
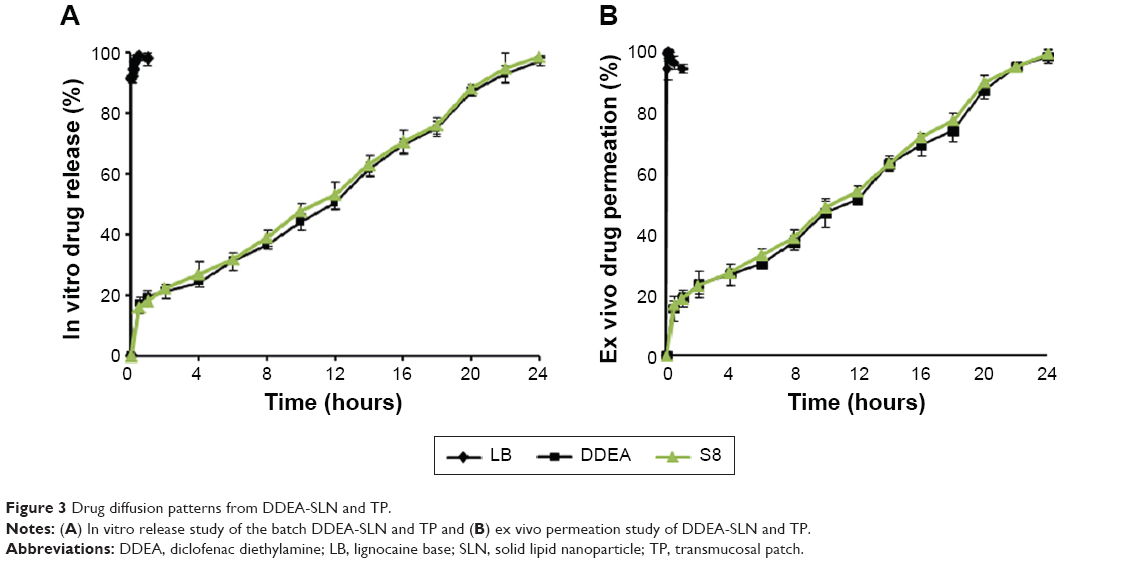 | Figure 3 Drug diffusion patterns from DDEA-SLN and TP. |
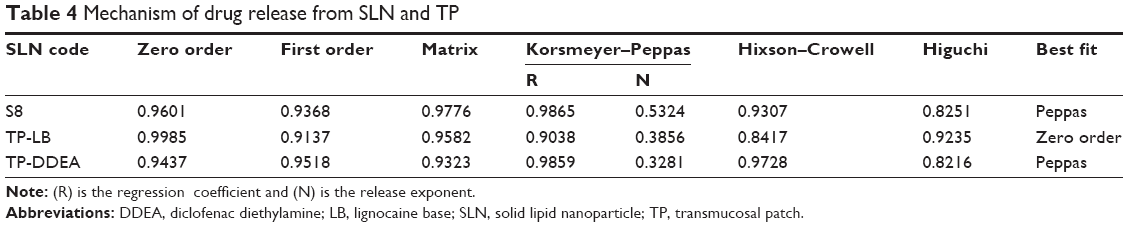 | Table 4 Mechanism of drug release from SLN and TP |
Ex vivo permeation studies of DDEA-SLN
Due to morphological similarities, buccal mucosa of the pig has been considered as an appropriate model of human buccal mucosa for drug permeability studies. DDEA permeation through the porcine buccal mucosa was 98.35%±1.9% at the end of 24 hours (Figure 3). Oral cavity of humans is covered by a stratified squamous epithelium, which is divided into two types: keratinized and nonkeratinized epithelium. Keratinized epithelium covers areas of masticatory mucosa, such as the hard palate and gingiva, and offers maximum resistance to drug permeation. Nonkeratinized epithelium covers areas of the lining mucosa, which is present on the lips, buccal mucosa, alveolar mucosa, soft palate, floor of the mouth, and underside the tongue. Delivery of drug molecules into or across the buccal mucosa requires penetration into these superficial layers, and the degree of permeability is least in the gingival mucosa, followed by the buccal mucosa. Membrane-coating granules display the principal penetration barrier to the movement of particles and spread their lipid content into the intercellular space.28 These systems maintain the activity of the protective barriers that prevent the movement of xenobiotics in the buccal mucosa. Since DDEA is lipophilic and carrier SLNs are also lipidic in nature, they could easily bypass the protective barrier exhibited by lipid content of membrane-coating granules in the intercellular space of the mucosa and produce a sustained release. Good correlation was obtained between in vitro and ex vivo studies. Initial ex vivo release was rapid followed by slow and sustained release following the same pattern as that of in vitro release.
Preparation and evaluation of TP
The TP was opaque, smooth, and nonsticky. PC was added to improve the mucoadhesion of HPC-LF. LPG was the plasticizer and permeation enhancer along with clove oil to enhance the permeation. DDEA-SLN was prepared with Precirol and Geleol as lipids, Pluronic F68 as surfactant and soyalecithin as lipid and stabilizer.
Evaluation of TP
Weight of 1 cm2 of TP was 0.102±0.01 g, and the thickness obtained was 0.75±0.04 mm. Folding endurance of TP was 152±4. Surface pH measured was within the range of salivary pH (6.5–6.8), which assured no irritation to the mucosa. SI increased with increase in time (4.39±0.26 at 15 minutes). In vitro residence time was found to be 10.28±0.23 hours.
In vitro release and ex vivo permeation are shown in Figure 3, where nearly 98% of LB was permeated in 2 minutes and DDEA has sustained over a period of 24 hours. The release profile of LB was zero order and that of DDEA was Fickian diffusion type with n<0.45. Increase in permeation of LB was due to its lipophilic nature. LPG incorporated as one of the permeation enhancers in TP is responsible for the loosening of the tight junctions of the lipoidal cell membrane that facilitates the rapid permeation of LB within the first 2 minutes of application of the patch. Eugenol present in clove oil was added as a permeation enhancer, which is phenolic in nature, reacts with the phospholipids in the cell membrane, and further increases the permeability29 of LB.
Tensile strength of TP
The values of tensile strength (8.42±0.1 kg/mm2), Young’s modulus (24.51±0.47 kg/mm2), and percent elongation (33.25±0.61) of TP display ductile patch with low brittleness, strong enough to prevent rupture during the cutting and packaging processes. This can be attributed to the oxygen group (–O–) present in the HPC-LF and PC polymer backbone and also in the plasticizer LPG, which tends to reduce chain stiffening, thus imparting mechanical properties of softness and durability.
Mucoadhesive strength of TP
Mucoadhesion occurs with intimate contact of polymer and mucosa as a result of good wetting of the surface with saliva. The intensity of the adhesion is mainly affected by the swelling capacity of the patch. The prepared TP was appropriate with high mucoadhesive strength of 0.037±0.002 kg and, hence, low possibility of easy removal. In addition, the oral cavity mucosa is negatively charged and the DDEA-SLN present in the TP has the positive ZP value, which also resulted in strong bonding leading to greater mucoadhesive strength. The –OH group of the HPC-LF forms hydrogen bond with the –OH groups present in the mucin, contributing to increased mucoadhesive strength.
Residual solvent analysis of DDEA-SLN and TP by GC
As adopted by the International Conference on Harmonization (ICH Q3C), class 1 solvents should be avoided and class 2 solvents should be limited in drug substances, excipients, and drug products in all pharmaceutical manufacturing because they have known human carcinogens or they have strongly suspected carcinogens and/or environmental hazards. When compared to the standard chromatogram, dichloromethane in DDEA-SLN and TP was not detected as residual solvent and the peaks of ethyl acetate, acetone, and ethyl alcohol in TP were also absent.
DSC, Fourier transform infrared spectrophotometry, XRD, scanning electron microscopy of DDEA-SLN, and TP
Thermal behaviors of drugs, lipids, DDEA-SLN, and TP were studied quantitatively and qualitatively by DSC. Figure 1A shows the thermograms of LB and DDEA. Pure LB has the sharp endothermic characteristic peak at 68°C, which also indicated that it is crystalline. DDEA has a broad endothermic characteristic peak with onset at 60°C and a sharp peak at 140°C, which confirms DDEA as anhydrous form. Thermogram of Precirol, Geleol, and SLN showed peaks at 65°C, 66°C and 70°C respectively. DSC analysis can be used to determine the physical state of the core lipid in SLN. In general, the melting peak of the lipid core of the SLN is observed at a lower temperature than that of bulk lipid mainly due to the nanocrystalline size of the lipids in the SLN.30 It can be concluded from the comparison of the peak temperature and endothermic transition contours of DDEA, Precirol ATO 5, Geleol, and SLNs that strong interactions have occurred between DDEA and lipids. In addition, pure Precirol, Geleol, and SLN are crystalline in nature. There is a shift of the peaks of pure DDEA and pure lipids to a lower temperature in the thermogram of SLN. A modification of the calorimetric curve in the SLN with respect to that of DDEA bulk occurred since the peak shifted toward lower temperatures, suggesting an initial interaction among the components that could lead to SLN formation upon heating. The lowered melting peak of the SLN suggests that DDEA located in the core of the SLN had been successfully solidified by the solvent evaporation method we used to prepare and now the DDEA exists in amorphous state within the crystalline matrix of SLN. All these indicate that the more ordered perfect crystalline substance requires more energy for the melting of the substance to overcome lattice force than the less-ordered crystalline substance. Crystalline matrix of SLN is also responsible for the sustained release of drug as seen in vitro and ex vivo studies of SLN and the patch. Lowering of melting point of DDEA in the patch and also the lowering of melting point of lipid in the patch suggest that the SLNs have interacted with the polymer. Very slight shift of endothermic peak of LB toward lower temperature in the TP suggests the interaction with HPC-LF polymer, permeation enhancers LPG and clove oil, and surface of SLN.
The characteristic infrared (IR) peaks of LB are at 3,030 cm−1 benzene ring range, 1,450–1,600 cm−1 (C=C), 3,000–3,500 cm−1 (H–N–C=O stretching of amide group), 3,250 cm−1 (N–H), 1,630–1,690 cm−1 (C=O stretching of carbonyl group), 1,020–1,360 cm−1 (N attached to three carbons is a tertiary amine, and it is not connected to H directly), while the characteristic IR peaks of DDEA appear at 3,222.83 cm−1 (NH stretching of secondary amine), 1,563.95 cm−1 (–C=O stretching of the carboxyl ion), and 744.47 cm−1 because of C–Cl stretching. The IR peaks of DDEA were intact in the IR spectra of DDEA-SLN, and the IR spectra of both these drugs were intact in the TP. This infers that the drug is compatible with the lipids and polymers (Figure 1B).
The diffraction pattern (Figure 1C) of LB, DDEA, Precirol ATO 5, Geleol, SLN, and the patch further confirms the results of DSC studies. Pure drugs and lipids are crystalline, while the crystallinity decreases in SLN and the TP. The lipids have sharp peaks, which is also present in the diffractograms of SLN. This indicates the ordered crystal arrangements in the SLN and the pure lipid and in the patch.31 Disappearance of LB and DDEA peaks in SLN and in the patch indicates that it exist in the amorphous form.
LB, DDEA, Precirol, Geleol, and HPC-LF exist in irregular shapes, whereas the DDEA-SLN was spherical in shape with smooth surface, varying in size between 36 nm and 126 nm. SLNs are evenly distributed in the TP along with LB as seen from scanning electron microscopy (SEM) images (Figure 4).
 | Figure 4 SEM images of (A) DDEA; (B) Precirol ATO 5; (C) Geleol; (D) SLN; (E) LB; (F) placebo patch of HPC-LF; (G) patch with DDEA-SLN only; (H) TP. |
Transport of LB and DDEA across Caco-2 cell monolayer
As shown in Figure 5, the permeability of LB present in TP was increased considerably when compared to the pure drug. This could be due to the presence of permeation enhancers LPG and clove oil, which loosen the lipid bilayer of the cell membrane and facilitate the movement of lipophilic drugs across the membrane. The permeability of DDEA was found to decrease when analyzed by filtering the collected media across 0.22 μm membrane. However, when the collected media were analyzed after extracting the DDEA from SLN the apparent permeability was found to be enhanced significantly. This phenomenon could be explained as the DDEA-SLN would have readily permeated through the lipoidal cell membrane but may not be completely available as free DDEA.
 | Figure 5 Papp ×10−6 of LB, DDEA, DDEA-SLN, and TP drugs from Caco-2 monoculture. |
In vivo studies with TP
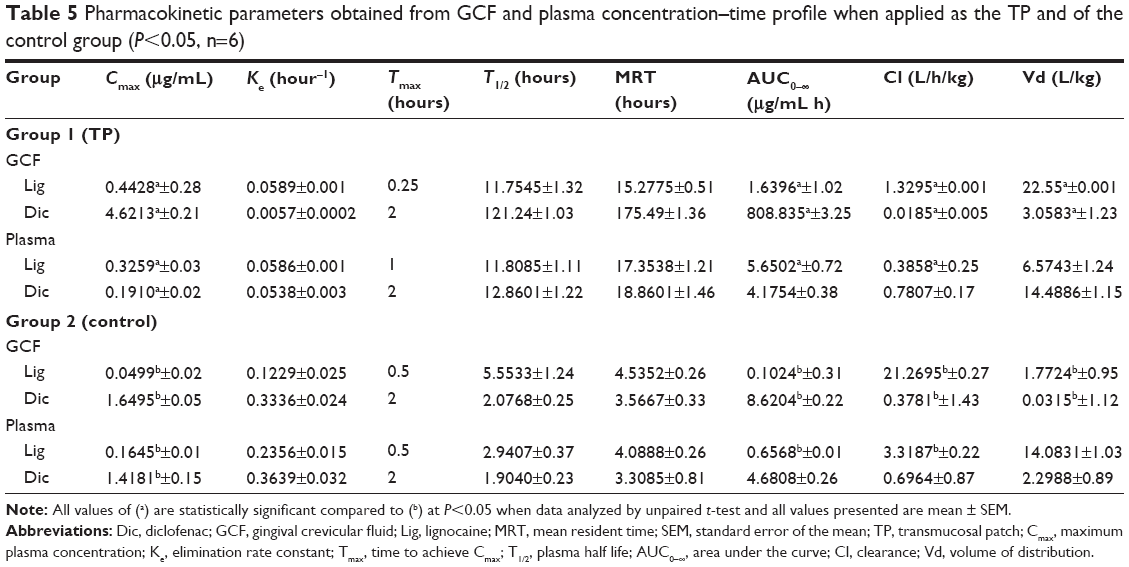
The GCF and plasma concentration–time profiles of LB and DDEA as represented in Figure 6 and Table 5 show the pharmacokinetic data. When applied as TP, the mean peak GCF concentration for Lig and Dic was 8.87-fold and 2.8-fold greater, respectively, whereas the area under the curve (AUC) of LB and DDEA in GCF was fivefold and 93-fold, respectively, greater when compared to GCF of the control. The mean peak plasma concentration of Lig was twofold greater and that of Dic was 202-fold lower, whereas the AUC of Lig was 8.6-fold greater and that of Dic was 1.1-fold lower in the case of TP when compared to the control. The GCF concentration of both the drugs was higher when compared to plasma concentration.32,33 The GCF represents the local availability of drugs present in the gingiva;33,34 also the absorption, accumulation, and permeation of Lig were rapid from TP representing comparatively higher concentration in GCF. Dic from TP was also absorbed and represented well in GCF signifying local accumulation, and hence comparatively lower plasma concentration was observed.32–34 Tissue concentrations (Table 6) of Lig and Dic were higher for the group receiving TP when compared to the control.
 | Figure 6 In vivo evaluation of TP. |
 | Table 5 Pharmacokinetic parameters obtained from GCF and plasma concentration–time profile when applied as the TP and of the control group (P<0.05, n=6) |
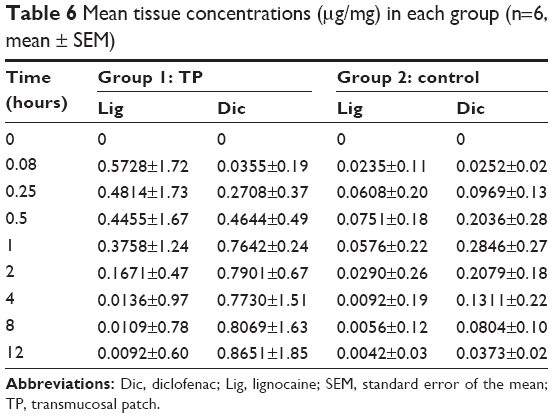 | Table 6 Mean tissue concentrations (μg/mg) in each group (n=6, mean ± SEM) |
While the Lig released immediately, there was a considerable enhancement in the duration of release of DDEA from DDEA-SLN-loaded TP. After the administration of TP, LB and DDEA were detectable until 12 hours. There was a significant enhancement in AUC in GCF, while decreased plasma concentrations, reduction in the rate of clearance, and higher volume of distribution of LB and DDEA from TP in comparison to the control with respect to GCF and plasma samples were observed. This enhancement can be explained by the prolonged retention of LB and DDEA in the gingival tissue, which could be further attributed to the mucoadhesiveness of TP, SLN, PS, surface charge of SLN, and the stabilizing effect of Pluronic F68. These factors may cumulatively contribute to an increase in half-life of LB and DDEA in comparison to Lig gel and oral DDEA. Enhancement in Cmax, T1/2, mean resident time, and AUC0–∞ of LB and DDEA confirms the prolonged tissue accumulation of LB and DDEA from TP. SLNs, because of their small size, extravagate into the tissue and get accumulated at the gingiva, further prolonging the tissue accumulation of DDEA.
Histopathological examination
The histopathological examination (Figure 7) of the gingival tissue at the completion of in vivo studies revealed that there were no structural changes, degeneration, edema, or vacuolization in either of groups when compared to control that received no medication. The epithelial layer and underlining cells of the tissue where the patch or gel was placed were free of any kind of pathological developments.
 | Figure 7 Gingival tissue morphology immediately after in vivo studies. |
In vivo pharmacodynamic studies
No response of pain exhibited as eye blink, head shake, or body shiver was shown until the sixth hour by any of the rabbits in case of group 1 that received the TP. Onset of anesthesia was considered as that time point of needle prick from the time of application of TP where the rabbits showed no response to pain. Depth of anesthesia was confirmed as the depth of the lancing device. Since the anesthetic effect was followed by analgesic effect, the duration of combined effect was considered as the duration between the time points of no pain perception to pain perception. Further, pain relief was judged on a 5-point categorical scale, where no response =0, eye blink =1, head shake =2, body vibrate =3, and any combination of response =4. Figure 8 shows the mean (n=6) response of the three groups. The positive control group that received the Lig gel and oral Dic exhibited eye blink or head shake or both from the second hour onward. Perception of pain exhibited as body shake was visible from initial time point of 2 minutes onward in the case of negative control that received no medication. Thus, the anesthetic effect existed for 1 hour when tissue Lig concentrations are also considered. Combined anesthetic and analgesic effect was seen until the sixth hour in group 1 that received the TP.
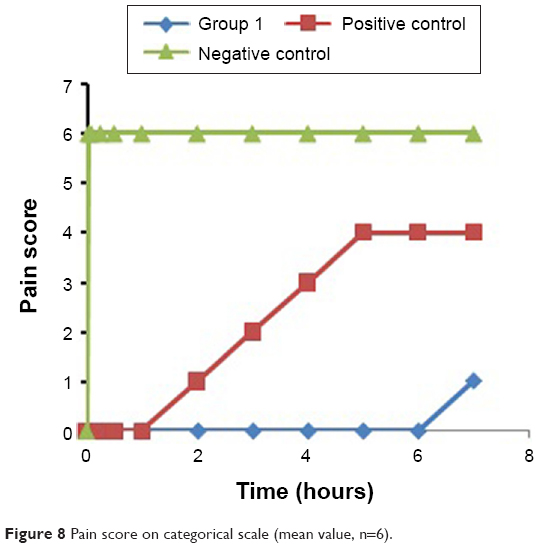 | Figure 8 Pain score on categorical scale (mean value, n=6). |
Conclusion
DDEA-SLN with PS (98.23±61 nm) and EE (84.36%±2.12%) was successfully optimized by Box–Behnken statistical design and further incorporated in HPC patch with EC backing layer along with LB. Ex vivo permeation of patch through porcine buccal mucosa observed sustained release of DDEA for 24 hours. Pharmacokinetic data obtained from in vivo studies in male New Zealand rabbits revealed immediate absorption of LB with low Tmax and prolonged drug levels of DDEA with a significant increase in bioavailability. Thus, it can be concluded that the developed TP when applied on gingival mucosa would provide immediate release of Lig followed by sustained release of Dic to combat the pain. Nonetheless, the potential of novel delivery of LB and DDEA-SLN through the patch could be safe, economical, and patient friendly.
Acknowledgments
The authors are thankful to the Principal, Al-Ameen College of Pharmacy, Bengaluru, Doctor Girish Kunte, Technology Manager for XRD and SEM study at the Centre for Nano Science and Engineering, Indian Institute of Sciences (IISc), Bengaluru, India, and Doctor Sandhya (IISc) for Fourier transform infrared spectrophotometer and DSC. Grants were received from the Department of Science and Technology, Government of India, New Delhi, India.
Disclosure
The authors report no conflicts of interest in this work.
References
Elliot KH, Paul AM, Gilbert LR. Over-the-counter analgesics and antipyretics: a critical assessment. Clin Ther. 2000;22:500–548. | ||
Coulthard P. Post-operative oral surgery pain: a review. Oral Surg. 2008;1:167–177. | ||
Priyanka A, Biswajit M. Design, development, physicochemical, and in vitro and in vivo evaluation of transdermal patches containing diclofenac diethylammonium salt. J Pharm Sci. 2002;91:2076–2089. | ||
Meechan GJ. Effective topical anesthetic agents and techniques. Dent Clin N Am. 2002;46:759–766. | ||
Schwarz C, Mehnert W, Lucks JS, Muller RH. Solid lipid nanoparticles (SLN) for controlled drug delivery. I. Production, characterization and sterilization. J Control Release. 1994;30:83–96. | ||
Cui Z, Mumper RJ. Bilayer films for mucosal (genetic) immunization via the buccal route in rabbits. Pharm Res. 2002;19(7):947–953. | ||
Subedi RK, Kanga KW, Choi HK. Preparation and characterization of solid lipid nanoparticles loaded with doxorubicin. Eur J Pharm Sci. 2009;37(3–4):508–513. | ||
Yan F, Chao Z, Zheng Y, Lin M, Lina T, Cunxian S. The effect of pluronic F 68 on nanoparticle morphology, size, cancer cell uptake, and cytotoxicity. Nanomedicine. 2010;6:170–178. | ||
Molpeceres J, Guzman M, Aberturas MR, Chacon M, Berges L. Application of central composite designs to the preparation of polycaprolactone nanoparticles by solvent displacement. J Pharm Sci. 1996;85:206–213. | ||
Nagaraju MP, Suresh S, Kshama D, Roopa SP. Evaluation of solid lipid nanoparticle formulation on pharmacokinetics, efficacy and toxicity of doxorubicin. J Nanopart Res. 2013;15:2124–2131. | ||
Nidhi M, Kusumvalli S, Kusumdevi V. Design and development of a novel transmucosal patch embedded with diclofenac diethylamine loaded solid lipid nanoparticles. J Young Pharm. 2015;7(1):45–55. | ||
Eiichi T, Kikumi W, Hiroshige O, Makoto H, Noriho K, Masahiro G. Intestinal patches with an immobilized solid-in-oil formulation for oral protein delivery. Acta Biomater. 2012;8(2):653–658. | ||
Rahman Z, Zidan AS, Khan MA. Non-destructive methods of characterization of risperidone solid lipid nanoparticles. Eur J Pharm Biopharm. 2010;76(1):127–137. | ||
Kesavan B, Jayaraman A, Velayutham R, Vobalaboina V, Yamsani MR. Lipid nanoparticles for transdermal delivery of flurbiprofen: formulation, in vitro, ex vivo and in vivo studies. Lipids Health Dis. 2009;8:1–15. | ||
Holpuch AS, Hummel GJ, Tong M, et al. Nanoparticles for local drug delivery to the oral mucosa: proof of principle studies. Pharm Res. 2010;27(7):1224–1236. | ||
Supriya SS, Nilesh SS, Sagar S, Vilasrao K. Mucoadhesive bilayered patches for administration of sumatriptan succinate. AAPS PharmSciTech. 2008;9(3):909–916. | ||
Eduardo RJ, Maria BB, Juliana MM. HPLC assay of lidocaine in in vitro dissolution test of the poloxamer 407 gels. Brazil. J Pharm Sci. 2002;38(1):107–111. | ||
Avani RP, Manojkumar ST. Clinical effect of subgingivally delivered simvastatin in the treatment of patients with chronic periodontitis: a randomized clinical trial. J Periodontal. 2010;81(2):214–222. | ||
Liew V, Mack G, Tseng P, Cvejic M, Hayden M, Buchanan N. Single-dose concentrations of tinidazole in gingival crevicular fluid, serum, and gingival tissue in adults with periodontitis. J Dent Res. 1991;70(5):910–912. | ||
Nagaraju MP, Suresh S, Kshama D, et al. Comparison and correlation of in vitro, in vivo and in silico evaluations of alpha, beta and gamma cyclodextrin complexes of curcumin. J Incl Phenom Macrocycl Chem. 2014;78:471–483. | ||
Nagaraju MP, Suresh S, Kshama D, Roopa SP. Combinatorial therapeutic regimen of lipid based curcumin and doxorubicin nanoparticles: implications on antitumor efficacy and drug-induced toxicity. J Nanopharm Drug Deliv. 2014;2:1–15. | ||
Pankaj P, Mangal N. Formulation and evaluation of lidocaine lipid nanosystems for dermal delivery. AAPS PharmSciTech. 2009;10(3):985–992. | ||
Bunjes H, Unruh T. Characterization of lipid nanoparticles by differential scanning calorimetry, X-ray and neutron scattering. Adv Drug Deliv Rev. 2007;59:379–402. | ||
Chrysantha F, Rainer HM. Effect of light and temperature on zeta potential and physical stability in solid lipid nanoparticle (SLN™) dispersions. Int J Pharm. 1998;168(2):221–229. | ||
Schwartz JB, Flamholz JR, Press RH. Computer optimization of pharmaceutical formulations I: general procedures. J Pharm Sci. 1973;62(7):1165–1167. | ||
Welch WJ. Computer aided design of experiments for response surface estimation. Technometrics. 1984;26(3):217–224. | ||
Souto EB, Wissing SA, Barbosa CM, Müller RH. Development of a controlled release formulation based on SLN and NLC for topical clotrimazole delivery. Int J Pharm. 2004;278(1):71–77. | ||
Wertz PW, Squier CA. Cellular and molecular basis of barrier function in oral epithelium. Crit Rev Ther Drug Carrier Syst. 1991;8(3):237–269. | ||
Shen Q, Wang Y, Zhang Y. Improvement of colchicine oral bioavailability by incorporating eugenol in the nanoemulsion as an oil excipient and enhancer. Int J Nanomed. 2011;6:1237–1243. | ||
Westesen K, Bunjes H. Do nanoparticles prepared from lipids solid at room temperature always possess a solid lipid matrix. Int J Pharm. 1995;115(1):129–131. | ||
Abdelbary G, Fahmy RH. Diazepam-loaded solid lipid nanoparticles: design and characterization. AAPS PharmSciTech. 2009;10(1):211–219. | ||
Tözüm TF, Yildirim A, Cağlayan F, Dinçel A, Bozkurt A. Serum and gingival crevicular fluid levels of ciprofloxacin in patients with periodontitis. J Am Dent Assoc. 2004;135(12):1728–1732. | ||
Sakellari D, Goodson JM, Kolokotronis A, Konstantinidis A. Concentration of 3 tetracyclines in plasma, gingival crevice fluid and saliva. J Clin Periodontol. 2000;27(1):53–60. | ||
Sarkiala-Kessel EM, Järvinen A, Nokelainen M, Asikainen S. Concentrations of tinidazole in gingival crevicular fluid and plasma in dogs after multiple dose administration. J Vet Pharmacol Ther. 1996;19(3):171–175. |
 © 2016 The Author(s). This work is published and licensed by Dove Medical Press Limited. The
full terms of this license are available at https://www.dovepress.com/terms
and incorporate the Creative Commons Attribution
- Non Commercial (unported, 3.0) License.
By accessing the work you hereby accept the Terms. Non-commercial uses of the work are permitted
without any further permission from Dove Medical Press Limited, provided the work is properly
attributed. For permission for commercial use of this work, please see paragraphs 4.2 and 5 of our Terms.
© 2016 The Author(s). This work is published and licensed by Dove Medical Press Limited. The
full terms of this license are available at https://www.dovepress.com/terms
and incorporate the Creative Commons Attribution
- Non Commercial (unported, 3.0) License.
By accessing the work you hereby accept the Terms. Non-commercial uses of the work are permitted
without any further permission from Dove Medical Press Limited, provided the work is properly
attributed. For permission for commercial use of this work, please see paragraphs 4.2 and 5 of our Terms.