Back to Journals » International Journal of Nanomedicine » Volume 11
Development of ibuprofen-loaded nanostructured lipid carrier-based gels: characterization and investigation of in vitro and in vivo penetration through the skin
Authors Sütő B, Berkó S ![]() , Kozma G
, Kozma G ![]() , Kukovecz, Budai-Szűcs M, Erős G, Kemény L
, Kukovecz, Budai-Szűcs M, Erős G, Kemény L ![]() , Sztojkov-Ivanov A, Gaspar R
, Sztojkov-Ivanov A, Gaspar R ![]() , Csányi E
, Csányi E ![]()
Received 26 October 2015
Accepted for publication 17 December 2015
Published 30 March 2016 Volume 2016:11 Pages 1201—1212
DOI https://doi.org/10.2147/IJN.S99198
Checked for plagiarism Yes
Review by Single anonymous peer review
Peer reviewer comments 2
Editor who approved publication: Dr Thomas Webster
Blanka Sütö,1 Szilvia Berkó,1 Gábor Kozma,2 Ákos Kukovecz,2,3 Mária Budai-Szucs,1 Gábor Erös,4,5 Lajos Kemény,4 Anita Sztojkov-Ivanov,6 Róbert Gáspár,6 Erzsébet Csányi1
1Department of Pharmaceutical Technology, Faculty of Pharmacy, 2Department of Applied and Environmental Chemistry, 3MTA-SZTE “Lendület” Porous Nanocomposites Research Group, 4Department of Dermatology and Allergology, 5Department of Oral Biology and Experimental Dental Research, 6Department of Pharmacodynamics and Biopharmacy, University of Szeged, Szeged, Hungary
Abstract: An ibuprofen-loaded nanostructured lipid carrier (IBU-NLC) was developed for enhanced skin penetration to improve the treatment of osteoarthritis and other musculoskeletal diseases. The mean particle size was 106 nm, with a spherical morphology, a smooth surface, and a zeta potential of −18.4 mV. X-ray diffraction studies revealed the amorphous state of the lipid matrix. Both Raman spectroscopy and Fourier transformation infrared analysis indicated no major shifts in the spectra of the formulations, which suggest rapid drug dissolution from the nanoparticles. The drug loading was 9.85%, and the entrapment efficiency was 98.51%. In vitro release of the NLC dispersion, in vitro permeation, and in vivo animal studies of IBU-NLC gel all confirmed that the permeation of IBU was significantly better than that of a reference after 6 hours. In conclusion, IBU-NLC gel is of great potential to enhance drug permeation through the skin and hence the efficacy of the treatment of chronic joint inflammation.
Keywords: ibuprofen, nanostructured lipid carriers, skin penetration, SKH-1 hairless mice, osteoarthritis
Introduction
Osteoarthritis (OA), one the most prevalent chronic joint diseases, is accompanied by considerable pain.1,2 With the current aging of the population and the epidemic of obesity, the incidence of OA is rising. The main clinical features, the pain and the loss of function, lead to treatment by nonpharmacological, pharmacological, and surgical approaches.1 In a study involving 3,906 patients above the age of 55 years, 67% of the women and 54.8% of the men suffered from radiographic OA in at least one hand joint.1,3 Another study confirmed that some 40% of the total population aged >70 years suffer from OA, the most common form of arthritis.2,4 Since pain and inflammation are among the most important causes of a decline in the life quality, the primary aim of the currently available treatments is to relieve these. The American College of Rheumatology has published recommendations for the use of nonpharmacologic and pharmacologic therapy in OA. The use of nonsteroidal anti-inflammatory drugs is highly recommended.5
Ibuprofen (IBU) is a nonsteroidal anti-inflammatory drug that was introduced in the 1960s to replace acetylsalicylic acid in the treatment of rheumatoid arthritis, providing a more efficacious therapy and proving more tolerable for the patients. It is administered orally or topically in the form of gels, creams, and ointments. The advantages of its local application over their systemic use include the avoidance of adverse events (bleeding and possible ulceration of the gastric mucosa) and the high concentration of the drug at the site where it is needed. The drug, usually administered in its racemic form,6 is relatively lipophilic (log P=4.0) with low water solubility (21 mg/L at 25°C).6,7 The characteristics of the permeation of IBU through the human skin have been reported by a number of research groups.8–13 Earlier studies revealed that the topical therapeutic effectiveness of a drug is a function both of its penetration through the skin and of its potency.7 IBU is less potent than diclofenac, for example, but the higher flux of IBU through the skin means that it is a better candidate for topical delivery, although it is still difficult to achieve its effective permeation by transdermal delivery.14 The aforementioned physicochemical properties of IBU have hampered the preparation of a formulation satisfying the requirements of a long-lasting treatment for a chronic disease such as OA.
Nanostructured lipid carriers (NLCs) may serve as a solution to overcome the limitations of the dermal permeation of IBU. This drug delivery system offers numerous advantages for topical application.15–19 NLCs can comprise physiological and biodegradable lipids, which were earlier reported to possess low systemic toxicity and low cytotoxicity.20 The small size of the lipid nanoparticles ensures close contact between the lipid particles and the lipid bilayer of the stratum corneum, resulting in the penetration of an increased amount of drug into the skin. In consequence of their solid lipid matrix, controlled release is possible from these carriers. This becomes important when prolonged release of the drug is required. Burst release of the drug incorporated in the NLC system may also be achieved.21 As a result of the film formation that occurs after topical application, occlusive properties have also been reported for NLC formulations,22,23 and these favor further enhanced penetration through the dermal layers.
The aim of the present study was to develop a hydrogel based on an IBU-loaded NLC (IBU-NLC) system, with improved drug release properties (for the potential treatment of OA or musculoskeletal disorders) as compared with those of a traditional IBU gel formulation and to characterize this hydrogel by means of techniques such as X-ray diffraction (XRD), atomic force microscopy (AFM), Raman spectroscopy, and Fourier transformation infrared (FT-IR) spectroscopy in order to attain a better understanding of its properties.
Materials and methods
Materials
IBU was provided by PannonPharma Ltd. (Pécsvárad, Hungary), Witepsol E85 and Miglyol 812 were gifts by Sasol GmbH (Hamburg, Germany), and Lutrol F68 was kindly supplied by BASF SE Chemtrade GmbH (Ludwigshafen, Germany). Acetonitrile (high-performance liquid chromatography [HPLC] grade), K2HPO4, KH2PO4, and H3PO4 (85%) (analytical grade) were purchased from VWR Int Ltd (Radnor, PA, USA). Carbopol 971P NF was supplied by Azelis Ltd (Budapest, Hungary). Macrogol 400 was obtained from Hungaropharma Ltd (Budapest, Hungary). Purified water (HPLC grade) produced with a TKA Smart2Pure system (TKA GmbH, Niederelbert, Germany) was used to prepare all the formulations.
Preparation of the samples
The NLC formulations were prepared by a hot high-pressure homogenization method,17,18,24,25 using an Emulsiflex C-3 High Pressure Homogenizer (Avestin Europe GmbH, Mannheim, Germany). Briefly, 1% IBU was dissolved in the mixture of the solid and liquid lipids (Witepsol E85 and Miglyol 812, ratio 7:3) at ~10°C above the melting point of the solid lipid. The surfactant, Lutrol F68, was dissolved in purified water at the same temperature. The aqueous phase was added to the lipid phase, and the mixture was stirred with a Heidolph DIAX 900 homogenizer (Heidolph Instruments GmbH & Co. KG, Schwabach, Germany) for 1 minute at 12,500 rpm. The pre-emulsion was subjected to high-pressure homogenization, applying five cycles at 600 bar and 65°C. The hot oil-in-water pre-emulsion was cooled in an ice bath to recrystallize the lipid and form the NLC.
An IBU suspension containing 1% of IBU dispersed in purified water was prepared as a reference for in vitro diffusion studies of IBU-NLC. For the in vitro penetration and in vivo permeation studies, IBU-NLC was gelled with a previously prepared 3% Carbopol 971P NF gel in a ratio of 1:1. For comparison, 0.5% IBU was dissolved in Macrogol 400 and gelled with the same polymer.
Particle size characterization and zeta potential measurements
The particle sizes of the prepared blank NLC and IBU-NLC formulations were analyzed by photon correlation spectroscopy (PCS) (Zetasizer Nano ZS; Malvern Instruments, Malvern, UK). The presence of particles in the micrometer range was excluded by laser diffraction (LD) (Mastersizer 2000; Malvern Instruments). The diameters of 10%, 50%, and 90% (d(0.1), d(0.5), and d(0.9)) of the particles were evaluated. The medium was purified water.
To obtain information concerning the stabilities of the prepared samples, their zeta potentials were determined with a Zetasizer Nano ZS (Malvern Instruments). The medium was double-distilled water.
Atomic force microscopy
The particle size of the blank and IBU-NLC samples was also determined by AFM for comparison with the results obtained by PCS and LD measurements. The tapping mode was used on a SOLVER Scanning Probe Microscope (NT-MDT Co, Moscow, Russia) under ambient conditions. PPP-NVHAuD-10 (NANOSENSORS™; NanoWorld AG, Neuchatel, Switzerland) AFM tips with a nominal radius of curvature of 2 nm and a length of 15 μm were used.
XRD analysis
Diffractograms of the raw materials (IBU, Witepsol E85, and Lutrol F68), the melted physical mixtures of the raw materials with or without IBU, and the blank NLC and IBU-NLC were obtained with a Bruker D8 Advance diffractometer (Bruker AXS GmbH, Billerica, MA, USA) system with Cu K λI radiation (λ =1.5406 Å). Each sample was scanned at 40 kV and 40 mA in the interval 3°–40° 2θ, at a scanning speed of 0.1/second and a step size of 0.010°.
DXR Raman spectroscopy measurements
IBU, Witepsol E85, Miglyol 812, and Lutrol F68 (as standard components of the NLC), blank, and IBU-NLC samples were characterized. Raman spectra were recorded with a Thermo Fisher DXR Dispersive Raman spectrometer (Thermo Fisher Scientific Inc., Waltham, MA, USA) attached to an Olympus MPlan ×10/0.25 BD microscope (Olympus Corporation, Tokyo, Japan). At least five measurements were made at 532 nm with the in-built fluorescence and cosmic ray correction to ensure low background noise. Measurement conditions were as follows: power on the surface of the sample, 3 mW; diameter spot (×10 magnification objective), 3 μm; and aperture of the pinhole with 50 μm. Samples were packed onto an aluminum sample holder, and spectra were collected for a total of 48 scans at a spectral resolution of 4 cm–1. For the characterization of IBU and NLC samples, the full spectral range (3,000–200 cm−1) was used. IBU-NLC and blank NLC compositions were investigated by Raman mapping to localize the IBU inside the formulation. To identify the individual components in the Raman spectra, the vibrational chemical images were processed by a multivariate curve resolution – alternating least squares chemometric method. The NLC compositions were dried overnight on the aluminum surface to stabilize the NLC droplets for the Raman analysis. The 200–220 μm ×60 μm flat surfaces were analyzed at a step size of 10 μm. The acquisition time was 3 seconds per spectrum. Twenty-four spectra were accumulated and averaged at each measured point, ensuring an acceptable signal-to-noise ratio. The Raman spectra were then normalized to eliminate the intensity deviation between the measured areas.
FT-IR spectroscopy
FT-IR measurements of the pure drug and the NLC dispersions (blank and IBU-NLC) were performed with a Bio-Rad Digilab Division FTS-65A/896 FTIR spectrometer (Bio-Rad Laboratories Inc., Hercules, CA, USA) in the wavelength range 4,000–400 cm−1, 128 scan size, and at an optical resolution of 4 cm−1. The operating conditions were Harrick’s Meridian SplitPea single reflection, diamond, and attenuated total reflectance accessory. The spectrum of the drug-loaded composition was processed to deconvolution in the range 1,800–1,660 cm−1 by a curve-fitting algorithm with a Gaussian–Lorentzian function. The best curve-fitting procedure was performed by iterative fits toward a minimum standard error. Thermo Scientific GRAMS/AI Suite software (Thermo Fisher Scientific Inc.) was used for the spectral analysis.
Drug loading and entrapment efficiency measurements
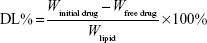
Drug loading (DL%) and entrapment efficiency (EE%) were evaluated by an indirect method, with measurement of the free drug concentration in the external aqueous phase:26,27
|
|
|
|
where W is the weight in milligrams.
One hundred microliters of the IBU-NLC sample and 400 μL of phosphate-buffered saline (PBS) were transferred into a Nanosep 3K ultrafilter Eppendorf tube having an molecular weight cut-off of 3 kDa (Pall Co, Port Washington, NY, USA) and centrifuged at 5,055 rpm for 10 minutes. The solution obtained was filtered through a 0.20 μm polyethersulfone syringe membrane filter and injected directly into the HPLC system.
The IBU content was quantified with an Agilent 1260 HPLC system (chimically pure [QP], diode array detector, alternating least squares). IBU was measured on a 100 mm ×4.6 mm column packed with 3 μm Luna C18, 100 Å (Phenomenex Inc., Torrance, CA, USA). Isocratic elution was performed with 40:60 (v/v) MeCN-PBS (0.025 M) (pH adjusted to 2.7 with orthophosphoric acid) at a flow rate of 1 mL/min. The buffer was prepared from KH2PO4 and K2HPO4. Before use, the eluent was degassed. The run time was 10 minutes. Detection was performed via the absorption at 215±4 nm. Ten microliters of sample was injected, and the elution was carried out at a sample temperature of 27°C and a column temperature of 35°C. Qualitative determination was achieved by comparison with the spectra of standards. The stock solution of IBU (0.5 mg/mL) was prepared in methanol and stored at 4°C. Working standards (1, 5, 10, 25, 50, and 100 μg/mL) were prepared freshly by diluting the stock solution with the mobile phase prior to the HPLC analysis. Calibration plots were freshly prepared and were highly linear (R2>0.9998) in the concentration range 1.0–100.0 μg/mL (n=3–4).
In vitro release, in vitro permeation, and in vivo animal studies
The in vitro drug release study was carried out by using the dialysis bag method.24,28,29 Briefly, 200 μL of the IBU-NLC formulation was sealed in a Spectra/Por® 4 dialysis membrane (Spectrum Laboratories, Inc., Rancho Dominguez, CA, USA), with Spectra/Por® Closures (Spectrum Laboratories, Inc.), and placed into 25 mL of PBS (pH 7.4). The system was held at 37°C to mimic in vivo conditions and continuously stirred at 450 rpm. At selected time intervals during 6 hours, 1 mL of bulk solution was taken. The withdrawn samples were each replaced by 1 mL of PBS to maintain sink conditions. Blank NLC served as blank and was analyzed in the same way as IBU-NLC. A previously prepared 1% IBU suspension was subjected to the same procedure, to serve as a reference.
The ex vivo permeation studies were performed with a vertical Franz diffusion cell system (Hanson Microette TM Topical & Transdermal Diffusion Cell System; Hanson Research Corporation, Chatsworth, CA, USA). A 0.300–0.400 g of 0.5% IBU-NLC gel or 0.5% IBU gel (which served as a reference) was measured as donor phase on pretreated excised human skin10,30 supported by a Porafil® CM membrane (pore diameter 0.45 μm; Macherey-Nagel GmbH & Co. KG, Düren, Germany). The effective diffusion surface area was 1.3 cm2. PBS (pH 7.4) was used as acceptor phase. The rotation of the magnetic stirbar was set to 450 rpm. The receptor medium was thermostated at 37°C±0.5°C to ensure the physiological skin temperature, 32°C at the site of the sampling. Experiments were performed for 6 hours. Samples of 0.8 mL were taken from the acceptor phase at given times by the autosampler (Hanson Microette Autosampling System; Hanson Research Corporation) and replaced with fresh receiving medium.
The samples from both experiments were analyzed at 263 nm with a Unicam Evolution 201 UV/Vis spectrophotometer (Thermo Fisher Scientific Inc.).
The in vivo animal studies were performed on 11- to 13-week-old male SKH-1 hairless mice (body weight: 28–34 g). The procedures and protocols applied were approved by the Ethical Committee for the Protection of Animals in Scientific Research at the University of Szeged (license number: V./145/2013) and the Ethical Committee of the Human Investigation Review Board at Albert Szent-Györgyi Clinical Centre, University of Szeged, 83/2008. The modified dorsal skin fold chamber was used to determine IBU penetration through living animal skin by a previously described method.31 This experimental setup provides an effective means of performing in vivo examinations of permeation.
The mice were randomly allocated into the following groups. The animals in group 1 (n=5) received IBU gel. In group 2 (n=7), IBU-NLC gel was used. 0.1 g of the study formulation was applied to the skin. One milliliter of PBS (pH 7.37) was added as the chamber acceptor phase. The observation period lasted for 6 hours. At given time points, the PBS was replaced by fresh PBS. The concentration of the penetrated drug was measured by means of HPLC. Previous tests of the blank NLC gel indicated that the components of this gel do not interfere with HPLC detection of the active agent. At the end of the experiment, the animals were euthanized with an overdose of ketamine.
The HPLC instrumentation included a Shimadzu CBM-20A/20Alite system controller, a Shimadzu LC-20AD solvent delivery system, a Shimadzu DGU-20A3 on-line degasser, a Shimadzu SPD-M20A UV/VIS photodiode array detector, and a Shimadzu CTO-20A column oven (Shimadzu Corp, Kyoto, Japan). The chromatographic system was equipped with a Rheodyne Model 7725i injector (IDEX Corp, Lake Forest, IL, USA) with a 20 μL loop. The chromatographic data were collected and processed by means of Shimadzu LCsolution software (Shimadzu Corp).
Statistical analysis
The results were evaluated and analyzed statistically with the two-way analysis of variance test (Bonferroni’s multiple comparison), using Prism for Windows 5 software (GraphPad Software Inc., La Jolla, CA, USA). The data are the averages of the results of at least five experiments ± standard deviation (*P<0.05, **P<0.01, ***P<0.001, and ****P<0.0001 versus the control).
Results
Results of particle size and zeta potential measurements
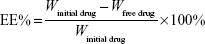
Particle size determination by PCS demonstrated that both samples were in the nanometer range, with an effective particle size (Zave) of 114 nm for the blank NLC and 106 nm for IBU-NLC. LD measurements confirmed that larger particles (>1 μm) were not present in the formulations, and 90% of the particles measured <205 nm. The surface charge was negative for both the blank (−15.9 mV) and IBU-NLC (−18.4 mV) (Table 1).
 | Table 1 Particle size, zeta potential, polydispersity index, Span value, and average Z (height) value of the blank NLC and IBU-NLC formulations (the measurements were performed in triplicate, n=3) |
Results of AFM measurements
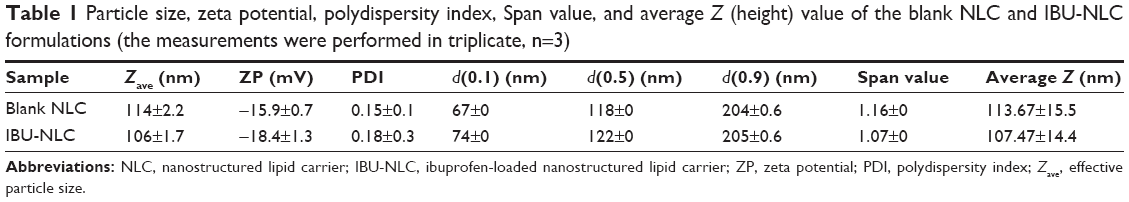
Both samples were measured by AFM to confirm the PCS and LD results. The data were evaluated by grain analysis, and size distribution histograms were made (Figure 1A and B). The Z values of most of the blank NLC particles were between 109 and 124 nm, while those of the IBU-NLC were between 95 and 118 nm (Figure 1C and D), verifying the PCS and LD results.
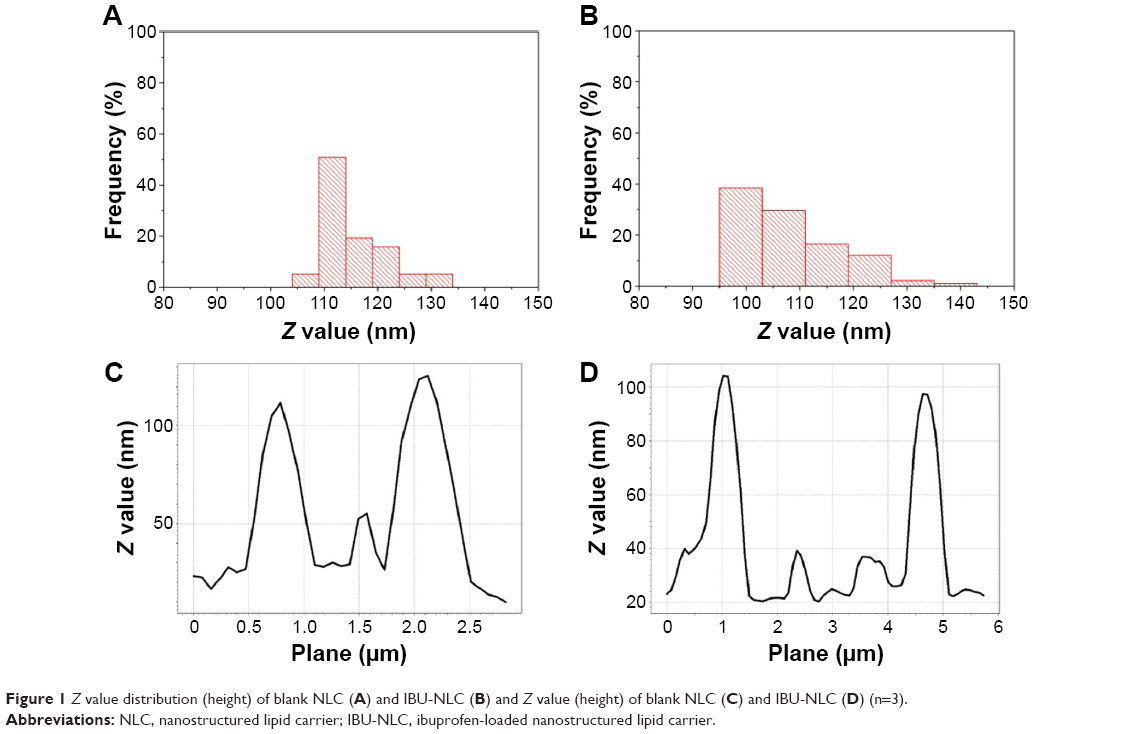 | Figure 1 Z value distribution (height) of blank NLC (A) and IBU-NLC (B) and Z value (height) of blank NLC (C) and IBU-NLC (D) (n=3). |
AFM has been widely used to acquire information on the size, shape, and surface morphology of nanoparticles.32 In all the present samples, the separated lipid particles were spherical or nearly spherical with a smooth surface (Figure 2). No major differences were detected between the blank and IBU-NLC samples, although some larger lipid agglomerates were found in the IBU-NLC. This is probably due to the sample preparation process: the pretreatment (sonication) was unable to disperse the previously dried lipid particles completely.
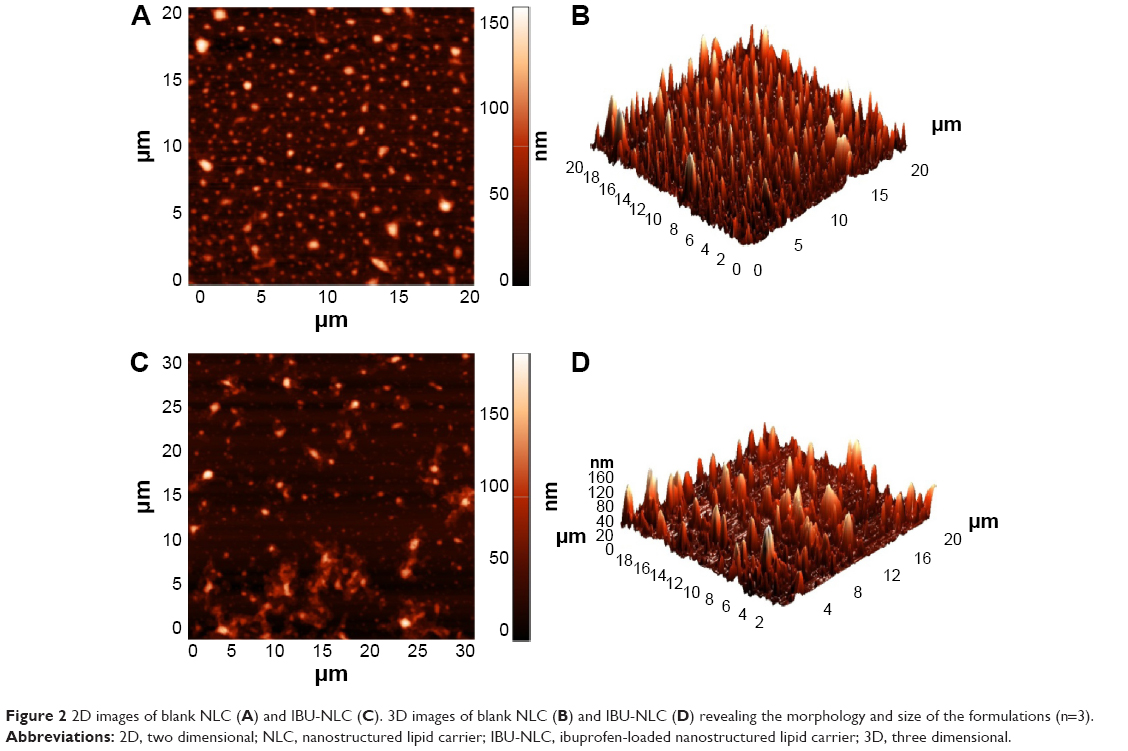 | Figure 2 2D images of blank NLC (A) and IBU-NLC (C). 3D images of blank NLC (B) and IBU-NLC (D) revealing the morphology and size of the formulations (n=3). |
Results of XRD
XRD measurements were carried out to determine the possible changes in the crystallinity of the components during the hot high-pressure homogenization procedure. Diffractograms of the pure, untreated components (IBU, Witepsol E85, and Lutrol F68) are depicted in Figure 3. Diffractograms were also recorded of the melted lipid mixture (Witepsol E85 and Miglyol 812 in a ratio of 7:3) with or without IBU, the melted total physical mixture, the blank, and IBU-NLC. The crystallinity of the solid lipid (plot 2) decreased to such an extent after the addition of the excipients (plots 4 and 6) and the drug (plot 5) that the material became amorphous in the cases of the prepared blank (plot 7) and IBU-NLC (plot 8) formulations. This suggests that both of the NLC formulations have a structureless solid amorphous matrix and belong to the amorphous NLC type.33 The XRD pattern of pure racemic IBU (plot 1) exhibited characteristic diffraction peaks at various diffraction angles (6°, 12.3°, 16°, 20.4°, and 22.3° 2θ), indicating the presence of crystallinity.34 These peaks also appeared in the plot of the melted mixture of the lipid matrix and the active pharmaceutical ingredient (plot 5) but were absent from those of the total mixture (plot 6) IBU-NLC (plot 8).
 | Figure 3 XRD diffractograms of IBU (1), Witepsol E85 (2), Lutrol F68 (3), bulk mixture of Witepsol E85:Miglyol 812 mixture in ratio 7:3 (4), Witepsol E85:Miglyol 812:IBU mixture in ratio 7:3:1 (5), Witepsol E85:Miglyol 812:IBU:Lutrol F68 mixture in ratio 7:3:1:5 (6), blank NLC (7) and IBU-NLC (8). |
Results of DXR Raman spectroscopy measurements
Raman spectroscopy was employed to confirm the physical state of the IBU and to study the possible physicochemical interactions between the components. The Raman spectra of dried free racemic IBU, Lutrol F68, Witepsol E85, and Miglyol 812 are presented in the wavenumber range 2,000–200 cm−1 in Figure 4A. As model solutions, IBU was dissolved in Miglyol 812 in two concentrations (10% and 25%, w/w), to observe the principal differences in the physical state of the IBU (Figure 4B). The spectra of IBU, the blank NLC, and IBU-NLC are presented in Figure 4C.
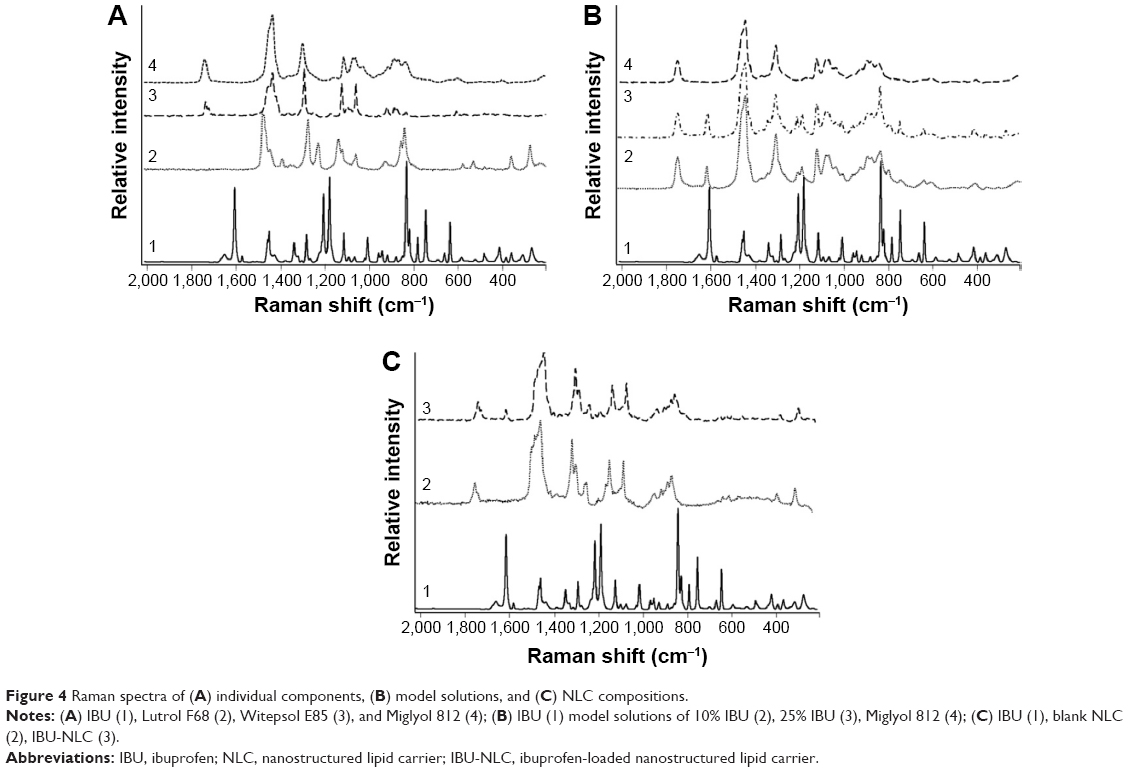 | Figure 4 Raman spectra of (A) individual components, (B) model solutions, and (C) NLC compositions. |
The selected Raman bands of IBU, the IBU-containing Miglyol model solutions, and the IBU-NLC composition with the vibrational assignments (cm−1) are presented in Table 2. The chemical structure of Miglyol is very similar to those of the other lipid components, and therefore, the bands from the IBU-NLC sample, Raman spectrum characteristic of Miglyol 812, could be overlapped by the bands characteristic of other lipids.
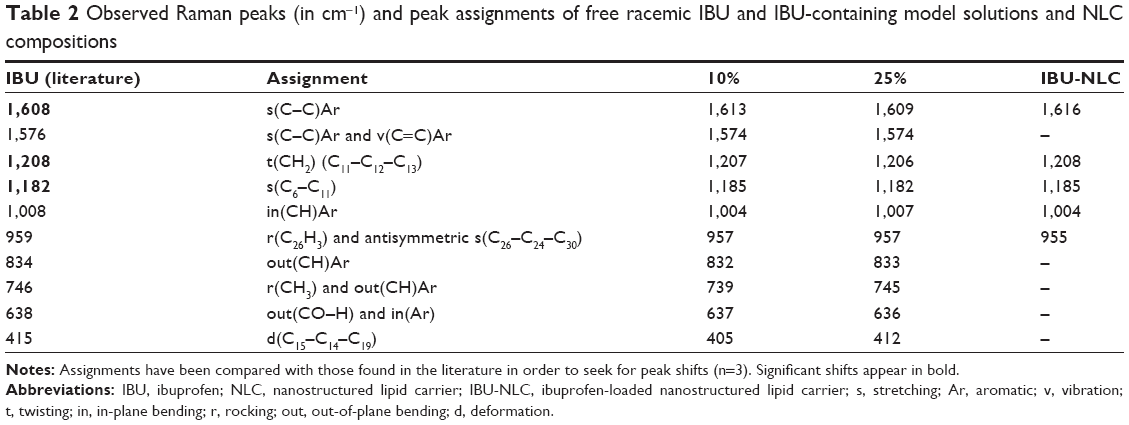 | Table 2 Observed Raman peaks (in cm−1) and peak assignments of free racemic IBU and IBU-containing model solutions and NLC compositions |
The IBU spectrum exhibited characteristic peaks at 1,608, 1,576, 1,208, 1,182, 1,008, 959, 834, 746, 638, and 415 cm−1. These peaks are attributed mainly to aryl ring stretching and C24-Ar-C11 conformational stretching and wagging. Medium sharp peaks are attributed to Ar and Ar-CH in-plane and out-of-plane bending. In spite of the many free racemic IBU peaks, the Raman spectra of the model solutions and the NLC composition were characteristic of the auxiliary materials. The medium-intensity IBU peaks at 1,452, 1,341, 1,116, 943, 820, 662, 784, and 269 cm−1 (Cx–Hy bending, twisting, or rocking) were absent from the spectra of the IBU-containing model solutions and NLC composition. Comparison of the Raman peaks of the IBU and the model solutions (10% and 25%) revealed small shifts in the wavenumbers of the characteristic IBU peaks. Moreover, the Raman spectrum of the IBU-NLC composition (with less characteristic IBU peaks) revealed the same small shifts, indicating the occurrence of weak interactions between IBU and the lipids. A significant change in the spectrum of interacted IBU was the shift in the peak corresponding to the aryl C–C stretching from 1,608 to 1,609–1,616 cm−1. This latter shift indicates that the aryl ring is affected by the interaction with the lipid molecules and not the C=O group of IBU. In Table 3, the Raman spectra of the lipid components are compared with those of IBU-NLC and the blank NLC. The lipid components used in this study have similar chemical structures and therefore similar Raman bands. The Raman spectra of the lipid components in the range 3,000–200 cm−1 displayed characteristic peaks, which are assigned to vibrations of the fatty acid hydrocarbon chains. The sharp and intense peaks at 2,881 and 2,850 cm−1 and the medium peaks at 1,128 and 1,062 cm−1 in all the NLC compositions confirmed the ordered acyl chains in the lipid structure. The incorporation of IBU did not lead to the disappearance of the sharp bands at 2,881 and 2,850 cm−1 in the Raman spectrum of IBU-NLC.
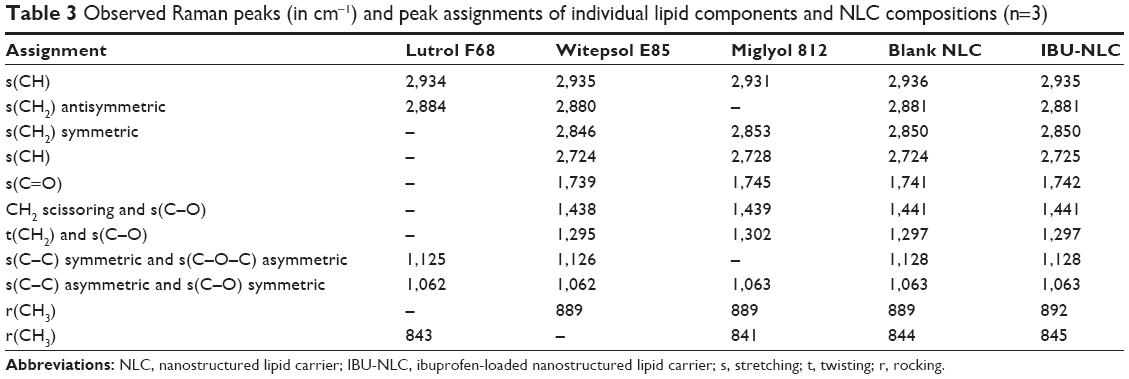 | Table 3 Observed Raman peaks (in cm−1) and peak assignments of individual lipid components and NLC compositions (n=3) |
In order to confirm the homogeneity of the IBU, Raman mapping of the NLC was performed. Figure 5A shows the distribution map of IBU in the NLC composition at ×10 magnification. The characteristic bands obtained for IBU at ~1,608 cm−1 were used to visualize the spatial distribution of IBU from Raman chemical mapping. The IBU was found homogeneously in the dried, round areas. The purpose of this analysis was to estimate the distribution of the individual ingredients in the scanned area. The spectra of the estimated “Components” were compared with the reference ingredient spectra (Figure 5B). The spectra of components 1 and 4 were identified as the Raman spectrum of Lutrol F68, with characteristic Raman band regions of 1,750–1150, 900–750, and 400–200 cm−1. The resolved spectrum of component 2 does not correspond to the reference spectra but contains similar Raman bands to those of Miglyol 812. The spectrum of component 2 displays several other peaks; the reason may be the low signal-to-noise ratio. Component 3 corresponds to Witepsol E85, with very characteristic Raman band regions of 1,500–1,400 and 1,150–1,000 cm−1. The Raman spectra of each component contain the characteristic Raman peaks of IBU at 1,614–1,608 cm−1.
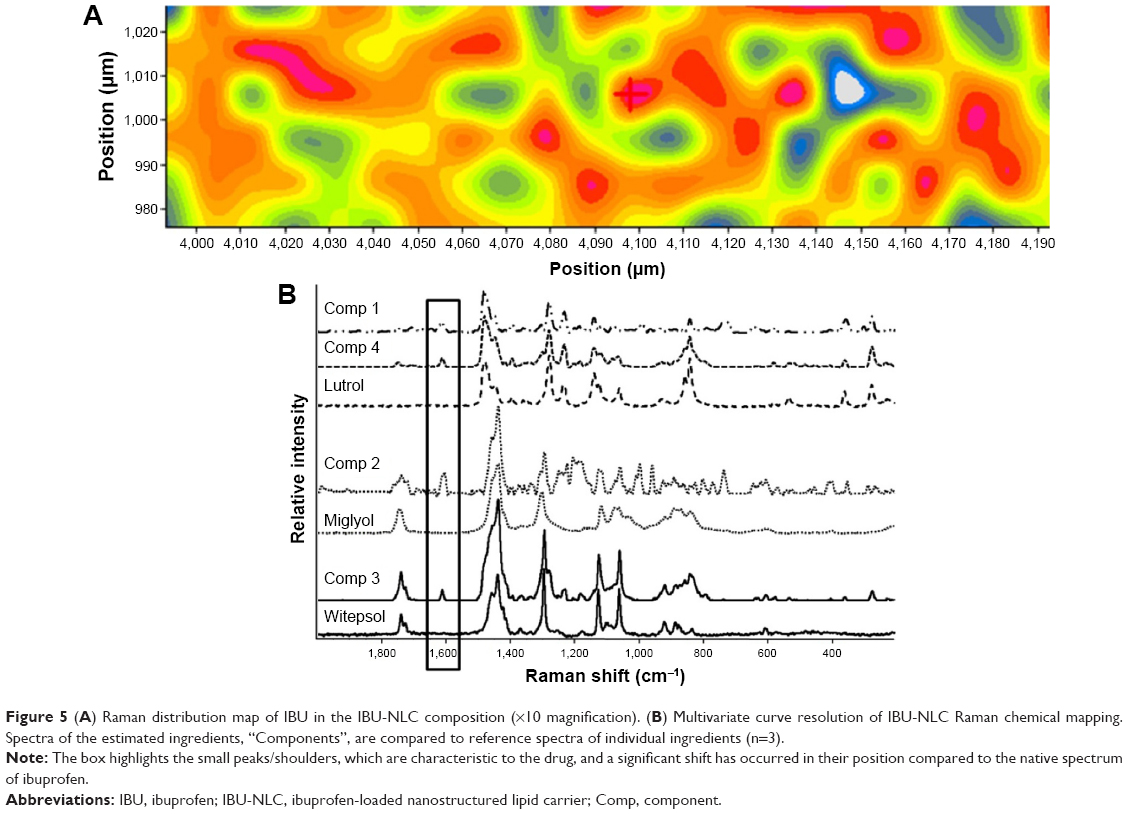 | Figure 5 (A) Raman distribution map of IBU in the IBU-NLC composition (×10 magnification). (B) Multivariate curve resolution of IBU-NLC Raman chemical mapping. Spectra of the estimated ingredients, “Components”, are compared to reference spectra of individual ingredients (n=3). |
Results of FT-IR
The FT-IR spectra of the excipients, blank NLC, and IBU-NLC were recorded to obtain information about the possible interactions between IBU and the matrix of the nanoparticles. Analysis of the spectrum of IBU-NLC clearly indicates that there are no strong interactions between the drug and the excipients (Figure 6A). Comparison of the FT-IR spectra of the blank NLC and the drug-loaded IBU-NLC at 1,700 and 1,550 cm−1 revealed two peaks (which are characteristic of the drug) as shoulders in the spectrum of IBU-NLC (Figure 6A, marked peaks). After the deconvolution of the wavelength range 1,800–1,660 cm−1, the characteristic peak of IBU at 1,721 cm−1, described as the vibration of the C=O bond,35 could be characterized (Figure 6B). The boxes in Figure 6 highlight the small peaks/shoulders, which are characteristic to the drug, and a significant shift has occurred in their position compared to the native spectrum of ibuprofen. The intensity of this peak is low, which means that nondissolved IBU is present in low concentrations. The presence of drug crystals could be due to the pretreatment of the samples before the measurement (the NLC dispersions were dried in air).
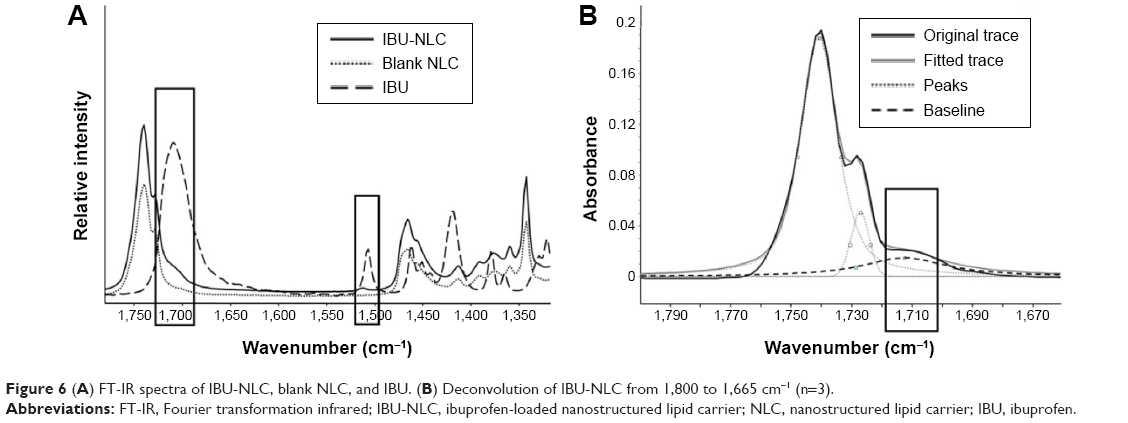 | Figure 6 (A) FT-IR spectra of IBU-NLC, blank NLC, and IBU. (B) Deconvolution of IBU-NLC from 1,800 to 1,665 cm−1 (n=3). |
Results of drug loading and entrapment efficiency
From the results of the applied HPLC method, DL was found to be 9.85%±4.10% and EE 98.51%±4.10% for the prepared IBU-NLC composition, since 1.49%±4.10% of the IBU was measured in the outer aqueous phase.
Results of in vitro release, ex vivo permeation, and in vivo animal studies
The in vitro diffusion of IBU through the artificial membrane from IBU-NLC and the IBU suspension was calculated in terms of the mean cumulative amount diffused at each sampling time point during a period of 6 hours (Figure 7A). The amount of IBU diffused from the IBU-NLC after 6 hours was significantly higher (2.59-fold) than that from the IBU suspension.
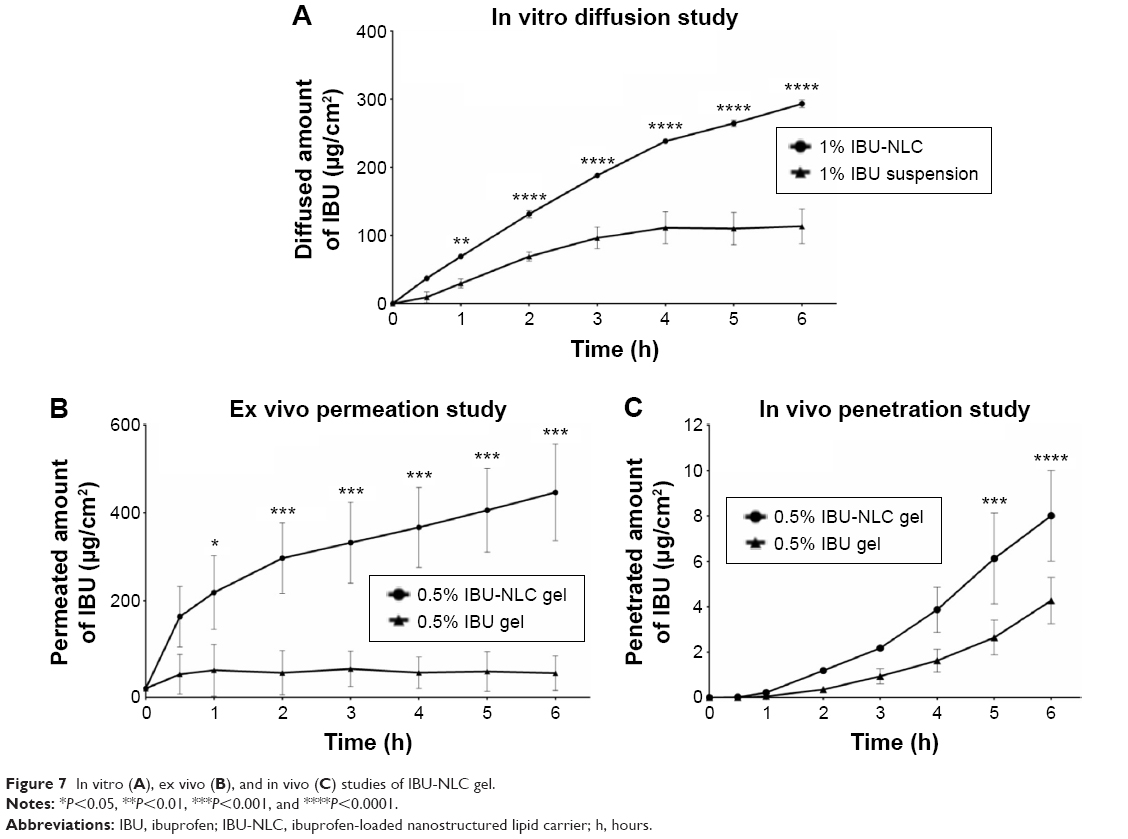 | Figure 7 In vitro (A), ex vivo (B), and in vivo (C) studies of IBU-NLC gel. |
The ex vivo penetration of the drug from the prepared IBU-NLC gel and IBU gel through excised human skin was calculated in the same way as for the in vitro measurements (Figure 7B). The permeation of IBU through the excised human skin was 12.78-fold higher from the IBU-NLC gel than from the traditional IBU gel. These findings correlate with those of the in vitro diffusion study, since after 6 hours, much higher drug permeation could be observed from the IBU-NLC gel than from the IBU gel.
Finally, the in vivo permeation of IBU from the IBU-NLC gel and the IBU gel was determined with a murine model, using a modified dorsal skin chamber; the results are presented in Figure 7C. The drug penetration was significantly higher (1.87-fold, P>0.001) from the IBU-NLC gel formulation than from the IBU gel, as found in the previous in vitro and ex vivo studies.
Discussion
An NLC-based gel of IBU was produced. Characterization of the IBU-NLC dispersion by PCS, LD, and AFM proved the appropriate size range and morphological properties of the lipid nanoparticles, which are essential for the stability and the desired performance of the formulation. XRD measurements and the high EE (98.51%) both confirmed the presence of IBU as a molecular dispersion in the lipid matrix of the final formulation. The results of Raman spectroscopy and FT-IR analysis indicated that the ordered lipid structure was not affected by the presence of the IBU molecules. The homogeneous distribution of the IBU in the lipid matrix and the weak interactions between the drug and the excipients predicted rapid drug liberation, since there is no need for energy to break the bonds between the drug and the excipients. These findings were confirmed by drug diffusion and permeation studies. The in vitro diffusion study demonstrated higher drug permeation from the IBU-NLC than from the IBU suspension. The permeation of IBU through the excised human skin was also significantly higher from the IBU-NLC gel than from the IBU gel. The higher penetration rate is probably due to the direct contact between the lipid nanoparticles and the lipids of the stratum corneum, which results in the increase of the penetration channels through the skin. The NLC carrier-based gel facilitated the drug permeation through the living animal skin even under physiological conditions.
It can be concluded that the IBU-NLC gel is of great potential to increase drug permeation through the skin and enhance the efficacy of the treatment for OA and other musculoskeletal inflammations.
Acknowledgments
The authors would like to thank Miss Gabriella Farkas for analyzing the FT-IR spectra, Péter Sipos, PhD, for the Raman measurements and analysis, as well as Piroska Révész, PhD, DSc, for revising the manuscript critically for important intellectual content.
The authors would also like to thank Azelis Ltd, Sasol GmbH, and BASF SE for the gift samples.
The financial support of the Hungarian National Research Fund projects OTKA NN 110676 and K 112531 is acknowledged.
Disclosure
The authors report no conflicts of interest in this work.
References
Bijlsma JWJ, Berenbaum F, Lafeber FP. Osteoarthritis: an update with relevance for clinical practice. The Lancet. 2011;377(9783):2115–2126. | ||
Zeng C, Li H, Yang T, et al. Electrical stimulation for pain relief in knee osteoarthritis: systematic review and network meta-analysis. Osteoarthritis Cartilage. 2015;23(2):189–202. | ||
Dahaghin S, Bierma-Zeinstra SM, Ginai AZ, Pols HA, Hazes JM, Koes BW. Prevalence and pattern of radiographic hand osteoarthritis and association with pain and disability (the Rotterdam study). Ann Rheum Dis. 2005;64(5):682–687. | ||
Dieppe PA, Lohmander LS. Pathogenesis and management of pain in osteoarthritis. The Lancet. 2005;365(9463):965–973. | ||
Hochberg MC, Altman RD, April KT, et al. American College of Rheumatology 2012 recommendations for the use of nonpharmacologic and pharmacologic therapies in osteoarthritis of the hand, hip, and knee. Arthritis Care Res (Hoboken). 2012;64(4):465–474. | ||
Potthast H, Dressman JB, Junginger HE, et al. Biowaiver monographs for immediate release solid oral dosage forms: ibuprofen. J Pharm Sci. 2005;94(10):2121–2131. | ||
Patel A, Bell M, O’Connor C, Inchley A, Wibawa J, Lane ME. Delivery of ibuprofen to the skin. International Journal of Pharmaceutics. 2013;457(1):9–13. | ||
Akhter SA, Barry BW. Absorption through human skin of ibuprofen and flurbiprofen; effect of dose variation, deposited drug films, occlusion and the penetration enhancer N-methyl-2-pyrrolidone. J Pharm Pharmacol. 1985;37(1):27–37. | ||
Bock U, Krause W, Otto J, Haltner E. Comparative in vitro and in vivo studies on the permeation and penetration of ketoprofen and ibuprofen in human skin. Arzneimittelforschung. 2004;54(9):522–529. | ||
Csizmazia E, Erős G, Berkesi O, Berkó S, Szabó-Révész P, Csányi E. Penetration enhancer effect of sucrose laurate and Transcutol on ibuprofen. Journal of Drug Delivery Science and Technology. 2011;21(5):411–415. | ||
Hadgraft J, Valenta C. pH, pKa and dermal delivery. International Journal of Pharmacology. 2000;200(2):243–247. | ||
Watkinson RM, Guy RH, Hadgraft J, Lane ME. Optimisation of cosolvent concentration for topical drug delivery – II: influence of propylene glycol on ibuprofen permeation. Skin Pharmacol Physiol. 2009;22(4):225–230. | ||
Watkinson RM, Herkenne C, Guy RH, Hadgraft J, Oliveira G, Lane ME. Influence of ethanol on the solubility, ionization and permeation characteristics of ibuprofen in silicone and human skin. Skin Pharmacol Physiol. 2009;22(1):15–21. | ||
Rhee YS, Chang SY, Park CW, Chi SC, Park ES. Optimization of ibuprofen gel formulations using experimental design technique for enhanced transdermal penetration. Int J Pharm. 2008;364(1):14–20. | ||
Müller RH, Mäder K, Gohla S. Solid lipid nanoparticles (SLN) for controlled drug delivery – a review of the state of the art. European Journal of Pharmaceutics and Biopharmaceutics. 2000;50(1):161–177. | ||
Mehnert W, Mäder K. Solid lipid nanoparticles: production, characterization and applications. Advanced Drug Delivery Reviews. 2001;47(2–3):165–196. | ||
Müller RH, Radtke M, Wissing SA. Solid lipid nanoparticles (SLN) and nanostructured lipid carriers (NLC) in cosmetic and dermatological preparations. Advanced Drug Delivery Reviews. 2002;54 Suppl 1:S131–S155. | ||
Müller RH, Petersen RD, Hommoss A, Pardeike J. Nanostructured lipid carriers (NLC) in cosmetic dermal products. Advanced Drug Delivery Reviews. 2007;59(6):522–530. | ||
Joshi M, Patravale V. Nanostructured lipid carrier (NLC) based gel of celecoxib. Int J Pharm. 2008;346(1–2):124–132. | ||
Müller RH, Rühl D, Runge S, Schulze-Forster K, Mehnert W. Cytotoxicity of solid lipid nanoparticles as a function of the lipid matrix and the surfactant. Pharmaceutical Research. 1997;14(4):458–462. | ||
Yang X, Zhao L, Almasy L, et al. Preparation and characterization of 4-dedimethylamino sancycline (CMT-3) loaded nanostructured lipid carrier (CMT-3/NLC) formulations. Int J Pharm. 2013; 450(1–2):225–234. | ||
Wissing SA, Müller RH. The influence of the crystallinity of lipid nanoparticles on their occlusive properties. Int J Pharm. 2002; 242(1–2):377–379. | ||
Wissing SA, Müler RH. Solid lipid nanoparticles as carrier for sunscreens: in vitro release and in vivo skin penetration. J Control Release. 2002;81(3):225–233. | ||
Araujo J, Garcia ML, Mallandrich M, Souto EB, Calpena AC. Release profile and transscleral permeation of triamcinolone acetonide loaded nanostructured lipid carriers (TA-NLC): in vitro and ex vivo studies. Nanomedicine. 2012;8(6):1034–1041. | ||
Farboud ES, Nasrollahi SA, Tabbakhi Z. Novel formulation and evaluation of a Q10-loaded solid lipid nanoparticle cream: in vitro and in vivo studies. Int J Nanomedicine. 2011;6:611–617. | ||
How CW, Rasedee A, Manickam S, Rosli R. Tamoxifen-loaded nanostructured lipid carrier as a drug delivery system: characterization, stability assessment and cytotoxicity. Colloids Surf B Biointerfaces. 2013;112:393–399. | ||
Shi F, Zhao J-H, Liu Y, Wang Z, Zhang Y-T, Feng N-P. Preparation and characterization of solid lipid nanoparticles loaded with frankincense and myrrh oil. Int J Nanomedicine. 2012;7:2033–2043. | ||
Kheradmandnia S, Vasheghani-Farahani E, Nosrati M, Atyabi F. Preparation and characterization of ketoprofen-loaded solid lipid nanoparticles made from beeswax and carnauba wax. Nanomedicine. 2010;6(6):753–759. | ||
Xie S, Zhu L, Dong Z, Wang Y, Wang X, Zhou W. Preparation and evaluation of ofloxacin-loaded palmitic acid solid lipid nanoparticles. Int J Nanomedicine. 2011;6:547–555. | ||
Kligman AM, Christophers E. Preparation of isolated sheets of human stratum corneum. Arch Dermatol. 1963;88(6):702–705. | ||
Erős G, Hartmann P, Berkó S, et al. A novel murine model for the in vivo study of transdermal drug penetration. Scientific World Journal. 2012;2012:543536. | ||
Neupane YR, Srivastava M, Ahmad N, Kumar N, Bhatnagar A, Kohli K. Lipid based nanocarrier system for the potential oral delivery of decitabine: formulation design, characterization, ex vivo, and in vivo assessment. Int J Pharm. 2014;477(1–2):601–612. | ||
Üner M, Yener G. Importance of solid lipid nanoparticles (SLN) in various administration routes and future perspectives. Int J Nanomedicine. 2007;2(3):289–300. | ||
de Villiers MM, Liebenberg W, Malan SF, Gerber JJ. The dissolution and complexing properties of ibuprofen and ketoprofen when mixed with N-methylglucamine. Drug Dev Ind Pharm. 1999;25(8):967–972. | ||
Matkovic SR, Valle GM, Briand LE. Quantitative analysis of ibuprofen in pharmaceutical formulations through FTIR spectroscopy. Latin American Applied Research. 2005;35:189–195. |
 © 2016 The Author(s). This work is published and licensed by Dove Medical Press Limited. The
full terms of this license are available at https://www.dovepress.com/terms
and incorporate the Creative Commons Attribution
- Non Commercial (unported, 3.0) License.
By accessing the work you hereby accept the Terms. Non-commercial uses of the work are permitted
without any further permission from Dove Medical Press Limited, provided the work is properly
attributed. For permission for commercial use of this work, please see paragraphs 4.2 and 5 of our Terms.
© 2016 The Author(s). This work is published and licensed by Dove Medical Press Limited. The
full terms of this license are available at https://www.dovepress.com/terms
and incorporate the Creative Commons Attribution
- Non Commercial (unported, 3.0) License.
By accessing the work you hereby accept the Terms. Non-commercial uses of the work are permitted
without any further permission from Dove Medical Press Limited, provided the work is properly
attributed. For permission for commercial use of this work, please see paragraphs 4.2 and 5 of our Terms.