Back to Journals » Medical Devices: Evidence and Research » Volume 9
Development of devices for self-injection: using tribological analysis to optimize injection force
Authors Lange J ![]() , Urbanek L, Burren S
, Urbanek L, Burren S
Received 18 February 2016
Accepted for publication 14 April 2016
Published 11 May 2016 Volume 2016:9 Pages 93—103
DOI https://doi.org/10.2147/MDER.S106675
Checked for plagiarism Yes
Review by Single anonymous peer review
Peer reviewer comments 3
Editor who approved publication: Dr Scott Fraser
Jakob Lange, Leos Urbanek, Stefan Burren
Ypsomed Delivery Systems, Ypsomed AG, Burgdorf, Switzerland
Abstract: This article describes the use of analytical models and physical measurements to characterize and optimize the tribological behavior of pen injectors for self-administration of biopharmaceuticals. One of the main performance attributes of this kind of device is its efficiency in transmitting the external force applied by the user on to the cartridge inside the pen in order to effectuate an injection. This injection force characteristic is heavily influenced by the frictional properties of the polymeric materials employed in the mechanism. Standard friction tests are available for characterizing candidate materials, but they use geometries and conditions far removed from the actual situation inside a pen injector and thus do not always generate relevant data. A new test procedure, allowing the direct measurement of the coefficient of friction between two key parts of a pen injector mechanism using real parts under simulated use conditions, is presented. In addition to the absolute level of friction, the test method provides information on expected evolution of friction over lifetime as well as on expected consistency between individual devices. Paired with an analytical model of the pen mechanism, the frictional data allow the expected overall injection system force efficiency to be estimated. The test method and analytical model are applied to a range of polymer combinations with different kinds of lubrication. It is found that material combinations used without lubrication generally have unsatisfactory performance, that the use of silicone-based internal lubricating additives improves performance, and that the best results can be achieved with external silicone-based lubricants. Polytetrafluoroethylene-based internal lubrication and external lubrication are also evaluated but found to provide only limited benefits unless used in combination with silicone.
Keywords: injection pen, injection force efficiency, coefficient of friction, lubrication, testing, material selection
Introduction
Pen injectors provide a convenient alternative to manual syringe injections for the subcutaneous administration of drugs across a range of different indications.1–3 They were first introduced for use with insulin >30 years ago and have since then become a central part of the treatment of diabetes.4–6 One of the main performance attributes of this kind of device is its efficiency in transmitting the external force applied by the user onto the cartridge inside the pen in order to effectuate the injection. This injection force characteristic is acknowledged to be a major performance indicator and receives a lot of attention during device development. Injection force data for different injectors are widely reported and compared in the literature.7–13
The injection force efficiency of a pen injector is determined on the one hand by the mechanical design of the pen and on the other hand by the frictional properties of the materials employed in the mechanism. For a given design, the performance can be significantly improved by choosing the right combination of materials in order to minimize frictional losses.14,15 In pen injectors, the materials employed are typically different types of polymers, often with additives. The frictional behavior of these materials sliding against each other is determined by factors such as adhesion, surface roughness, local deformation, and the possible presence of lubrication at the interface between the parts.16,17 Lubrication can be either internal, achieved with additives present in the materials, or external, with a lubricant added separately.18
In order to characterize candidate materials and obtain a basis for selection, frictional testing is often performed. Here, it is important to note that the test method and test conditions used to characterize frictional behavior may have a major impact on the results obtained. The standard geometry method for the measurement of friction is based on the linear sliding movement between planar surfaces.19 As parts inside a pen injector are seldom completely planar and often rotate rather than slide, it can be questioned to what extent results obtained with the standard geometry methods are representative of the real situation. This has led to the development of alternative test procedures based on rotation rather than linear movement, but still using planar model surfaces.17 As the surface structure and finish of a plastic part depend on the mold from which it has been made and these properties are known to influence frictional behavior, it would be interesting to be able to conduct tests with actual device parts rather than model specimens. To the authors’ knowledge, no such test procedure has been reported in the literature.
Test parameters such as contact pressure, speed of movement, and duration of testing also influence the results obtained, and it is important to choose the conditions wisely.20 Thus, for a reusable pen injector intended to be used over several years, longer testing times, possibly involving wear of the parts, may be relevant, whereas a disposable pen injector requires a much shorter test duration.17,21 The pressure and rate during testing will influence the amount of deformation and heat buildup at the interface, thus impacting the test result. For pen injectors, heat buildup is expected to be negligible and contact pressures to be low.17,21
The high requirements in terms of stiffness, strength, and dimensional stability mean that only a limited number of engineering polymers are suitable for use in a pen injector mechanism. One often used material is polyoxymethylene (POM), which in addition to excellent mechanical properties also exhibits favorable frictional behavior.22 Other commonly used polymers are polybutylene terephthalate (PBT), polycarbonate (PC), and polyamide (PA). A previous work on these materials using standard sliding test geometries has shown that friction between identical, unmodified polymers generally is higher compared to pairings involving different polymers and/or polymers with additives.22 It is thus preferable either to use two different polymers, or if this is not possible, to use an additive in order to reduce friction. By combining the approaches, ie, using two different polymers plus additives, even lower friction values can be achieved.22 A study of POM sliding against POM using a standard sliding geometry, comparing different types of additives (internal lubrication), found that silicone oil-based additives yielded lower friction than polytetrafluoroethylene (PTFE)-based ones. However, using silicone oil may have a negative influence on the mechanical properties. The same study also compared internal to external lubrication and showed external lubrication to be more efficient in reducing friction.18 A study on POM with internal lubrication, tested against neat polypropylene, this time using a rotational test, found that PTFE additives were less efficient in reducing friction than additives based on polydimethylsiloxane (PDMS). It was seen, however, that a combination of the two additives together was even more efficient than PDMS alone.17
The current study presents a new test procedure to characterize the frictional behavior of two key parts in a recently developed disposable pen injector, the UnoPen™. The test employs actual device parts and allows the addition of external lubrication. It measures the coefficient of friction (CoF) in a dedicated test set-up under test conditions representing the expected pen use. Using this test procedure, different material combinations, different lubricating additives, and different types of external lubrication are then evaluated and their frictional performance examined in detail. It is also shown how the CoF data together with an analytical model can be used to estimate expected system performance and how this information allows recommendations for material selection to be made.
Materials and methods
Materials
The pen injector examined in this study is a disposable multiple variable-dose pen injector holding a 3 mL cartridge, the UnoPen™.23 It is depicted in Figure 1. The pen system consists of a total of 16 parts, ten of which play a role in the transmission of the force applied by the user on the dose button to the drug cartridge inside the pen during injection. The pen mechanism is geared so as to increase efficiency and lower the user force required to achieve an injection. A theoretical analysis of the pen mechanism showed that 75% of the energy losses during injection occur at the interface between two parts in the mechanism, the threaded sleeve and the dose sleeve (data not shown). The analysis also showed that the overall force transmission efficiency of the pen injector mechanism, ie, the ratio between the force applied by the user on the dose button and the force arriving at the drug cartridge inside the pen, depends strongly on the CoF at the interface between these two parts. The relationship is shown in Figure 2. The dose sleeve and threaded sleeve parts were therefore selected for a detailed frictional analysis and optimization. The parts are depicted in Figure 3.
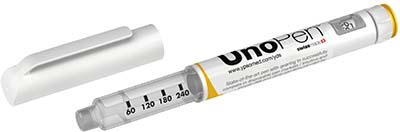 | Figure 1 The UnoPen™ disposable pen injector. |
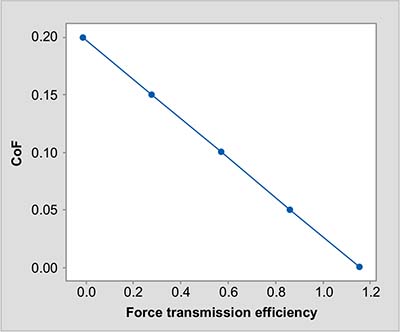 | Figure 2 Theoretical relationship between CoF at the dose sleeve/threaded sleeve interface and dimensionless overall pen injector force transmission efficiency. |
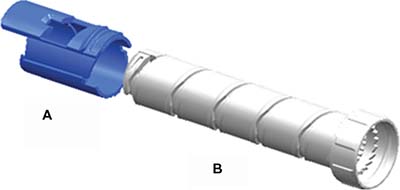 | Figure 3 Threaded sleeve (A) and dose sleeve (B) parts. |
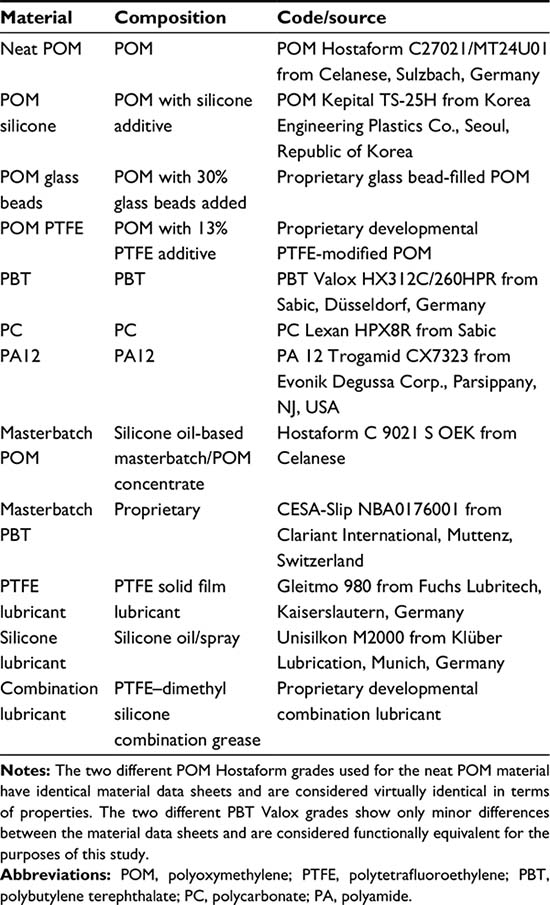
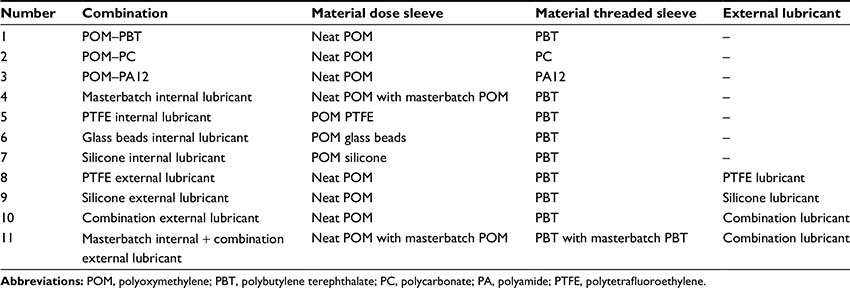
A range of different base polymers, additives, and lubricants was examined. They are listed in Table 1. For the molding of threaded sleeve and dose sleeve single parts from the different polymers, two single cavity cold-runner tools (Ypsomed AG, Burgdorf, Switzerland) were used. Depending on the intended composition, the polymer was used either as received or with the addition of a masterbatch during molding. The combinations of tested materials are presented in Table 2.
 | Table 1 Polymers and lubricants |
 | Table 2 Combinations of materials tested |
Test set-up and procedure
The two parts were mounted together so as to replicate the movement in the pen injector. To this end, the threaded sleeve was attached to the top part of a Zwick Roell Z 2.5 universal test machine with custom fittings (Zwick GmbH, Ulm, Germany) and the dose sleeve to the bottom part. The test set-up is depicted in Figure 4. The top part was rotated, and the resulting force and torque on the bottom part were recorded. A custom sliding linear guide on the top part ensured free lateral movement of the threaded sleeve during rotation. For each combination of the tested material, ten different part pairs were subjected to each 15 cycles of rotation back and forth over 450° at a rate of 90°/s. During testing, a fixed load of 10 N (equivalent to the typical injection force) was applied to the top part by means of a physical weight. For combinations including external lubrication, the lubricant was added dropwise to the dose sleeve before the parts were mounted. Before measurements were started, the parts in all cases underwent one complete up and down rotation (three full turns or 1,080°).
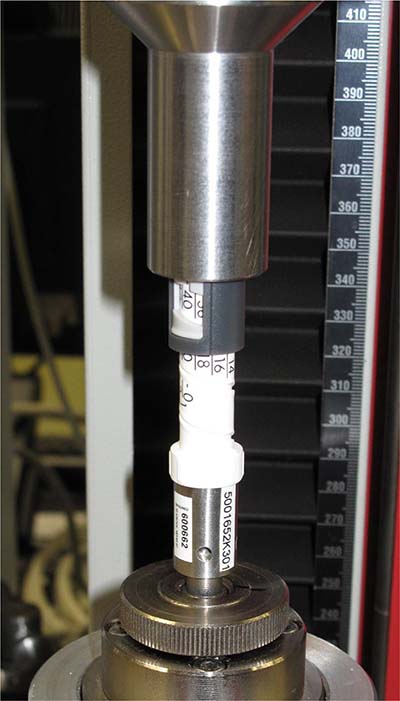 | Figure 4 An experimental test set-up for the measurement of CoF. |
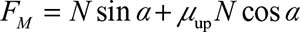
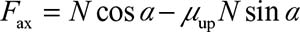
In order to convert the measured force and torque into CoF (μ), a two-dimensional model of the interface between the two parts was employed. The model is shown in Figure 5. The outer surface of the dose sleeve is represented as an inclined plane with a fixed angle (α) and the inner surface of the threaded sleeve as a moving body on the plane. In this model, the circumference of the interface (2Rπ) is projected on the x-axis and the pitch of the thread on the y-axis. It can be seen that the overall velocity of the threaded sleeve along the thread (ν) can be split into an axial velocity (νax) and a circumferential velocity (νcirc). The force equilibrium during the upward movement of the body at a constant velocity can be analyzed as shown in Figure 6. Here, the reaction force (N) at the contact point is perpendicular to the thread plane and generates a friction force (μN) opposite to the direction of movement. The physical weight generates an axial force (Fax), and the applied torque generates a circumferential force (FM). This gives the following relationships:
 | (1) |
 | (2) |
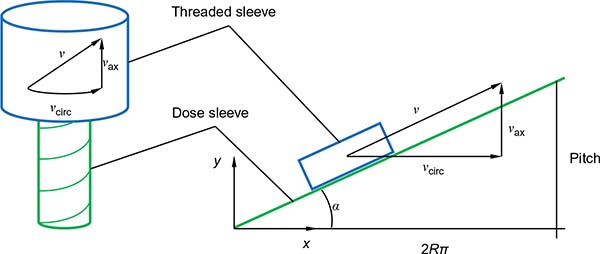 | Figure 5 Two-dimensional model of the interface between the threaded sleeve and dose sleeve parts. |
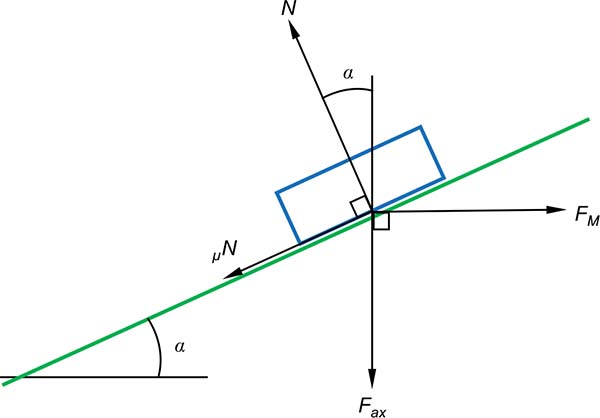 | Figure 6 Force equilibrium under constant velocity movement of the threaded sleeve. |
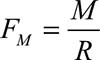
The circumferential force (FM) can be expressed in terms of the resulting torque (M) and the thread radius (R) as follows:
 | (3) |
Solving Equations 1 and 2 for the CoF gives the following equation for the case of upward movement:
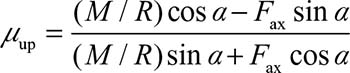 | (4) |
The case of downward movement can be solved in the same manner to give:
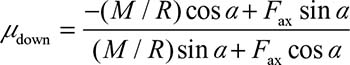 | (5) |
As Equations 4 and 5 differ only with respect to the sign and the CoF by convention is taken to be positive, an absolute value of the CoF for both the upward and downward movement can be calculated using a single equation:
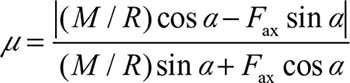 | (6) |
Thus, using Equation 6 with the numerical values for the radius and angle, an absolute CoF value can be calculated directly from the measured torque and axial force.
A plot of the CoF “raw data” as calculated from the torque and force readings for combination 1 is shown in Figure 7. The plot shows all 150 cycles measured for this combination, ie, 15 up and down cycles for ten part pairs. As can be seen, the static CoF (data points at 0° and 450° rotations) is not meaningfully different from the kinetic CoF (all data points in between). The plots in Figure 7 also show that the kinetic CoF is not constant throughout the rotational movement. However, comparing similar raw data plots from other combinations indicates that the variability during rotation is mainly related to the geometry of the parts and not the frictional properties of the materials/system (data not shown). In order to obtain a simpler measure of the frictional behavior of each tested combination and considering that kinetic data is believed to be more relevant than static data in the present application, the raw data were condensed into a single kinetic CoF value per combined up and down cycle. This was done by calculating the numerical average CoF per combined up and down cycle, using the data obtained between 40° and 400° rotations (indicated by the vertical red lines in Figure 7).
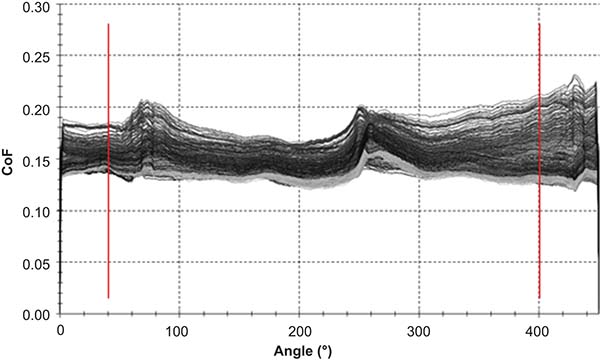 | Figure 7 CoF measured for combination 1. |
Results and discussion
Different polymers
Figure 8 presents the results obtained with different polymer combinations without any lubrication added. In all cases, POM was used for the dose sleeve and the materials employed for the threaded sleeve varied. The results are given as average CoF in consecutive cycles, with the data for each tested part pair (one repeat experiment, a set of 15 cycles) shown as an individual line. It can be seen that combination 3, POM–PA12, exhibits the lowest CoF values; combination 2, POM–PC, the highest; and combination 1, POM–PBT, in between. A variation in the CoF level between repeat experiments is clearly visible and appears to be similar in magnitude for all the three polymer combinations. The evolution throughout the cycles is quite different between the combinations with combination 1 showing an initial increase followed by a decrease, combination 2 an initial decrease followed by a slight increase, and combination 3 a pronounced decrease in CoF as the experiment proceeds.
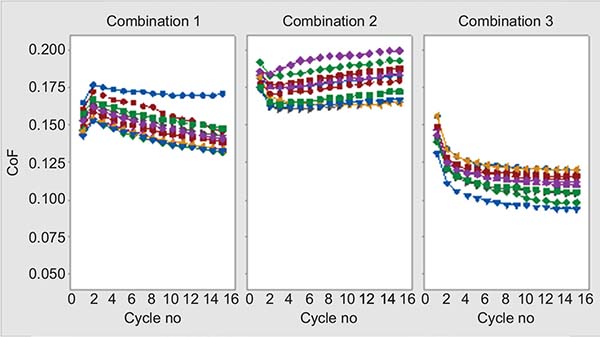 | Figure 8 Evolution of kinetic CoF over repeat cycles (combinations 1–3, different polymers). |
The basic difference in CoF between the different polymer combinations is believed to be primarily related to the adhesion of the materials, as there is no added lubrication and the surface roughness should be similar, given that the parts have been molded in the same tool. It is thus hypothesized that PC would have the highest adhesion to POM, PA the lowest, and PBT somewhere in between. It is known that the adhesion increases as the polarity of a material increases.22 If the critical surface tension is taken as a proxy for polarity,22 surface tension data indicate that PC is by far the most polar of the materials examined.24 Comparing the structures of PA12 and PBT suggests that PA12, with its significant hydrocarbon chain component, would be the less polar of the two. This polarity ranking is also supported by the available surface tension values.24 It is not known what causes the observed evolution in CoF over consecutive cycles of combinations 1 and 2. The behavior of combination 3, ie, a decrease in CoF with an increasing cycle number, has been previously reported and attributed to the gradual creation of a lubricating layer at the interface.18,22 This running-in effect is not desired, as it would result in inconsistent performance during the use of the pen injector. The observed variation, in general friction level, between repeat experiments is also not desirable, as this may lead to different individual pen injectors performing quite differently.
Internal lubrication
The results on POM–PBT pairings with different kinds of internal lubrication are presented in Figure 9. In all cases, the internal lubrication was achieved through modification of the POM in the dose sleeve and without any changes in the PBT of the threaded sleeve. It can be seen that the POM modifications with silicone, combinations 4 and 7, give the lowest values of CoF and show the least variation between repeat experiments. However, both combinations do exhibit a slight running-in effect. The PTFE and glass bead modifications, combinations 5 and 6, respectively, both result in high friction levels and large variations between experiments. The friction values as well as the variability are clearly above what is obtained for the unmodified POM–PBT pairing (combination 1 in Figure 7).
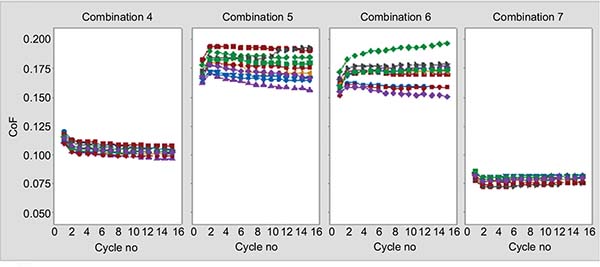 | Figure 9 Evolution of kinetic CoF over repeat cycles (combinations 4–7, internal lubrication). |
It is known that PTFE additives are incorporated as discrete pockets in the base polymer, thus requiring a certain running-in period and wear to reach the surface and achieve their effect, and that this process is facilitated by high loads.18,21 It appears that the load is too low and/or the time is too short for the PTFE additive to provide any benefit in the current application. It is not known why the performance of the PTFE-modified POM is worse than that of the unmodified POM. The glass bead-filled POM was included in the expectation that the increased hardness may lead to lower friction against PBT, as it is known that pairings of materials with a different hardness often perform better than pairings with similar hardness.22 However, the presence of particulate fillers may also increase surface roughness and lead to abrasion of the counter surface.25 The results on combination 6 suggest that, in the present case, the second effect is stronger than the first. The two silicone-modified POM materials perform well, showing considerably lower friction than the unmodified POM material. The reason why the POM with silicone added already in the preparation of the base polymer performs better than the one where the additive is added during molding is believed to be a more uniform distribution of the additive in the former case.
External lubrication
The influence of different types of external lubrication on the friction between POM and PBT material pairings is depicted in Figure 10. The first three combinations (8–10) in Figure 10 employ unmodified POM and PBT materials, whereas the last (combination 11) uses materials modified with friction-reducing masterbatch additives. Looking at the results for combinations 8–10 shows that the PTFE solid film lubricant (combination 8) improves friction somewhat compared to POM–PBT without lubrication (combination 1 in Figure 8), albeit with a pronounced running-in effect. The liquid silicone lubricant (combination 9) reduces friction further and also exhibits low variation between repeat experiments, although a running-in effect is still present. Combining PTFE and silicone in a single lubricant (the combination compound, combination 10) results in very low friction, low between-experiment variation, and a limited running-in effect. The data for combination 11 show that using the combination compound lubricant with friction-reduced versions of the POM and PBT materials does not lead to any further reduction in friction. If anything, the CoF values for combination 11 are somewhat higher than for combination 10. However, the between-experiment variation is slightly reduced for combination 11 compared to combination 10.
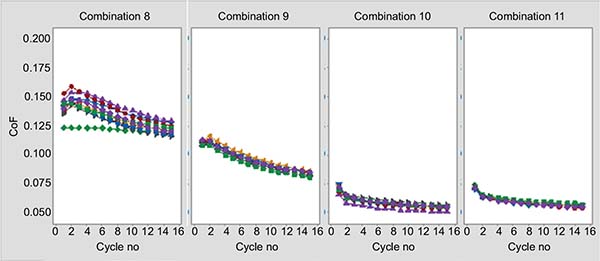 | Figure 10 Evolution of kinetic CoF over repeat cycles (combinations 8–11, external lubrication). |
The PTFE-based lubricant requires running in and is not very effective, presumably because it is applied as a solid film, thus requiring both pressure and time to distribute evenly and create a lubricating layer. The creation of such a layer is believed to occur only partially and inconsistently, leading to the high observed variations between repeat experiments. The silicone-based lubricant performs better, as it is applied as a liquid and is believed to distribute to form a continuous layer in a consistent manner under the conditions of time and pressure found in the pen injector case. As for the combination compound lubricant, its superior performance compared to the other two lubricants is attributed to the composition (containing both PTFE and silicone) in combination with the fluidity (sufficient to allow the swift formation of a lubricating layer) of the combination compound. The observation that a combination of two types of lubricant works better than each one alone is in line with the previous work on internal lubricants such as silicone and PDMS.17 It is not fully understood why the use of internal lubrication of the POM and PBT materials together with the external combination compound did not result in any further reduction in CoF (combination 11). It is hypothesized, however, that the external lubricant forms a fully continuous film by itself and that the properties of this film determine the frictional performance in both combination 10 and combination 11, essentially rendering the performance independent of the properties of the base materials.
System force efficiency
The theoretically calculated relationship between the dimensionless overall efficiency in force transmission and CoF of the dose sleeve/threaded sleeve depicted in Figure 2 shows that CoF has a strong inverse influence on device performance. At a CoF >0.20, the force efficiency falls to 0, meaning that the mechanism is self-locking. At the other end, with the CoF approaching 0, the force efficiency increases beyond 1, meaning that, thanks to the gearing, the force arriving at the cartridge inside the pen is higher than the force applied on the dose button.
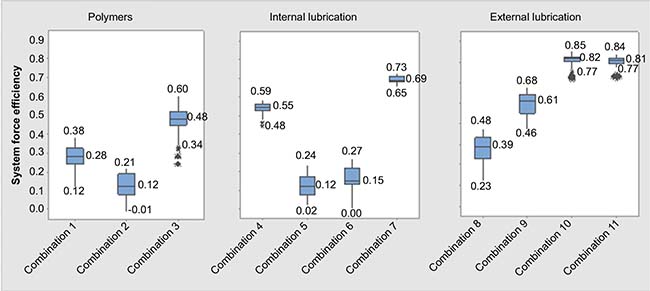
In order to compare the expected performance of the different tested material combinations, the experimentally obtained kinetic CoF values were converted into force efficiency data of theoretical system using the inversely proportional relationship shown in Figure 2. The expected system force efficiency values so obtained are showed for all combinations in Figure 11. The results are presented as box plots of all individual data points for each tested combination, ie, n=10×15, with median as well as maximum and minimum (whisker length) values displayed. Looking first at the median force efficiency value of the different polymer combinations with unmodified POM, it can be seen that the force efficiency drops by >50% when the PBT is replaced by PC and increases by >50% when PA12 is used instead of PBT. Looking next at the expected variability in force efficiency for each combination, indicated by the length of the whiskers in the box plot, it can be seen that the POM–PBT combination has a variability of ±30% of the median. For the POM–PC combination, the variability is ±100% and the minimum is <0, ie, a self-locking mechanism. The POM–PA12 combination has a variability of about ±30% of the median.
 | Figure 11 Dimensionless system efficiency calculated from the measured kinetic CoF for all combinations. |
Examining the effect of internal lubrication on force efficiency, a comparison of combinations 1 and 4 shows that the addition of a standard silicone-based masterbatch to the POM component produces a doubling of the median force efficiency together with a considerable reduction in variability. Examining combinations 5 and 6 and comparing with combination 2 shows that PTFE and glass bead additives in the POM produce values similar to those of the POM–PC combination, including the potential for blocking of the mechanism (minimum values ≤0). It is also found that the silicone additive used with POM in combination 7 leads to a 25% higher median force efficiency than the masterbatch (combination 4), with a variability below ±10%.
External lubrication in the form of a PTFE film allows an increase in force efficiency of ∼30% while keeping the same variability as for the nonlubricated combination (comparing combinations 1 and 8). Using silicone oil as an external lubricant leads to a doubling in force efficiency and considerable reduction in variability compared to the standard (combination 9 versus combination 1). With the combination compound external lubricant (combination 10), the efficiency is tripled compared to the standard and the variability further reduced. Adding internal lubrication to the POM and PBT base materials (combination 11) produces no further improvement in force efficiency or variability.
Selection of materials and lubrication type
Based on the data in Figures 8–11, it is possible to make recommendations in terms of most suitable material combinations and types of lubrication to be considered for the two parts in the pen mechanism. Starting with the base polymer material, combinations 1, 2, and 3 may be compared. From a purely frictional perspective, combination 3 (POM–PA12) would be the best one to choose of the three examined combinations. However, the strong observed running-in effect as well as other considerations in terms of nonfrictional properties means that this combination is not preferred. Combination 2 (POM–PC) clearly has inferior tribological properties and even presents the risk of mechanism self-locking. Combination 1 (POM–PBT) is not optimal as is but shows potential.
Adding internal lubrication to the POM in the POM–PBT combination allows a dramatic improvement in tribology as long as a silicone-based additive is used. Here the choice would have to be made between a standard POM polymer with a standard silicone masterbatch giving intermediate performance and a bespoke POM polymer compound with superior performance. Factors such as medical grade certification, supply security, and cost would have to be considered for each material option and weighed against the obtained performance.
Moving on to external lubrication, it appears that a silicone oil external lubricant (combination 9) gives a result comparable to that of the basic silicone internal lubrication (masterbatch, combination 4). Using a combination of silicone and PTFE, as in combination 10, allows the best performance overall, beating even the best internal lubrication (combination 7). When choosing between internal and external lubrication solutions, there are process and stability considerations to be made. Whereas internal lubrication can be included in the base polymer, external lubrication requires an additional step in manufacturing and raises questions as to the stability and positioning of the lubricant in the pen mechanism over time. Devices are stored for multiple years, and it has to be ensured that the lubricant is able to fulfill its role also at the end of the shelf life. Internal lubricants are known to be stable in this respect, whereas external lubricants, depending on storage conditions, may have a tendency to change properties and move around during the shelf life.
To conclude, there is thus no single “best” option among the eleven tested combinations. If highest absolute performance is the criterion, combination 10 should be selected. If instead simplicity and stability of the manufacturing process throughout the shelf-life are the most important factors and good to intermediate performance is acceptable, combination 4 or 7 would be the preferred option.
Conclusion
A test procedure allowing the direct measurement of the CoF between two key parts of a pen injector mechanism has been developed. In addition to the absolute level of friction, and thus of performance, the test method provides information on expected evolution over lifetime (repeated usage cycles) as well as on consistency between individual devices (repeat experiments). Paired with an analytical model of the pen mechanism, the frictional data allow the expected overall system force efficiency to be estimated. Applying the test method and analytical model to a range of material combinations with different kinds of lubrication shows that the type of material and lubrication can have a dramatic impact on expected performance. It is thus found that material combinations without any lubrication generally have unsatisfactory performance, either in terms of absolute friction level, consistency over time and between repeats, or both. The use of silicone-based internal lubricating additives may improve both types of performance, whereas the best overall performance is achieved with silicone-based external lubricants. PTFE-based lubrication, be it internal or external, generally provides limited benefits except when used in combination with silicone.
Acknowledgments
The study was financed by Ypsomed AG. An abstract with interim findings of this paper was presented at the ACS National Meeting and Exposition, March 22–26, 2015, in Denver, CO, USA.
Disclosure
The authors are all employees of Ypsomed AG. The authors report no other conflicts of interest in this work.
References
French DL, Collins JJ. Advances in parenteral injection devices and aids. In: Nema S, Ludwig JD, editors. Pharmaceutical Dosage Forms, Parenteral Medications, Volume 3: Regulations, Validation and the Future. 3rd ed. London: Informa Healthcare; 2010:71–75. | ||
Thompson I, Lange J. Pen and autoinjector drug delivery devices. In: Kolhe P, Shah M, Rathore N, editors. Sterile Product Development. AAPS Advances in the Pharmaceutical Sciences Series 6. New York, NY: Springer; 2013:331–356. | ||
Lange J, Thompson I. Self-injection devices. In: Swarbrick J, editor. Encyclopedia of Pharmaceutical Science and Technology. 4th ed. New York, NY: Taylor and Francis; 2013:3132–3143. | ||
Fry A. Insulin delivery device technology 2012: where are we after 90 years? J Diabetes Sci Technol. 2012;6(4):947–953. | ||
Selam J-L. Evolution of diabetes insulin delivery devices. J Diabetes Sci Technol. 2010;4(3):505–513. | ||
Heinemann L. Insulin pens and new ways of insulin delivery. Diabetes Technol Ther. 2013;15(Suppl 1):S40–S59. | ||
Rissler J, Joergensen C, Rye Hansen M, Hansen N-A. Evaluation of the injection force dynamics of a modified prefilled insulin pen. Expert Opin Pharmacother. 2008;9(13):2217–2222. | ||
Ignaut DA, Opincar MR, Clark PE, Palaisa MK, Lenox SM. Engineering study comparing injection force and dose accuracy between two prefilled insulin injection pens. Curr Med Res Opin. 2009;25(12): | ||
Ignaut DA, Opincar M, Lenox S. FlexPen and KwikPen prefilled insulin devices: a laboratory evaluation of ergonomic and injection force characteristics. J Diabetes Sci Technol. 2008;2(3):533–537. | ||
Friedrichs A, Bohnet J, Korger V, Adler S, Schubert-Zsilavecz M, Abdel-Tawah M. Dose accuracy and injection force of different insulin glargine pens. J Diabetes Sci Technol. 2013;7(5):1346–1353. | ||
Goetsche D, Oelgard Rasmussen B, Pedersen MT, Sparre T, Bucher D, Niemeyer M. Injection force and dose accuracy of FlexTouch for the delivery of a new basal insulin. Expert Opin Drug Deliv. 2013;10(12):1613–1619. | ||
Schwartz SL, Ignaut DA, Bodie JN. Humalog(®) KwikPen™: an insulin-injecting pen designed for ease of use. Expert Rev Med Devices. 2010;7(6):735–743. | ||
Pfützner A, Reimer T, Hohberg C, Froekjaer LPF, Joergensen C. Prefilled insulin device with reduced injection force: patient perception and accuracy. Curr Med Res Opin. 2008;24(9):2545–2549. | ||
Sivebaeck IM, inventor; Novo Nordisk, Bagsvaerd, assignee. Low friction systems and devices. US Patent Application Publication US 2009/0177150 A1. 2009 Jul 9. | ||
Harms M, Raab S, Dasbach U, inventor; Sanofi-Aventis Deutschland GmbH, assignee. Medical device having a mechanism and use of a low-friction synthetic material within a medical device. US Patent Application Publication US 2012/0172818 A1. 2012 Jul 5. | ||
Brostow W, Deborde J-L, Jaklewicz M, Olszynski P. Tribology with emphasis on polymers: friction, scratch resistance and wear. J Mater Educ. 2003;24:119–132. | ||
Laursen JL, Sivebaek IM, Christoffersen LW, et al. Influence of tribological additives on friction and impact performance of injection moulded polyacetal. Wear. 2009;267(12):2294–2302. | ||
Markgraf K, Jonson W [webpage on the Internet]. New material developments for medical devices: polymers with improved tribology. OnDrugDelivery No 57, April 2015. Pulmonary and Nasal Delivery: 40–42. Available from: http://www.ondrugdelivery.com/publications/57/Celanese.pdf. Accessed February 15, 2016. | ||
ASTM D1894-14. Standard Test Method for Static and Kinetic Coefficients of Friction of Plastic Film and Sheeting. West Conshohocken, PA: ASTM International; 2014. | ||
Froeland S, Sivebaek IM [webpage on the Internet]. Evaluation of polymer wear assessment methods. In: Proceedings of the 5th World Tribology Congress (WTC 2013): Extended Abstracts. Italian Tribology Association; 2013. Available from: http://orbit.dtu.dk/ws/files/97168357/Evaluation_of_polymer.pdf. Accessed February 15, 2016. | ||
Mayskin NK, Kovalev AV. Adhesion and friction of polymers. In: Sinha SK, Briscoe BJ, editors. Polymer Tribology. London: Imperial College Press; 2009:3–33. | ||
Czyborra L, Raab P, Witan K. Auf dem Weg zur quietschfreien Kunststoffpaarung: Messung, Materialentwicklung, Anwendung [On the way to squeak-free plastic combinations: Measurement, material development, use]. In: Feulner RW, Dallner CM, Ehrenstein GW, Schmachtenberg E, editors. Maschinenelemente aus Kunststoff [Machine elements in plastic]. Erlangen, Germany: Lehrstuhl für Kunststofftechnik; 2007:144–162. German. | ||
Ypsomed AG [webpage on the Internet]. UnoPen™ – the intuitive dial and dose disposable pen. Product description, Burgdorf, Switzerland, November 2011. Available from: http://www.ypsomed.com/files/documents-ypsomed/yds-downloads/Ypsomed-UnoPen-Brochure.pdf. Accessed January 22, 2016. | ||
Diversified Enterprises [webpage on the Internet]. Critical Surface Tension, Surface Free Energy, Contact Angles with Water, and Hansen Solubility Parameters for Various Polymers. Online compilation of values from published data with references. Diversified Enterprises, Claremont, NH, U.S.A; 2009. Data on critical surface tension on PBT is not available, instead the values for PET were used as a proxy. Available from: http://www.accudynetest.com/polytable_01.html. Accessed February 15, 2016. | ||
Bahadur S, Schwartz C. Mechanical and tribological behaviour of polymers filled with inorganic particulate fillers. In: Sinha SK, Briscoe BJ, editors. Polymer Tribology. London: Imperial College Press; 2009:416–448. |
 © 2016 The Author(s). This work is published and licensed by Dove Medical Press Limited. The
full terms of this license are available at https://www.dovepress.com/terms
and incorporate the Creative Commons Attribution
- Non Commercial (unported, 3.0) License.
By accessing the work you hereby accept the Terms. Non-commercial uses of the work are permitted
without any further permission from Dove Medical Press Limited, provided the work is properly
attributed. For permission for commercial use of this work, please see paragraphs 4.2 and 5 of our Terms.
© 2016 The Author(s). This work is published and licensed by Dove Medical Press Limited. The
full terms of this license are available at https://www.dovepress.com/terms
and incorporate the Creative Commons Attribution
- Non Commercial (unported, 3.0) License.
By accessing the work you hereby accept the Terms. Non-commercial uses of the work are permitted
without any further permission from Dove Medical Press Limited, provided the work is properly
attributed. For permission for commercial use of this work, please see paragraphs 4.2 and 5 of our Terms.