Back to Journals » Psychology Research and Behavior Management » Volume 10
Development of a psychological test to measure ability-based emotional intelligence in the Indonesian workplace using an item response theory
Authors Fajrianthi, Zein RA ![]()
Received 2 June 2017
Accepted for publication 31 October 2017
Published 28 November 2017 Volume 2017:10 Pages 339—352
DOI https://doi.org/10.2147/PRBM.S143113
Checked for plagiarism Yes
Review by Single anonymous peer review
Peer reviewer comments 2
Editor who approved publication: Dr Igor Elman
Fajrianthi,1 Rizqy Amelia Zein2
1Department of Industrial and Organizational Psychology, 2Department of Personality and Social Psychology, Faculty of Psychology, Universitas Airlangga, Surabaya, East Java, Indonesia
Abstract: This study aimed to develop an emotional intelligence (EI) test that is suitable to the Indonesian workplace context. Airlangga Emotional Intelligence Test (Tes Kecerdasan Emosi Airlangga [TKEA]) was designed to measure three EI domains: 1) emotional appraisal, 2) emotional recognition, and 3) emotional regulation. TKEA consisted of 120 items with 40 items for each subset. TKEA was developed based on the Situational Judgment Test (SJT) approach. To ensure its psychometric qualities, categorical confirmatory factor analysis (CCFA) and item response theory (IRT) were applied to test its validity and reliability. The study was conducted on 752 participants, and the results showed that test information function (TIF) was 3.414 (ability level = 0) for subset 1, 12.183 for subset 2 (ability level = -2), and 2.398 for subset 3 (level of ability = -2). It is concluded that TKEA performs very well to measure individuals with a low level of EI ability. It is worth to note that TKEA is currently at the development stage; therefore, in this study, we investigated TKEA’s item analysis and dimensionality test of each TKEA subset.
Keywords: categorical confirmatory factor analysis, emotional intelligence, item response theory
Introduction
Owing to its robustness in predicting job performance, the need of emotional intelligence (EI) instrument increases worldwide since test adaptation to various cultural contexts and languages is continuously growing. Numerous previous research show the robustness of EI as a predictor to job performance,1–4 psychological well-being, customer satisfaction, and organization performance.5
Additionally, EI is found to be positively correlated with effective leadership,6,7 self-efficacy, organizational commitment,7 group performance,8,9 team effectiveness, decision making, coping stress, interpersonal relationship, and general performance.10 The need of a robust and culturally sensitive EI test is therefore growing rapidly.
Numerous research concerning on EI lead to three major theories of EI: Salovey–Mayer model, Goleman model, and Bar-On model.11 However, those models are mainly developed based on studies conducted in developed Western countries. Apart from the fact that mainstream EI theories are the product of research in the context of Western culture, most prior studies tend to neglect cultural differences in emotion, so that it is widely accepted that EI theories are universal.12
Cultural influence on emotion can be manifested in five ways: 1) rules of emotional expression; 2) the value of certain situations and its degree of importance; 3) experience and attitudes toward evaluating and managing emotions; 4) appraising emotion that arises from a particular context or situation; and 5) emotional response, which is often evident in one’s behavior.11,13
Three cultural biases that often occur in most cross-cultural research are construct, methodology, and item bias.14,15 The sources of construct bias are included. 1) Cultural differences on the appropriateness of certain behavioral response, especially if a behavioral response differs across culture, are considered. Taking an item from the Bar-On EI test as an example, “I can easily vent my emotions” contains cultural bias, as emotional expression is heavily determined by cultural imperative. Furthermore, 2) availability limitation of emotional response or overlapped emotional response is proven to be another source of construct bias. Happiness in the Bar-On test, for example, failure in expressing happiness/unhappiness means emotional incapability in western culture. However, Asians tend to conceal their unhappiness, and the success of concealing unhappiness means “emotionally intelligent” in the Asian context.16
Methodology bias occurs when assessment procedure causes unwanted differences between groups. Generally, there are four sources of methodology biases, which are social desirability, distinct response style, variation in stimulus familiarity, and lack of availability of equal sample.14,15 Item content bias often happens due to translation failures or culturally incompatible items.15
Indonesia, as a representation of developing Eastern countries, shows rather different features compared to Western values in regard to workplace situation. According to research conducted by Jones,17 Indonesians obtain a high score of power distance, when measured using Hofstede’s scale of power distance. It leads to a conclusion that Indonesian leaders tend to keep their distance with their subordinates. It is also common in Indonesia that every level in the organization possesses a large distance with a strict and formal hierarchy. An Indonesian leader generally runs a one-man show when it comes to decision making as he/she rarely let his/her subordinates to make important decisions. An Indonesian leader management style is typically centralized, and he/she discourages critics and complaints from his/her subordinates.
With respect to collectivistic–individualistic category, Indonesia is categorized to possess a highly collectivistic culture, which implies that group-oriented or group-motivated tasks are more likeable than individual tasks. Culturally, it is less acceptable to claim a success due to the work of certain individuals. Rather, an achievement is often seen as a shared achievement of all group members involved in the task completion. On masculinity–femininity dimensions, Indonesians are in the middle of the scale, which means that Indonesians prefer to be a people-oriented worker than task-oriented worker. Socializing and maintaining relationship becomes a critical point and even is more important than impressing the supervisor. At last, on uncertainty avoidance dimension, Indonesians tend to embrace uncertainty, or to put it another way, they become more motivated when facing an unfamiliar situation.
To fulfill the need of availability of contextual EI test for recruitment and selection, this study concerned on providing a robust EI test for the Indonesian context. Therefore, we constructed an EI test that we named as the Airlangga Emotional Intelligence Test (Tes Kecerdasan Emosional Airlangga – TKEA). We set a goal of TKEA measurement that it is able to predict the ability of giving appropriate emotional responses based on cognitive appraisal of certain situation, recognizing emotional expression and regulating emotions into effective responses, particularly in the workplace situation.
Since TKEA is constructed to assess individuals’ ability, the ability-based EI model is therefore used, while most existing EI tests were constructed using personality-based EI theories. Ability is defined as individuals’ possible variations in the certain threshold level of task difficulty. With an assumption that the task is performed in a standardized situation, individuals are able to perform successfully on a certain type of task.18 We used this assumption to identify and define EI as an ability, which is particularly different from other EI models.
TKEA consists of three subsets, which are emotional appraisal, emotional recognition, and emotional regulation. Emotional appraisal reflects individuals’ ability to evaluate cognitively emotional information to elicit appropriate responses in the context of workplace. Emotional recognition is the ability to accurately recognize and interpret others’ emotional states and then correctly infer their action. Emotional regulation refers to the appropriateness of adaptive responses to the relevant situation regulating emotional responses.
The research was conducted in three stages: 1) describing situations that evoke emotional responses in the context of Indonesia workplace by using Situational Judgment Test (SJT); 2) determining TKEA subsets; and 3) validating TKEA psychometric qualities. We chose to apply Item Response Theory (IRT) approach in developing TKEA due to the advantages of IRT compared with Classical Test Theory (CTT).19 The IRT model applied in this study was a two-parameter logistic (2PL) model that was able to provide item discriminations (ai) and item difficulties (bi).
Item response theory
Item response theory is a probability model that attempts to explain the relationship between one’s response to an item with latent variables (abilities or trait) that is intended to measure. Participants’ response to an item is an observable variable, while trait or ability is a latent variable that underlies performance on such items.19 Latent variables (e.g., ability) in the IRT are represented with theta (q), where a higher q value indicates a higher probability that one correctly responds to the item. If P(q) expresses a function of one’s ability, the curve should form a smooth S-shaped curve. The curve describes the relationship between the probability of one gives a correct response and his/her ability. The curve is also known as item characteristic curve (ICC), and each item can have its own ICC.20 IRT, in conclusion, uses ICC to describe the relationship between participants’ ability with item performance.20
According to Hambleton et al,21 relationship between participants’ responses with the items that represent certain psychological construct can be denoted by a mathematical function that enables mathematical model construction called item response model (IRM). Various IRMs can be constructed depending on their fundamental assumptions, for instance, a parameter logistic model (1PL), 2PL, or 3PL, those of which differ in their underlying assumptions.21
Before constructing the IRT model, three assumptions must be checked, which are 1) unidimensionality; 2) local independence; and 3) monotonicity. Unidimensionality and local independence are closely intertwined, and particularly for the 2PL model, the presence of unidimensionality can affect local independence and vice versa. When unidimensionality assumption is fulfilled, it means that only one latent variable is being measured. Local independence assumption checks whether item responses are independent. The goodness-of-fit in confirmatory factor analysis (CFA) can be a sufficient assumption check of unidimensionality. In the 2PL model, monotonicity assumption is fulfilled when ICC slope does not decrease if the curve moves to a higher level of latent construct.22
An IRT model increases the likelihood of correctly answering an item that depends on the level of one’s ability and the level of item difficulty (1PL model), item difficulty and discrimination level (2PL model), and additionally, the pseudo guessing level of the item (3PL model). Another key point to remember is that individual ability level (q) and item difficulty level (b) have a similar dimension. Despite theoretically individual ability in general ranging from positive to negative infinity, for practical reason, researcher limit ability ranged from –3 to +3; mean equals to 0 and SD equals to 1.20
Estimating test score is more likely to be close to accurate when the IRT model is robust. Robustness of IRT model can be investigated by describing the nexus between individuals’ ability, item difficulty, discrimination level and pseudo guessing level of the item, than match those parameters with the actual individuals’ ability score. Among various models of IRT, the model that is most suitable to use for multiple choice and dichotomous response questions (dichotomous/binary response) is the logistic model with one, two, or three parameters.
The three parameters include the following. 1) The first parameter is item difficulty parameter (b); the greater value of b relates to higher complexity of the item and the smaller chance for lower ability participants to answer the question correctly. 2) The second parameter is item discrimination parameter (a), which relates to certain variation of participants’ answer as the consequence of having a different ability level. An item with a low discrimination level cannot distinguish participants based on their ability level, while a higher level of discrimination means an item performs splendidly in differentiating participants based on their ability level. 3) The third parameter is guessing parameter (c), which conveys the likelihood of participants to give a correct answer, even though they do not have adequate ability to do so.21
IRT is able to provide information about individuals’ ability or trait based on their responses given and the psychometric properties underlying the items. IRT also provides parameters that help us to understand where the test provides less or more information in regard to individuals’ ability. Each item has its own information function, and it is calculated based on item parameters. The higher the slope value, the more information that the item is able to provide. To give a better and total picture of the function of a test as a whole, we can add all the item information function (IIF) to create a test information function (TIF), which also works as a reliability test in IRT.20
TKEA construction
TKEA is designed to measure three EI domains, which are emotional appraisal, emotional recognition, and emotional regulation. Emotional appraisal subset is designated for measuring how precise an individual cognitively evaluates a certain situation and assumes that emotional response is the outcome arisen from individuals’ cognitive evaluation. Many empirical evidences demonstrate the centrality of cognitive evaluation in understanding emotional response, and cognitive evaluation of emotion may explain why individual responses to a certain situation can significantly differ. It also explains why cognitive appraisal theory of emotion is widely popular to be used as the theoretical basis of EI test development.23 Therefore, we used cognitive appraisal theory of emotion as the basis of item development and scoring system for subset 1.
For developing items and determining correct answer for subset 1, we adhered to Scherer’s24 prediction of emotional-eliciting events. An intercultural study of cognitive appraisal of emotion by Scherer,24 which aimed to construct a theoretical prediction of emotional-inducing situation, resulted in several conclusions as follows. 1) Joy comes out from a conducive event to individuals’ needs and goals. The event also has a high to medium coping potential and is something that is highly expected and is highly compatible with one’s internal and external standards. 2) Fear is predicted to be induced by a sudden event that is caused by others, is obstructive to one’s needs, and makes individuals powerless/helpless. 3) Anger is provoked by a goal-obstructive and sometimes immoral or unjust situation, where one’s ability to cope with the situation is rather low. 4) Sadness is predicted to occur when one faces a low-goal conducive and low-coping potential event, where individuals view that they have low control over the situation, so that it is always attributed to others or impersonal agency. 5) Disgust is predicted to arise from a situation, where one evaluates certain situation as unpleasant and bears an attribution of responsibility to others. At last, 6) shame and guilt are predicted to contain internal attribution and are inconsistent with internal standards, such as idealistic ego and self-esteem.
Emotional recognition subset measures an individual’s ability to recognize one’s emotional state by observing one’s facial expression. Recognizing the subtle meaning of facial expression has been widely investigated as a basic premise of EI. Recognizing facially expressed emotions is defined as an ability to detect at the lowest level of a considerable hierarchical taxonomic model of performance-based EI.25 The ability to accurately recognize others’ facially expressed emotions is a vital socioemotional competence. Facially expressed emotion contains important information of others’ reaction to certain events, which includes our behavior as well. It also conveys information about other’s likely action in the future. Facially expressed emotion recognition is therefore essential in different types of occupation, such as politicians, teachers, medical doctors, and therapists.26 Therefore, one’s ability to correctly recognize the emotional state through observing others’ facial expression became the basis of developing items and scoring system for subset 2.
Generally, one interprets others’ facial expression by considering contextual factors, such as 1) situations that induce expression and 2) the presence of verbal message and various relevant information, which are related to emotional expectation, so that facial expression serves as a meaningful cue of others’ emotional state. Interestingly, most emotional expression studies did not consider its emotional-eliciting context, although most participants reported that they did not extensively use contextual information when making emotional judgement.27 This information plays a vital role to determine one’s emotional evaluation. For example, if emotional-eliciting situations are considered when evaluating emotional expression, it is very possible that one’s interpretation to others’ emotional state can change significantly.
The ability to regulate one’s emotion (subset 3) is a substantial skill that determines whether he/she is emotionally intelligent, so that we chose to include emotional regulation as a subset in TKEA. It substantially predicts individuals’ mental health outcomes, work function,28 and the quality of social relation.29
To measure EI, we designed three subsets that contain a series of tasks, which should be done by participants, as Carroll18 argues that individuals’ ability can be determined by measuring their maximum performance. Therefore, we chose multiple choice-style questions with one correct answer, so that they produce normative score. Carroll18 explains that individual ability consists of three criteria: 1) representing performance or potential performance, where in certain conditions, ability can take shape as the maximum performance; 2) the existence of individual variation is mandatory; and c) there should be a final result that needs to be achieved, for example, successfully delivering certain task, getting a high score, or answering questions correctly. Revelle30 argues that an ability test reflects individuals’ maximum competence, while personality test represents average or patterns of everyday thoughts, feelings, and behaviors.
TKEA was developed by considering the finding of Mayer et al31 that EI can fulfill its role as a form of intelligence if 1) EI can be operationalized as an ability; 2) EI is moderately correlated with the existing intelligence measurement; and 3) EI is proven to show a growth, where EI should gradually increase along with the increase in physical maturity and mental maturity.
Methods
Procedure
TKEA uses paper-based test for its administration method. After verbally agreeing and giving their consent, participants were asked to read the instructions before proceeding to answer the questions. To test the dimensionality of TKEA, we used categorical confirmatory factor analysis (CCFA) for analyzing categorical responses. CCFA evaluates whether test items successfully measure a dominant trait that is coherent with theoretical definition and the content experts’ definition of the trait.
In addition, we performed CCFA to examine which items belong to each factor of the TKEA subset. Low discrimination (low factor loading) items were removed so that overall reliability and construct validity of TKEA were significantly improved.
Prior to conducting the research, we obtained ethical clearance from the Research Ethics Committee, Faculty of Psychology, Airlangga University. All participants were required to give verbal consent prior to participating, and the participants whose faces were used in the item sample (Table 1) gave written consent for their images to be published.
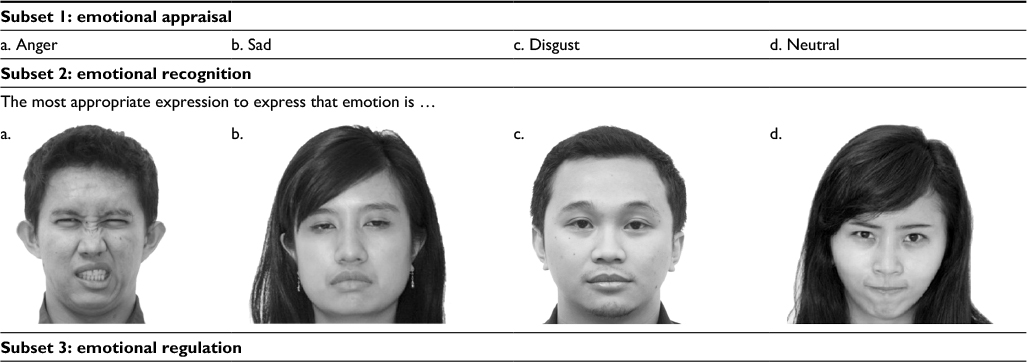 | Table 1 Item sample: A co-worker who you knew had a worst working performance got a better performance score than you. How did you feel in that situation? |
Measure
TKEA is designed to measure three EI domains, which are emotional appraisal, emotional recognition, and emotional regulation. Overall TKEA comprises 120 items that consist of 40 items for each subset. The SJT approach was chosen to construct TKEA items and response options. In the first step, we identified and collected several emotional workplace situations and provided descriptions of these situations, where emotions arose and were needed to be managed. Furthermore, we developed fictional scenarios (vignette), when those later became test items. For each scenario, four responses based on appraisal theories of emotions (constructing emotional appraisal subset) and five responses based on Gross’s emotional regulation model32–35 (for constructing emotional regulation subset) were developed. Next, we asked a number of experts, including five professionals employed as lecturers in psychology and experienced in human resource practice in Indonesia, to assess test items.
The items in the emotional recognition subset were developed using a number of facial figures of Indonesians as facial representations. We assumed that individuals’ proficiency in evaluating emotional expression is higher when observing people from the same ethnic group (in-group advantage). Yet, the skill is less likely to be accurate when observing out-groups, so that sharing similar physical features is essential in recognizing others’ emotional expression.36
Subsets and scoring system
In understanding the process of emotional appraisal when constructing TKEA, we used cognitive appraisal theory as our guideline to determine the scoring system for the emotional appraisal subset (subset 1). We mainly used Scherer’s24 theoretical prediction to determine appropriate emotional-inducing situation, so that participants’ responses would be assessed using this prediction.
To assess the correct answer in the emotional recognition subset (subset 2), we used the target scoring method. Target-based scoring means that we determined target stimulus on emotional recognition items. We asked the model to express certain emotions, and these expressed emotions became the expected/correct answers. Target-based scoring is only suitable for the emotional identification test (or emotional recognition test) and inappropriate for higher ability of EI (e.g., emotional appraisal or emotional regulation).37 Other EI tests, such as Multifactor Emotional Intelligence Scale (MEIS), Emotional Accuracy Research Scale (EARS), and Mannheim University Social Intelligence Test, also use target-based scoring to determine correct responses.38
For selecting correct response for subset 3, we used the expert scoring method. Correct responses for items in subset 3 (emotional regulation) were determined by a number of EI experts, especially in the workplace context. The board of experts consisted of 10 experts: two human resource and development managers of two well-known Indonesian companies (Indomarco and Astra International), two human resource and development consultants, an industrial and organizational psychology lecturer from Universitas Indonesia, and five psychology lecturers from Airlangga University. We asked them to choose one correct answer based on their professional experience and expertise. Afterward, the response, which was mostly chosen by the board of expert, was the correct answer. For example, if the board of expert is asked to choose the correct answer between A, B, C, or D and 60% of experts choose A, 20% choose B, 10% select C, and the rest select D, then when participants choose A, they will get score 1 (correct). If participants choose other than A, they will be scored 0 (incorrect).
Participants
In this research, 752 participants were involved. Research participants were jobseekers who were tested for job selection or promotion in a number of public or private institutions in Surabaya, East Java, Indonesia. More than half of participants (55.19%) were males and the rest (44.81%) were females. Their age ranged from 23 to 56 years. Most of the participants were university leavers with an undergraduate degree (74.73%) or postgraduate degree (17.28%), while a small number of participants were high school leavers (8.38%).
Data analysis
We carried out IRT and CCFA with the help of Mplus v.6 (Muthén & Muthén, Los Angeles, CA, USA) as it allowed us to conduct both analyses simultaneously. We used robust maximum likelihood (MLR) as an estimation procedure that is robust to violations of non-normality, since TKEA produces categorical responses.
CCFA generated the following results: 1) emotional appraisal subset fits unidimensional model (root mean square error approximation [RMSEA] = 0.06; comparative fit index [CFI] = 0.7; Tucker-Lewis index [TLI] = 0.6); 2) emotional recognition subset also fits unidimensional model (RMSEA = 0.03; CFI = 0.9; TLI = 0.9); and 3) emotional regulation subset fits unidimensional model (RMSEA = 0.07; CFI = 0.4; TLI = 0.3). It leads to a conclusion that three subscales of TKEA are unidimensional with no local dependence, that is to say allowing us to carry out item analysis using IRT. We chose the 2PL IRT model to accommodate TKEA’s categorical responses. After conducting CFA, we then formulated the IRT model for analyzing the items.
Results
Descriptive statistics
Table 2 lists the mean, SD, skewness, and kurtosis values for each TKEA. As shown, the mean score for all subsets ranged from 18.88 to 38.15. The emotional appraisal subset is normally distributed, while the rest of the subsets are skewed.
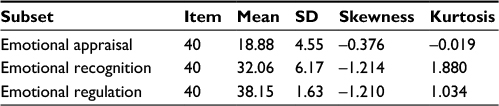 | Table 2 Mean, SD, skewness, and kurtosis values of each TKEA subset Abbreviation: TKEA, Tes Kecerdasan Emosi Airlangga. |
Item analysis
Subset 1: emotional appraisal
Since obtained factor loadings were rather low, the emotional appraisal subset was modeled four times; first, 12 items were removed; second, 15 items were eliminated, and last, additional 18 items were removed.
Table 3 contains item parameters for the emotional appraisal subset. Subset 1 obtained 0.476 value in average for its item discrimination. Most items in subset 1 show moderate discrimination values. The highest discrimination value is possessed by item A38 (0.819), and item with the lowest discrimination value is A19 (0.294).
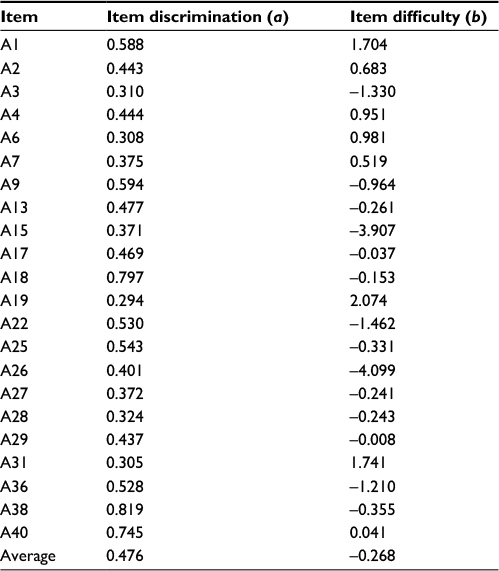 | Table 3 IRT parameter estimates of emotional appraisal subset (n = 22) Abbreviation: IRT, item response theory. |
In regard to item difficulty, subset 1 has an overall average item difficulty of –0.268. The highest level of difficulty is found in item A19 (2.074), while item with the lowest difficulty is A26 (–4.099). According to Hambleton et al21 and Baker,20 item difficulty value <0 implies that the item is easy.
The slope estimation ranged from 0.29 to 0.82, indicating considerable variation in item discrimination. The location parameters for the 22 items reflect a sizeable range of underlying emotional appraisal (–4.09 to 2.07), but most item responses are only endorsed by respondents who have average than higher levels of emotional appraisal, implying that the item set as a whole is most useful in discriminating among individuals at the average ability of emotional appraisal continuum.
Figure 1 displays ICCs for 22 items of subset 1. These items show how ICCs vary depending on the slope parameter as well as the location parameter. The figure demonstrates that it fulfils the assumption of monotonicity, where no decrease is noticeable after the peak of higher level of latent construct. The figure also shows that a participant’s probability of answering correctly increases along with the increase in ability.
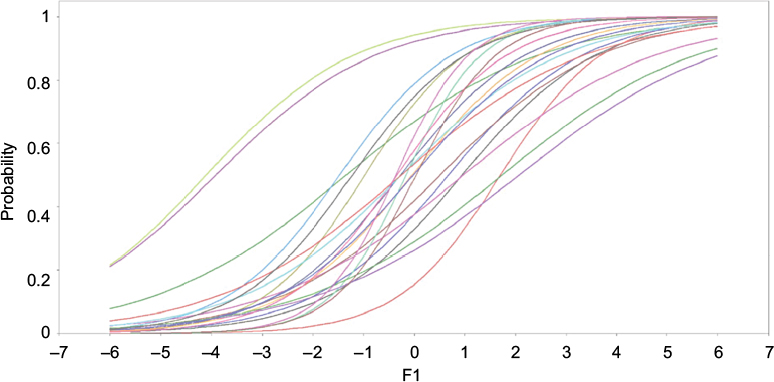 | Figure 1 ICCs of subset 1. Abbreviation: ICC, item characteristic curve. |
The IIF curve (Figure 2) demonstrates how these variations affect measurement precision across the continuum. Item A38 reaches the highest slope and thus retains a maximum information level across all items in subset 1. Meanwhile, item A19 provides the lowest information.
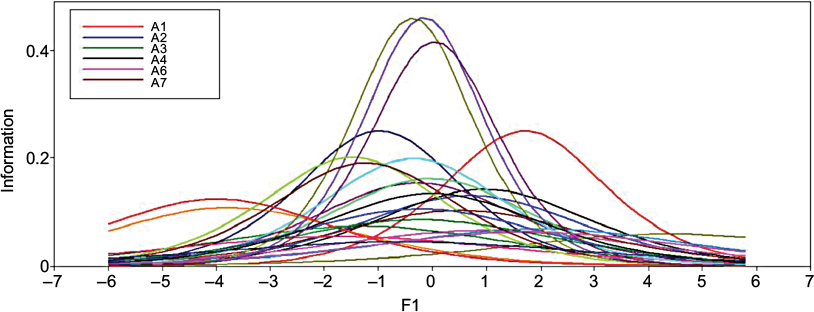 | Figure 2 IIF values of subset 1. Abbreviation: IIF, item information function. |
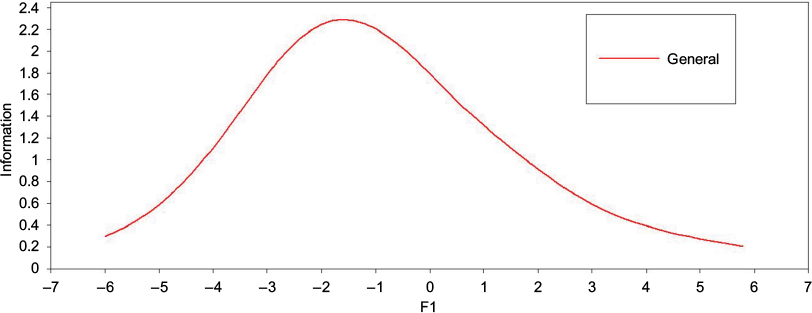
Figure 3 shows TIF of subset 1, which is test information values for subset 1. TIF value for subset 1 is 3.414 at ability level equals to 0 (average). TIF value of subset 1 is relatively high at the average level of the latent trait, with a decrease for those individuals with higher than 2 SD units below and above the mean (q = 0).
 | Figure 3 TIF values of subset 1. Abbreviation: TIF, test information function. |
Subset 2: emotion recognition
Emotion recognition subset modeled once with all 40 items, and there was no item removed.
Table 4 shows discrimination and difficulty parameters for each item in subset 2. In average, item discrimination of subset 2 is 0.668. Overall, all items in subset 2 have moderate item discrimination values. Item with the highest item discrimination value is item B15 (1.018) and that with the lowest item discrimination value is item A18 (0.391). Item with higher values of discrimination are more useful for developing a measurement instrument since they are better at differentiating individuals into different ability levels.19 In regard to item difficulty parameter, subset 2 has averagely low item difficulty, in average –1.606. The highest level of difficulty is found in item B23 (–0.679), while item having the lowest difficulty is item B26 (–2.872).
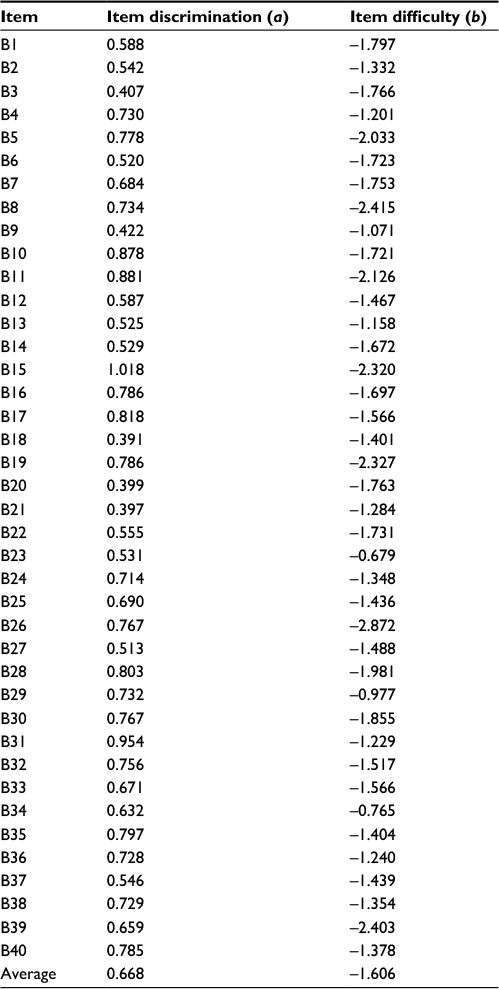 | Table 4 IRT parameter estimates of subset 2 (n = 40) Abbreviation: IRT, item response theory. |
Figure 4 shows ICCs of 40 items in subset 2. These items showed how ICCs varied depending on the parameter slope, as well as the location parameter. The curve confirms that it fulfils the assumption of monotonicity as the probability of a participant answering correctly increases consistently with no decrease detected after reaching the highest peak of higher level of latent construct.
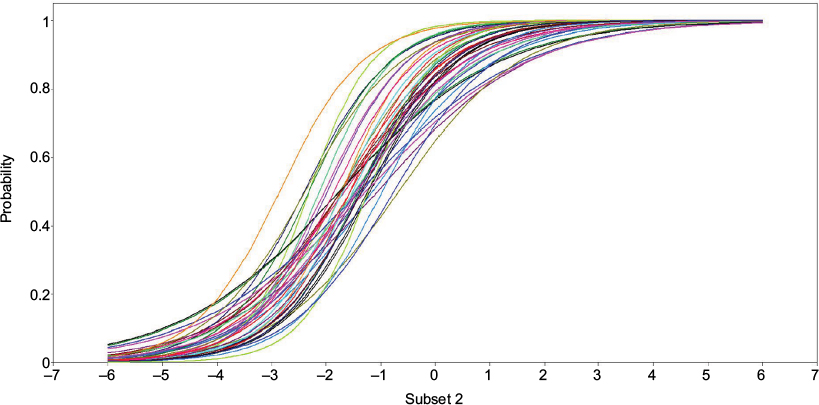 | Figure 4 ICCs of subset 2. Abbreviation: ICC, item characteristic curve. |
The IIF curve (Figure 5) demonstrates how these variations affect measurement precision across the continuum. Item B15 is at the highest slope, thus reaches maximum information levels among the 40 items, while item B18 provides the lowest information.
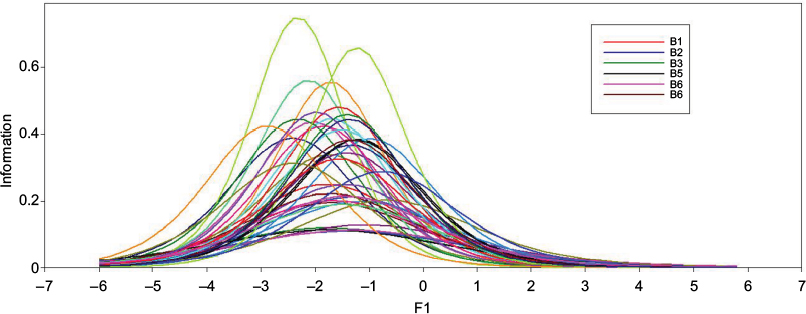 | Figure 5 IIF values of subset 2. Abbreviation: IIF, item information function. |
The slope estimates for the 40 items ranged from 0.39 to 1.01, indicating considerable variation in item discrimination. The location parameters of all items in subset 2 reflect a sizeable range of underlying emotional recognition (–2.87 to –0.68), but the majority of item responses are only endorsed by respondents who have low than average or higher levels of emotional recognition, implying that the item set as a whole is most useful in discriminating among individuals at the low ability of the emotional recognition continuum.
Figure 6 shows TIF of subset 2, which shows 12.183 at the ability level equals to –2. The TIF value of the emotional recognition subset is relatively high at the low level of the latent trait, with a decrease for those individuals >2 SD units below and above q equal to –2.
 | Figure 6 TIF values of subset 2. Abbreviation: TIF, test information function. |
Subset 3: emotional regulation
Owing to its low factor loading, emotional regulation subset was modeled four times; first with all 40 items; then, 28 items were removed; third, 22 items were removed; and at last, 24 items were eliminated.
Table 5 shows the discrimination and difficulty parameters for each item in subset 3. In average, subset 3 item discrimination is 0.478. Most items in subset 3 have moderate discrimination values. Item with the highest item discrimination value is item C6 (0.713), while the item with lowest item discrimination value is item C23 (0.285). In regard to item difficulty parameter, subset 3 has low item difficulty with –1.224 in average. The highest level of difficulty is found in item C29 (1.130), while the item with the lowest difficulty is item C28 (–2.514).
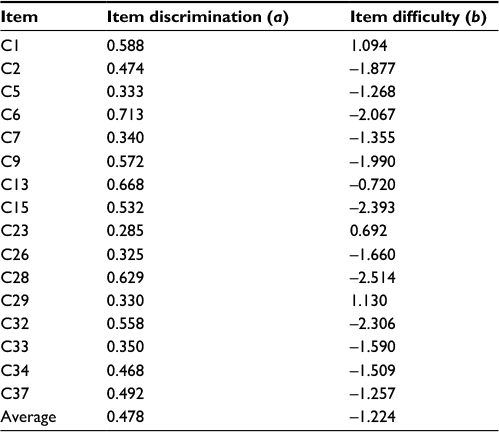 | Table 5 IRT parameter estimates of subset 3 Abbreviation: IRT, item response theory. |
The slope estimates for subset 3 ranged from 0.29 to 0.71, indicating considerable variation in item discrimination. The location parameters of 16 items reflect a sizeable range of underlying emotional regulation (–2.51 to 1.13), but the majority of item responses are only endorsed by respondents who have low than average or higher levels of emotional regulation, implying that the item set as a whole is most useful in discriminating among individuals at low ability of the emotional regulation continuum.
Figure 7 shows ICCs for 16 items of the emotional regulation subset. These items showed how ICCs varied depending on the slope parameter, as well as the location parameter. ICCs of subset 3 items show a similar pattern with subsets 1 and 2. Monotonicity assumption is fulfilled, where no decrease is detected after the peak of higher level of latent construct. The curve also shows that the increase in the probability of answering correctly is linear with the increase in ability.
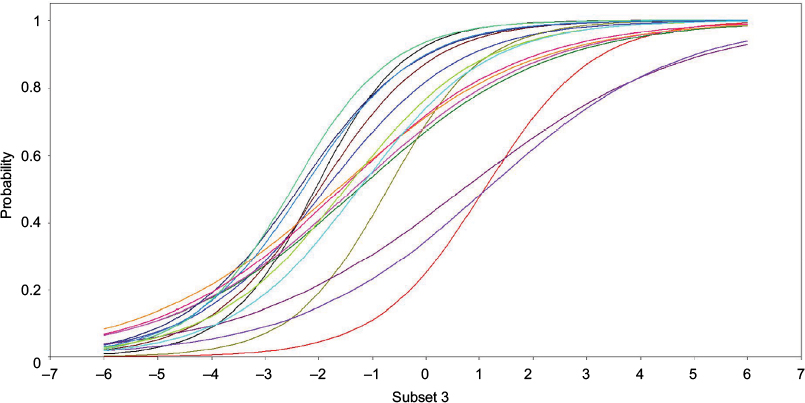 | Figure 7 ICCs of subset 3. Abbreviation: ICC, item characteristic curve. |
The IIF (Figure 8) demonstrates how these variations affect measurement precision across the continuum. Item C6 is at the highest slope, thus reaches maximum information level among the 16 items, while item C23 is at the lowest slope.
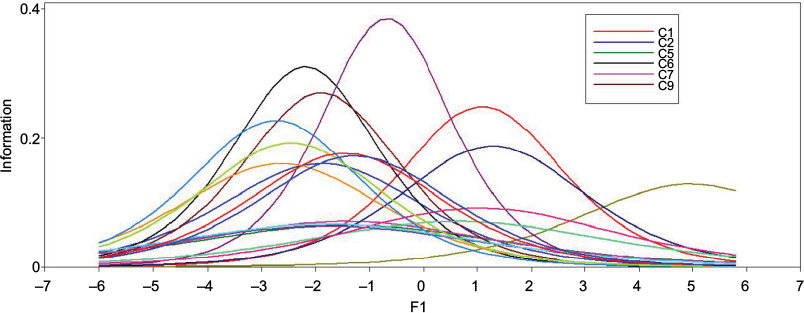 | Figure 8 IIF values of subset 3. Abbreviation: IIF, item information function. |
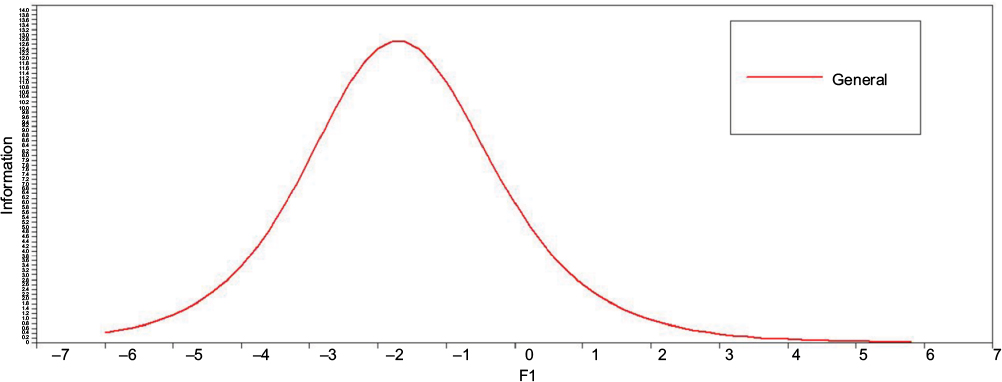
Figure 9 shows TIF of subset 3; the test information value for subset 3 is 2.398 at the level of ability equal to –2. The TIF value of the emotional regulation subset is relatively high at a low level of ability, with a decrease in those individuals >2 SD units below and above the q equal to –2.
 | Figure 9 TIF values of subset 3. Abbreviation: TIF, test information function. |
After conducting IRT analysis of all subsets, there are 10 cases out of 40 that have all completed the remaining three items, which are case numbers 1, 2, 6, 7, 9, 13, 15, 28, 29, and 37. Some of incomplete cases might have good items, yet it could have worked properly if item replacements would have been added and the whole test would have been reanalyzed.
Discussion
Our research aimed to test TKEA internal structure. The internal structure of a psychological testing is closely related to validity, because accurate score interpretation depends on the fitness of internal structure of the test with internal structure of measured construct.39 The internal structure of a psychological scale can be measured by CFA, especially when a researcher provides hypotheses about the scale, which are related to the number of factors or dimensions that become the basis of scale items, the relation between the items and the factors, and the nexus of the factors.39 We also used IRT to test TKEA internal structure according to Muthén and Muthén.40 IRT fits very well to be combined with CFA when it comes to process categorical data.
CFA analysis shows that all TKEA subsets contain no more than one dimension. It implies that each subset only represents one factor, and it fits to measured construct. Therefore, hypothesized measurement is consistent with the actual response of the test.39 Every case in TKEA consists of three items (each item represents one subset), so that TKEA comprises 40 cases (120 items in total). However, as all subsets of TKEA fulfill local independence assumption, therefore, we can conclude that each subset is stand-alone, so that the success/failure in answering an item/subset would not affect participants’ performance of other subsets.
All TKEA items produce factor loading >0.4, while factor loading of certain factors shows individual differences in responding an item are determined by actual discrepancy across individuals.39 A large factor loading, statistically significant and positive item, implies that it reflects its psychological construct very well.39
According to Cohen and Swerdlik,41 a good psychological test is a reliable and valid one. If a test performs well to interpret certain construct, it will be able to measure ability/trait consistently. An unreliable test cannot produce a valid result. IRT assumes that test precision is a conditional information in certain measured trait/ability.42 IRT also assumes that each item can provide information about participants’ level of ability. Item information conveys how functioned an item is to measure ability. A well-functioned item means that it can distinguish participants based on their actual ability.42 An item with a flat curve shows that it fails to differentiate participants’ ability. To put another way, the probability of low-ability participants to correctly answer the item equals to high-ability participants.
An item will be more informative if its ICC slope is steep, its relative difficulty level is close to the participants’ level of ability, and it has a high level of discrimination value and a low level of guessing. If the discrimination level increases, then the information level rises too. On contrary, if the guessing level escalates, then the information level decreases. If the actual ability is further from ability level, either positive or negative, then the information level is nearly zero.20
We chose the IRT approach to develop TKEA for the reason that IRT is more beneficial than CTT. We used 2PL IRT in this research, an IRT model that uses two parameters, providing information about the discrimination level (ai) and the difficulty level (bi). After conducting discrimination level analysis, we found that subsets 1, 2, and 3 obtained a rather moderate discrimination level. That is to say, items in subsets 1, 2, and 3 can differentiate participants’ ability splendidly. However, when we conducted item analysis, we had to remove several items of subsets 1 and 3 due to their low level of discrimination. In its final form, subset 1 consisted of 22 items, subset 2 was intact with 40 items, and subset 3 was left with 16 items.
According to Cohen and Swerdlik,41 there are several possibilities that caused low information level or low discrimination level, which are: 1) item content differs from other items that perform well in measuring psychological construct; 2) item wording is barely appropriate and thus needs to be rewritten; 3) item is too complex for certain educational background; 4) item placement is out of context; and 5) item contains a culturally bias information when used in different population groups.
Our analysis shows that the discrimination level in subset 1 tends to be categorized as moderate to easy, while subsets 2 and 3 are classified as easy. ICC analysis of all items in subsets 1 and 2 demonstrates that the probability of answering correctly increases followed by the increase in individuals’ ability.
TKEA items, especially in subsets 1 and 2, in average are easy items. That is to say, subsets 1 and 2 are more suitable to measure emotional appraisal and emotional recognition ability of low-level ability participants. In the IRT approach, the accuracy of measurement varies depends on the level of measured construct. For instance, a mathematical test in calculus would be very precise in differentiating individuals who are skilled in mathematics. On contrary, it would be barely accurate in measuring individuals who have low literacy in mathematics. In this case, low-skilled participants who take the calculus test would be more likely to find the test extremely difficult, so that they would answer the items wrongly.41
Compared to constructing aptitude or achievement test in an educational setting, constructing EI test is tough, especially when it comes to expect its level of difficulty based on its theory or certain ability level. Recently, there are no research available in leveling EI abilities that can be used as the basis of constructing EI-ability based intelligence test. In future research, it is important to develop high-difficulty EI items for measuring high-level of EI ability by using our research as a starting point. Complexity can be improved by increasing ambiguity in item scenario, so that it needs advanced analysis to solve the problems.
After conducting IRT analysis, we found IIF value for each item, and thus those were calculated and produced TIF of each subset. Subset 1 performs well in measuring emotional appraisal in the ability range of +2 to –2. Subset 2 fits to measuring emotional recognition of individuals in the ability range of –3 to 0 (average). At last, subset 3 is able to measure individuals’ emotional regulation in the ability range of –3 to 1.
Ideally, a good psychological testing should have high TIF in all abilities, yet it can barely be achieved.20 However, the shape of the curve should match to the aim of test construction. By investigating parameter values (difficulty and discrimination value) and IIF of each item, it is still possible to develop a test that measures intended psychological construct. For instance, if someone intends to construct a physics test for physics competition, he can choose items at the top of information curves in the context of measuring high-ability physics. Likewise, in measuring EI for selection purpose, it is suggested to choose items with a high level of complexity, while for diagnosis purpose, we can choose items with moderate-to-low level of complexity, as we need information to improve individuals’ qualities on their emotional skill. Furthermore, the process continues to calculate TIF of each subset and overall TIF. The score of EI can be counted by adding each subset total score.
The IRT approach assumes that accuracy and inaccuracy of measurement are conditional in each level of ability. Information and measurement precision of a test can be revealed by evaluating individuals based on their differences in the ability level. The greater the information value, the higher the measurement precision. IIC is very useful, especially in regard to efficiency. IIC is beneficial to develop a short version of the test by reducing a certain number of overload items. A shorter version of a test can be constructed by selecting items with high-information values and most suitable items from the measured population.
Limitations
Although IRT has more advantages compared to CTT, it has certain obstacles when applying it. The concept is too complex to implement, especially CTT generally is more familiar to test developers.41 Score scaling in IRT is not linear, for instance, in TKEA, when someone manages to answer 10 items correctly, his q score equals to –1.45, while an individual who succeeds in answering 12 items, his q score equals to –1.13. That is to say, every increase in one correctly answered item is not accompanied by a constant increase in the q score. It is therefore problematic to test user to interpret its score as laypeople commonly understand. Additionally, IRT cannot be performed by manual item analysis, yet it can only be conducted using sophisticated statistics software with a large number of test participants.
Acknowledgment
This study is based on Fajrianthi’s doctoral dissertation submitted to Universitas Airlangga. We are very grateful for guidance and substantial feedback provided by Urip Purwono, PhD and Prof. Siti Sulasmi. We also thank Herison Purba, Rosatyani Puspita Adiati, Afif Kurniawan and Tita, whose faces are the part of TKEA items.
Disclosure
The authors report no conflicts of interest in this work.
References
Van Rooy DL, Viswesvaran C. Emotional intelligence: a meta-analytic investigation of predictive validity and nomological net. J Vocat Behav. 2004;65(1):71–95. | ||
Lyons JB, Schneider TR. The influence of emotional intelligence on performance. Pers Individ Dif. 2005;39(4):693–703. | ||
Ono M, Sachau DA, Deal WP, Englert DR, Taylor MD. Cognitive ability, emotional intelligence, and the big five personality dimensions as predictors of criminal investigator performance. Crim Justice Behav. 2011;38(5):471–491. | ||
Prentice C, King B. The influence of emotional intelligence on the service performance of casino frontline employees. Tour Hosp Res. 2011;11(1):49–66. | ||
Karim J, Weisz R. Cross-cultural research on the reliability and validity of the Mayer-Salovey-Caruso Emotional Intelligence Test (MSCEIT). Cross Cult Res. 2010;44(4):374–404. | ||
Kotzé M, Venter I. Differences in emotional intelligence between effective and ineffective leaders in the public sector: an empirical study. Int Rev Admin Sci. 2011;77(2):397–427. | ||
Tsai M-T, Tsai C-L, Wang Y-C. A study on the relationship between leadership style, emotional intelligence, self-efficacy and organizational commitment: a case study of the Banking Industry in Taiwan. Afr J Bus Manag. 2011;5(13):5319–5329. | ||
Jordan PJ, Ashkanasy NM, Härtel CEJ, Hooper GS. Workgroup emotional intelligence. Scale development and relationship to team process effectiveness and goal focus. Hum Resour Manag Rev. 2002;12(2):195–214. | ||
Zampetakis LA, Moustakis V. Managers’ Trait Emotional Intelligence and Group Outcomes: the Case of Group Job Satisfaction. Small Group Res. 2011;42(1):77–102. | ||
Muyia HM, Kacirek K. An empirical study of a leadership development training program and its impact on Emotional Intelligence Quotient (EQ) Scores. Adv Dev Hum Resour. 2009;11(6):703–718. | ||
Mesquita B, Haire A. Emotion and culture. In: Spielberger CD, editor. Encyclopedia of Applied Psychology. Vol. 1. San Diego: Academic Press; 2004:731–737. | ||
Sibia A, Srivastava AK, Misra G. Emotional intelligence: Western and Indian perspectives. J Ind Psychol Abstr Rev. 2003;10:3–42. | ||
Mesquita B, Walker R. Cultural differences in emotions: a context for interpreting emotional experiences. Behav Res Ther. 2003;41(7):777–793. | ||
Byrne BM, Watkins D. The issue of measurement invariance revisited. J Cross Cult Psychol. 2003;34(2):155–175. | ||
van de Vijver F, Tanzer NK. Bias and equivalence in cross-cultural assessment: an overview. Rev Eur Psychol Appl. 2004;54(2):119–135. | ||
Ekermans G. Exploring the Emotional Intelligence Construct: A Cross-cultural Investigation [dissertation]. Swinburne University of Technology, Melbourne; 2009. | ||
Jones ML. Hofstede – culturally questionable? Oxford Business & Economics Conference. Oxford: Oxford University Press; 2007. | ||
Carroll JB. Human Cognitive Abilities: A Survey of Factor-Analytic Studies. Cambridge: Cambridge University Press; 1993. | ||
Embretson SE, Reise SP. Item Response Theory For Psychologists. Mahwah: Lawrence Erlbaum Associates, Inc.; 2000. | ||
Baker FB. The Basics of Item Response Theory. 2nd ed. New York: ERIC Clearinghouse on Assessment and Evaluation; 2001. | ||
Hambleton RK, Swaminathan H, Rogers HJ. Fundamentals of Item Response Theory. Newbury Park: SAGE; 1991. | ||
Holland PW, Rosenbaum PR. Conditional association and unidimensionality in monotone latent variable models. ETS Res Rep Ser. 1985;1985(2):i–37. | ||
Rivera-cruz B. Across Contexts Comparison of Emotional Intelligence Competencies: A Discovery of Gender Differences [Doctoral dissertation]. Case Western Reserve University, Cleveland, USA; 2004. | ||
Scherer K. Profiles of emotion-antecedent appraisal: testing theoretical predictions across cultures. Cogn Emot. 1997;11(2):113–150. | ||
Hildebrandt A, Sommer W, Schacht A, Wilhelm O. Perceiving and remembering emotional facial expressions – a basic facet of emotional intelligence. Intelligence. 2015;50:52–67. | ||
Scherer KR, Scherer U. Assessing the ability to recognize facial and vocal expressions of emotion: construction and validation of the emotion recognition index. J Nonverbal Behav. 2011;35(4):305–326. | ||
Nakamura M, Buck R, Kenny DA. Relative contributions of expressive behavior and contextual information to the judgment of the emotional state of another. J Pers Soc Psychol. 1990;59(5):1032–1039. | ||
Härtel CEJ, Zerbe WJ, Ashkanasy NM. Emotions in Organizational Behavior. New Jersey: Lawrence Erlbaum Associates Publishers; 2005. | ||
Gross JJ, John OP. Individual differences in two emotion regulation processes: Implications for affect, relationships, and well-being. J Pers Soc Psychol. 2003;85(2):348–362. | ||
Revelle W. An Introduction to Psychometric Theory with Applications in R. Persoanlity-Project. 2009. Available from: https://personality-project.org/r/tutorials/R_short_brazil/psychometric-R-overview.pdf. Accessed November 2, 2017. | ||
Mayer JD, Caruso DR, Salovey P. Emotional intelligence meets traditional standards for an intelligence. Intelligence. 1999;27(4):267–298. | ||
Gross JJ. The emerging field of emotion regulation: an integrative review. Rev Gen Psychol. 1998;2(3):271–299. | ||
Gross JJ. Emotion regulation: past, present, future. Cogn Emot. 1999;13(5):551–573. | ||
Gross JJ. Emotion regulation: affective, cognitive, and social consequences. Psychophysiology. 2002;39(3):S0048577201393198. | ||
Gross JJ. Handbook of Emotion Regulation. New York: Guilford Press; 2007. | ||
Elfenbein HA, Ambady N. On the universality and cultural specificity of emotion recognition: a meta-analysis. Psychol Bull. 2002;128(2):203–235. | ||
Roberts RD, Zeidner M, Matthews G. Does emotional intelligence meet traditional standards for an intelligence? Some new data and conclusions. Emotion. 2001;1(3):196–231. | ||
MacCann CE. New Approaches to Measuring Emotional Intelligence: Exploring Methodological Issues with Two New Assessment Tools [dissertation]. University of Sydney Australia; 2006. | ||
Furr MR, Bacharach VR. Psychometrics: An Introduction. Thousand Oaks: SAGE; 2008. | ||
Muthén LK, Muthén BO. Mplus User’s Guide. 7th ed. Muthén & Muthén: Los Angeles, USA; 2010. | ||
Cohen R, Swerdlik M. Psychological Testing and Assessment. Boston: McGraw Hill Higher Education; 2010. | ||
Templin J [webpage on the Internet]. Basic IRT Concepts, Models, and Assumptions [Power Point Slides]. University of Kansas; 2017. Available from: https://jonathantemplin.com/item-response-theory-workshop-summer-2007-ku/. Accessed November 2, 2017. |
 © 2017 The Author(s). This work is published and licensed by Dove Medical Press Limited. The
full terms of this license are available at https://www.dovepress.com/terms
and incorporate the Creative Commons Attribution
- Non Commercial (unported, 3.0) License.
By accessing the work you hereby accept the Terms. Non-commercial uses of the work are permitted
without any further permission from Dove Medical Press Limited, provided the work is properly
attributed. For permission for commercial use of this work, please see paragraphs 4.2 and 5 of our Terms.
© 2017 The Author(s). This work is published and licensed by Dove Medical Press Limited. The
full terms of this license are available at https://www.dovepress.com/terms
and incorporate the Creative Commons Attribution
- Non Commercial (unported, 3.0) License.
By accessing the work you hereby accept the Terms. Non-commercial uses of the work are permitted
without any further permission from Dove Medical Press Limited, provided the work is properly
attributed. For permission for commercial use of this work, please see paragraphs 4.2 and 5 of our Terms.