Back to Journals » International Journal of Nanomedicine » Volume 12
Development of a novel microemulsion for oral absorption enhancement of all-trans retinoic acid
Authors Subongkot T, Ngawhirunpat T
Received 24 May 2017
Accepted for publication 27 June 2017
Published 3 August 2017 Volume 2017:12 Pages 5585—5599
DOI https://doi.org/10.2147/IJN.S142503
Checked for plagiarism Yes
Review by Single anonymous peer review
Peer reviewer comments 2
Editor who approved publication: Dr Thomas Webster
Thirapit Subongkot,1 Tanasait Ngawhirunpat2
1Department of Pharmaceutical Technology, Faculty of Pharmaceutical Sciences, Burapha University, Chonburi, Thailand; 2Department of Pharmaceutical Technology, Faculty of Pharmacy, Silpakorn University, Nakhon Pathom, Thailand
Abstract: This study was aimed to develop a novel microemulsion that contained oleth-5 as a surfactant to enhance the oral absorption of all-trans retinoic acid (ATRA). The prepared microemulsion was evaluated for its particle size, shape, zeta potential, in vitro release, in vitro intestinal absorption, intestinal membrane cytotoxicity and stability. The obtained microemulsion was spherical in shape with a particle size of <200 nm and a negative surface charge. The in vitro release of the ATRA-loaded microemulsion was best fit with the zero-order model. This microemulsion significantly improved the intestinal absorption of ATRA. Confocal laser scanning microscopy analysis using a fluorescent dye-loaded microemulsion also confirmed the intestinal absorption result. The intestinal membrane cytotoxicity of the ATRA-loaded microemulsion did not differ from an edible oil (fish oil). Stability testing showed that the ATRA-loaded microemulsion was more stable at 25°C than 40°C.
Keywords: microemulsion, all-trans retinoic acid, oral absorption enhancement, oleth-5, fish oil
Introduction
Acute promyelocytic leukemia (APL) is a subtype of the white blood cell cancer, acute myeloid leukemia. APL is a life-threatening disease that is caused by an arrest of leukocyte differentiation at the promyelocyte stage. The bleeding abnormality, intravascular coagulopathy that occurs in APL rapidly leads to a fatal outcome in the patients.1
All-trans retinoic acid (ATRA) or tretinoin (Figure 1) is a drug of choice for treatment of APL because it induces the differentiation of immature promyeloblasts into mature granulocytes.2 However, the oral bioavailability of ATRA is poor and variable because of its extremely low water solubility. This limits its therapeutic efficacy in clinical applications.3
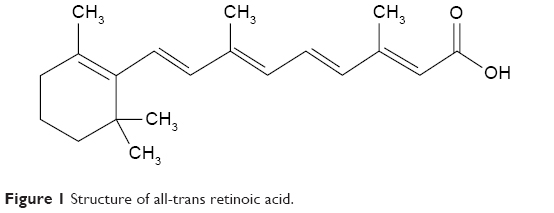 | Figure 1 Structure of all-trans retinoic acid. |
To achieve a therapeutic drug level following oral administration, a drug must be easily absorbed from gastrointestinal (GI) tract. According to Biopharmaceutics Classification System (BCS), drugs that are easily absorbed from the GI tract are water soluble and highly permeable. However, ATRA, which has molecular weight 300 g/mole, is a water-insoluble drug (0.19 μg/mL)4 and has a low permeability (log P=6.3). Therefore, ATRA is classified as BCS class 4 that exhibits very poor oral absorption.
The effective delivery of ATRA in an oral dosage form is very challenging. One report showed that the oral bioavailability of ATRA could be improved by using pegylated ATRA prodrug-based nanomicelles.5 However, the application of this technique for production on a large scale is limited because it requires a complicated synthesis process. Development of a simple method to improve the solubility and oral absorption of ATRA to permit industrial manufacturing is necessary.
Microemulsions (ME) are transparent colloidal systems consisting of oil, surfactant, co-surfactant and water. The advantages of microemulsions are spontaneous formation, thermodynamic stability, the simplicity of manufacture and high-solubilization capacity for both lipophilic and hydrophilic compounds. Microemulsions have been used to improve the solubility and bioavailability of various drugs such as elacridar,6 paclitaxel,7 cyclosporine,8 acyclovir,9 tetramethylpyrazine,10 fexofenadine11 and simvastatin.12
This study, therefore, selected microemulsion as a delivery system to improve ATRA solubility and oral absorption. Novel microemulsion formulations were prepared using oleth-5 as the surfactant, which had never been published before. To permit safe administration as an oral dosage form, fish oil, a dietary source of long-chain omega-3 fatty acids that can reduce plasma triglycerides, was used as the oil phase. The physicochemical properties of prepared microemulsion, including in vitro release, in vitro intestinal absorption, intestinal membrane cytotoxicity and stability, were evaluated. In addition, the penetration of a fluorescent compound-loaded microemulsion through the intestine was also characterized.
Materials and methods
Materials
ATRA was purchased from Jiangxi Hengxiang Pharmaceutical Technology Co., Ltd. (Jiangxi, China) and Sigma Aldrich (St Louis, MO, USA). Fish oil was purchased from Sigma Aldrich. Oleth-5 (Eumulgin 05) was purchased from BASF Corporation (Ludwigshafen, Germany). Transcutol P was purchased from Carlo Erba Reagents (Milan, Italy). Nile red was purchased from TCI (Tokyo, Japan). All other reagents were of analytical grade and were commercially available.
Solubility study
The solubility of ATRA in fish oil and various surfactants was determined by adding an excess amount of ATRA into 2 mL of each vehicle in an amber glass bottle, followed by mixing with a magnetic stirrer at 25°C for 24 h. The suspension was centrifuged at 11,180× g for 10 min to remove the excess ATRA. The supernatant was then, filtered through 0.22 μm membrane after which the concentration of ATRA in the supernatant was measured using high-performance liquid chromatography (HPLC) after an appropriate dilution with isopropyl alcohol. The surfactant that provided the highest solubility of ATRA was chosen as the surfactant for microemulsion preparation with the goal of increasing the solubility of ATRA.
Preparation of microemulsion
Screening of co-surfactants
To determine the appropriate pseudo-ternary phase diagram having the largest microemulsion area, pseudo-ternary phase diagrams for the various co-surfactants were produced. Pseudo-ternary phase diagrams were constructed using the water titration method to obtain the concentration range of components for microemulsion.
To screen the co-surfactants, a microemulsion system that consisted of fish oil as oil phase, the surfactant that provided the highest solubility of ATRA as described in solubility study section, and oleth-5, Transcutol P, PEG-7 glyceryl cocoate (Cetiol HE), Tween 20 or 80 as co-surfactants were combined with distilled water as the water phase. The surfactant/co-surfactant weight ratio was 1:1. The criterion for the selection of pseudo-ternary phase diagram had the largest microemulsion region.
Construction of pseudo-ternary phase diagram of microemulsion
The surfactant and co-surfactant were weighed to produce various ratios (1:1, 1:2, 1:3 and 1:4 w/w) in each glass bottle and were vortexed vigorously for 30 s to produce the surfactant mixture (Sm). Afterward, the oil phase and the Sm were mixed to produce ratios of oil to Sm in the mixtures that varied from 9:1 to 1:9 (w/w). Distilled water was added dropwise to each oil/Sm mixture with gentle stirring to allow equilibration. After the addition of each aliquot of the water phase, the mixture was visually examined for transparency. The transparent mixtures were defined as the microemulsion region.
Solubility of ATRA in microemulsion
An excess amount of ATRA was added to the microemulsion formulations. The samples were continuously stirred for 24 h at 25°C. The suspension was centrifuged at 11,180× g for 10 min to remove the excess ATRA. The supernatant was then collected and filtered through 0.22 μm membrane. The ATRA concentrations in the filtered supernatant were determined using HPLC after an appropriate dilution with isopropyl alcohol.
Preparation of ATRA-loaded microemulsion
Based on the microemulsion region in the pseudo-ternary phase diagrams, a microemulsion system that demonstrated good physicochemical properties was selected. The desirable criteria for choosing the formulations were having a particle size within 20–200 nm with a polydispersity index (PDI) <0.4 without signs of phase separation. ATRA was loaded into the microemulsions at 90% of the respective solubility as determined from the experiments described in Solubility of ATRA in microemulsion section. The microemulsion was prepared by mixing the oil, the surfactant/co-surfactant mixture and water by weight ratio using a magnetic stirrer at ambient temperature. ATRA was accurately weighed and the appropriate weight was added to the microemulsion formulations followed by stirring with a magnetic stirrer at ambient temperature.
Characterization of microemulsion
Mean droplet size, surface charge, size distribution and electrical conductivity
The droplet size, surface charge (zeta potential), size distribution (PDI) and electrical conductivity of the microemulsion formulations with and without ATRA were measured using a dynamic light scattering (DLS) particle size analyzer (Zetasizer Nano-ZS; Malvern Instrument, Malvern, UK) with a 4 mW He–Ne laser at a scattering angle of 173°. All the measurements were carried out under ambient conditions and in triplicate.
Transmission electron microscopy (TEM)
TEM was used to analyze the particle shape and size of ATRA-loaded microemulsion. A droplet of the microemulsion was placed on a formvar-coated copper grid, and the excess sample volume was removed with a sheet of filter paper. After drying, the sample was visualized under the TEM (Philips Tecnai 20; FEI/Philips Electron Optics, Eindhoven, the Netherlands). Microscopy was performed at 80 kV.
Rheological behavior
The rheological properties of ATRA-loaded microemulsion were evaluated by rheometer (Kinexus Pro; Malvern Instrument) using peltier cylinder cartridge (cup and bob). The analysis was carried out with a shear rate ranging from 1 to 97 s−1. All the measurements were carried out at 25°C and in triplicate.
In vitro drug release
The in vitro release was performed in an airtight glass container with light protection. The microemulsion formulation (4 mL) was added to a dialysis bag (CelluSep T2®; Membrane Filtration Products Inc., Seguin, TX, USA) made from regenerated cellulose (molecular weight cut-off 6,000–8,000 Da). The dialysis system was suspended in a release volume of 80 mL 50% v/v ethanol in phosphate-buffered saline (PBS, pH 7.4) that was stirred with a magnetic bar at a rate of 200 rpm at 37°C. A sample of the receiver medium was removed at 0.5, 1, 2, 3, 4, 6, 8, 10 and 24 h and replaced immediately with the same volume of fresh medium (preheated at 37°C before replacement) to maintain a constant volume. The concentration of ATRA in the samples was assayed using HPLC. The cumulative amount of drug released was calculated as a function of time and the release rate was determined. The release kinetics were analyzed using linear regression equations and were fit to zero-order, first-order, and Higuchi diffusion models. The following linear regression equations were used:
Q = Q0 − K0t for zero-order kinetics |
LogQ = logQ0 − K1t/2.303 for first-order kinetics |
Q = Kht1/2 for the Higuchi diffusion model |
where Q is the amount of drug released per unit area at time (t), t is time (h), Q0 = initial amount of drug, K0 = zero order release rate, K1 = first order release rate and Kh = Higushi release rate.
In vitro intestinal absorption study
The in vitro oral absorption study of the ATRA-loaded microemulsion and control (ATRA in fish oil) was performed using Franz diffusion cells based on reports that indicated that porcine intestine can be used to predict human intestinal permeability.13,14 Porcine intestines (ileum) provided by a local slaughterhouse were used as permeability barrier membrane for this study. The intestines were sectioned and washed with PBS to remove the lumen contents prior to the absorption study. The receiver compartment was filled with 6.5 mL of 50% v/v ethanol in PBS (pH 7.4) and stirred with a magnetic bar at a rate of 500 rpm. The diffusion cells were connected to a circulating water bath to maintain the temperature at 37°C. Samples of the receiver medium were removed at 1, 2, 4, 6, 8 and 24 h and replaced with the same volume of fresh medium to maintain a constant volume. The concentration of ATRA in the samples was assayed using HPLC. The cumulative amount of ATRA was plotted against time and the apparent permeability (Papp) was calculated according to the equation given below:
Papp = dQ/dt × [1/(A × C0)] |
where dQ/dt is the linear appearance rate of the ATRA in the receiver compartment, A is the exposed tissue area and C0 is the donor concentration. All experiments were performed in triplicate.
Confocal laser scanning microscopy (CLSM) study
To confirm the in vitro oral absorption study, CLSM was used to evaluate the penetration into the porcine intestine using a fluorescent dye. Nile red, a lipophilic red fluorescent compound that has physicochemical properties (log P=5.0 and molecular weight =318 g/mole)15 similar to those of ATRA was selected as the fluorescent dye. In this study, 2 formulations, fish oil as control and the microemulsion that provided the highest Papp based on the experiments described in In vitro intestinal absorption study section, were evaluated using equal concentration of nile red (0.1 mg/mL).
In vitro intestinal absorption study
The penetration test was performed using Franz diffusion cells as described in In vitro intestinal absorption study section except that the receiver medium was omitted. The donor compartment was filled with 2 mL of nile red in fish oil or the nile red-loaded microemulsion and treated for 3 h. The treated ileum was washed twice with PBS before examination using CLSM.
CLSM evaluation
A piece of the treated ileum described in In vitro intestinal absorption study section was placed on a 22×50 mm coverslip (MENZEL-GLÄSER®, Braunschweig, Germany). Visualization was accomplished using the 10× objective lens system of a Zeiss LSM 510 META inverted microscope (Carl Zeiss, Jena, Germany) equipped with a He–Ne 1 laser (excitation wavelength =543 nm, emission wavelength =580 nm). The tissue was scanned to obtain a series of x–z plane serial images of the Nile red using the laser to scan through the tissue to compare the penetration depths and fluorescence intensity. The fluorescence intensity was determined at the central horizontal line of each image using Zeiss LSM 5 operating software. The mean fluorescence intensity of each image was plotted as a function of the penetration depth.
Evaluation of intestinal membrane cytotoxicity
Lactate dehydrogenase (LDH) cytotoxicity assay
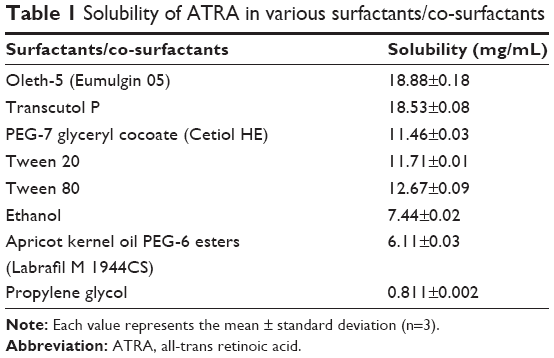
To evaluate the safety of the novel ATRA-loaded microemulsion for oral administration, the intestinal membrane damage was investigated using the LDH activity test. The tested formulations of this study were the ATRA-loaded microemulsion that provided the highest Papp as described in In vitro intestinal absorption study section, ATRA in fish oil, the blank microemulsion and blank fish oil. PBS was used as negative control while 3% w/w Triton X-100 was used as a positive control as reported by Alama et al.16 This study was performed using Franz diffusion cells as described in In vitro intestinal absorption study section with the ileum sample as the membrane and in the absence of receiver medium. A total of 2 mL of each formulation was added to the donor compartment for 2 h. After that, each formulation in the donor compartment was removed, and the membrane was washed with 2 mL of PBS. The obtained PBS was then centrifuged at 1,000× g for 10 min at a temperature of 4°C. The supernatant was assayed for LDH activity using an LDH cytotoxicity detection kit (Roche Diagnostics, Mannheim, Germany). The absorbance was measured in triplicate at 492 nm using a microplate reader (AccuReader M965, Taipei, Taiwan). The percent cytotoxicity was calculated from the absorbance according to the equation below:
|
Histological examination
To evaluate the morphological change of the intestinal tissue after treatment with each formulation, the tissues that had been treated with the ATRA-loaded microemulsion, ATRA-loaded fish oil, negative control (PBS) and positive control (3% w/w Triton X-100) as described in LDH cytotoxicity assay section were cut and fixed with 10% formaldehyde in PBS for 2 days before being dehydrated with ethanol, cleared with chloroform, infiltrated with melted paraffin, and embedded in paraffin. Each tissue was then sectioned at 5 μm and stained with Harris’ hematoxylin and eosin (H&E) for morphological evaluation. The tissue morphology was interpreted by pathologist.
Formulation-stability study
The ATRA-loaded microemulsion that provided the highest Papp in the experiments described in In vitro intestinal absorption study section was stored in light-protected and sealed containers at 25°C and 40°C for 6 months. Both the chemical and physical stability of ATRA were evaluated. The chemical stability was evaluated by determining the remaining ATRA content in the formulations using HPLC. The percentage of the ATRA remaining was compared with the amount on day 0. The evaluations of physical stability included visualization of clarity and phase separation, including particle size and surface charge. The particle size and surface charge were determined by DLS as described in mean droplet size, surface charge, size distribution and electrical conductivity section.
HPLC analysis
The ATRA was assayed by HPLC (Agilent 1260 infinity II LC systems, Agilent Technology, Santa Clara, CA, USA) as previously reported by Charoenputtakhun et al17 using a C18 reversed-phase column (VertiSep UPS C18, Vertical Chromatography; Nonthaburi, Thailand) with dimensions of 5 μm, 4.6×250 mm. The mobile phase composed of an 84.5%:15.0%:0.5% v:v:v mixture of acetonitrile:water:glacial acetic acid. The flow rate was 1.5 mL/min, the injection volume was 20 μL, and the UV detection wavelength was 353 nm. The quantitative analysis of ATRA was obtained from the calibration curve, which had good linearity (r2≥0.999) in the range of 0.05–200 μg/mL. The accuracy of this method was 99.83±0.39. For precision, the percent relative standard deviation was 1.62. The limit of detection and limit of quantitation were 0.039 and 0.118 μg/mL, respectively.
Statistical analysis
All data were statistically analyzed using analysis of variance followed by post hoc testing. Differences of P<0.05 were considered statistically significant.
Results and discussion
Solubility study
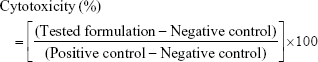
The solubility of ATRA in fish oil was 1.63±0.01 mg/mL. ATRA exhibited the highest solubility in oleth-5 (18.88±0.18 mg/mL) as shown in Table 1. Oleth-5 was therefore selected as the surfactant for microemulsion preparation. The surfactants other than oleth-5 in which the ATRA solubility was >11 mg/mL were selected as candidates for co-surfactant screening.
 | Table 1 Solubility of ATRA in various surfactants/co-surfactants |
Preparation of the microemulsion
Screening of co-surfactants
To screen the co-surfactants, microemulsion systems composed of fish oil as oil phase, oleth-5 as surfactant and water as aqueous phase with the addition of various co-surfactants were studied. The selected co-surfactants for this study were Transcutol P, Cetiol HE, Tween 20 and 80. As shown in Figure 2, oleth-5 and Transcutol P as surfactant and co-surfactant, respectively, provided the largest microemulsion region. Hence, the microemulsion system composed of oleth-5 and Transcutol P as surfactant and co-surfactant, respectively, was chosen for further study.
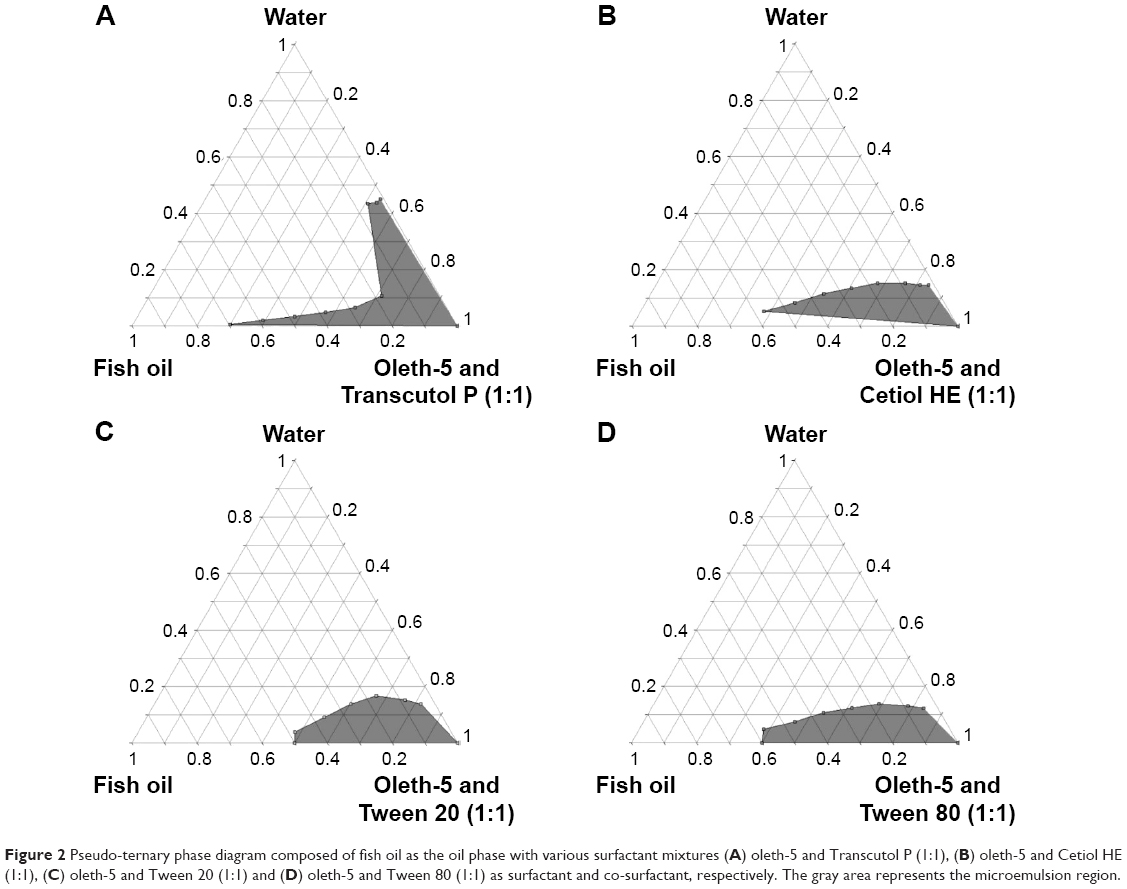 | Figure 2 Pseudo-ternary phase diagram composed of fish oil as the oil phase with various surfactant mixtures (A) oleth-5 and Transcutol P (1:1), (B) oleth-5 and Cetiol HE (1:1), (C) oleth-5 and Tween 20 (1:1) and (D) oleth-5 and Tween 80 (1:1) as surfactant and co-surfactant, respectively. The gray area represents the microemulsion region. |
Construction of pseudo-ternary phase diagram of microemulsion
To obtain the concentration range of the microemulsion components, pseudo-ternary phase diagrams were constructed. The optimal microemulsion formulation could be acquired from the observed microemulsion region. The microemulsion systems composed of fish oil as oil phase, water as the aqueous phase and various ratios of oleth-5 as surfactant and Transcutol P as co-surfactant were studied. The surfactant/co-surfactant mixtures were prepared with the following weight ratios: 1:1, 2:1, 3:1 and 4:1. The pseudo-ternary phase diagrams of microemulsions are shown in Figure 3. In each diagram, the gray area indicates the microemulsion region while the remaining area represents the coarse emulsion region. An increase in the surfactant/co-surfactant mixture ratio resulted in a decrease in the microemulsion region. Dilution by GI fluid may affect the physicochemical properties of a microemulsion formulation and disturb the drug absorption process in the GI tract. To maintain the physicochemical properties of microemulsion throughout the absorption period, a large area of microemulsion region is necessary for formulation selection. Thus, the microemulsion with surfactant/co-surfactant mixture ratio at 1:1 was selected for further study. Four microemulsion formulations that had good stability (absence of phase separation) and a particle size of not more than 200 nm were prepared as shown in Table 2.
 | Figure 3 Pseudo-ternary phase diagram composed of fish oil as the oil phase with various surfactant and co-surfactant mixture (oleth-5 and Transcutol P) ratios (A) 1:1, (B) 2:1, (C) 3:1 and (D) 4:1. The gray area represents the microemulsion region. |
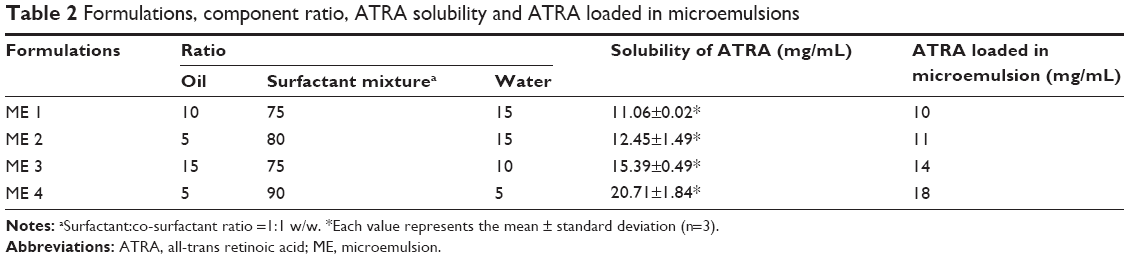 | Table 2 Formulations, component ratio, ATRA solubility and ATRA loaded in microemulsions |
Solubility of ATRA in the microemulsion
The ATRA solubility was in the range of 11.06–20.71 mg/mL as shown in Table 2. The increase in surfactant/co-surfactant mixture and oil phase resulted in enhanced ATRA solubility. Microemulsions can be used to fill soft gelatin capsules for orally convenient administration, but a high concentration of the drug is necessary to minimize the capsule size for ease in swallowing. ATRA was, therefore, loaded into the microemulsion formulations at 90% of their solubility as shown in Table 2.
Characterization of microemulsion
Mean droplet size, surface charge, size distribution and electrical conductivity
Both the microemulsion with ATRA (ATRA-loaded microemulsion) and without ATRA (blank microemulsion) were examined for their particle size, zeta potential, PDI and conductivity as shown in Table 3. The particle size of the blank microemulsion was between 38 and 102 nm whereas the ATRA-loaded microemulsion was between 42 and 178 nm. The average particle size of the ATRA-loaded microemulsion was significantly higher than that of the blank microemulsion, which indicated that the addition of ATRA increased the particle size of the microemulsion. The zeta potential of blank microemulsion was neutral whereas the ATRA-loaded microemulsion had a negative charge because ATRA is an acidic drug (pKa ~4). Under neutral conditions (pH ~7), the ATRA-loaded microemulsion, therefore, had a negative charge. The PDI of the blank microemulsion was between 0.292 and 0.387 whereas that of the ATRA-loaded microemulsion was between 0.28 and 0.53. Only for ME 4 did the ATRA-loaded microemulsion have a significantly greater PDI than the blank microemulsion. Since it is highly lipophilic, the addition of a very large amount ATRA (18 mg/mL) resulted in a change in the oil phase ratio of microemulsion region. Therefore, the particle size distribution became broader.
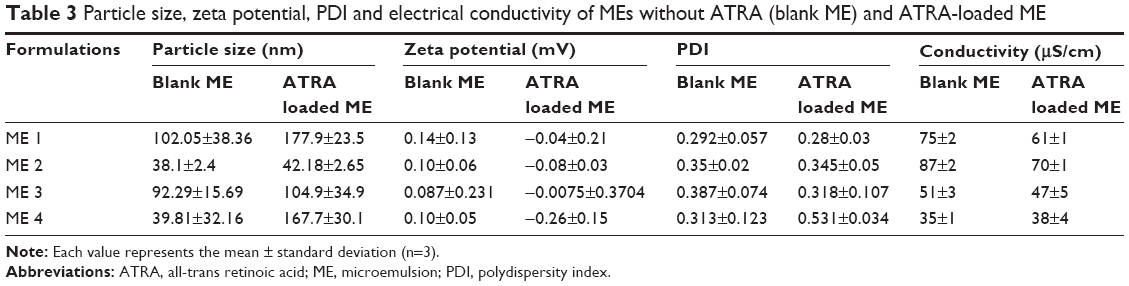 | Table 3 Particle size, zeta potential, PDI and electrical conductivity of MEs without ATRA (blank ME) and ATRA-loaded ME |
Theoretically, there have been 3 microemulsion types, which are oil-in-water microemulsion, bicontinuous microemulsion and water-in-oil microemulsion.18,19 The oil-in-water microemulsion is occurred when the ratio of oil is lower than water. Conversely, the water-in-oil microemulsion is presented when the ratio of water is lower than oil. In system in which the ratio of oil and water are similar, the bicontinuous microemulsion is formed.20 The spherical nanoparticles can be seen from oil-in-water and water-in-oil microemulsion whereas non-spherical nanoparticles are the proposed structure of bicontinuous microemulsion.20 The electrical conductivity is the useful parameter, which can be used to evaluate the type of microemulsion. According to the microemulsion type evaluation using electrical conductivity measurements by Djordjevic et al,21 microemulsion formulation in which the ratio of oil phase was higher than water phase having conductivity between 2.9 and 3.8 μS/cm was water-in-oil microemulsion. For microemulsions in which the ratio of water phase was higher than oil phase having conductivity ranging from 10.3 to 52.5 μS/cm were bicontinuous microemulsion, whereas microemulsions having conductivity ranging from 80.5 to 94.3 μS/cm were oil-in-water microemulsion. Gundogdu et al11 reported that the conductivity of water-in-oil microemulsion (the ratio of oil phase was higher than water phase) was 1.1 μS/cm. Xing et al22 prepared 3 microemulsion formulations in which all formulations had the ratio of water phase more than oil phase. They found that their microemulsion had electrical conductivity between 65 and 71 μS/cm and concluded that all microemulsion formulations were oil-in-water microemulsion. Since there have been no reports about the cut-off value of electrical conductivity for microemulsion-type evaluation. The criteria were, therefore, set based on the previously described literatures in order to identify microemulsion type using both the ratio of oil and water phase and electrical conductivity. The microemulsion-type identification was considered mainly from the ratio of oil and water phase followed by electrical conductivity. If the ratio of oil phase is more than water phase, it will be water-in-oil microemulsion. If the ratio of water phase is more than oil phase and the conductivity is higher than 52.5 μS/cm, it will be oil-in-water microemulsion. It will be bicontinuous microemulsion, when the ratio of water phase is equal to oil phase or the ratio of water phase is more than oil phase with the conductivity not more than 52.5 μS/cm.
The conductivity of blank microemulsion ranged from 35 to 87 μS/cm whereas that of the ATRA-loaded microemulsion ranged from 38 to 70 μS/cm. According to the above criteria, this suggested that blank ME 1, ATRA-loaded ME 1, blank ME 2 and ATRA-loaded ME 2 were oil-in-water microemulsion. Blank ME 3 and ATRA-loaded ME 3 were water-in-oil microemulsion. Blank ME 4 was bicontinuous microemulsion. Although ATRA-loaded ME 4 had the ratio of water phase equal to oil phase, very large amount of highly lipophilic drug was added and the spherical particles were still observed as evaluated by TEM (Figure 4D). Therefore, ATRA-loaded ME 4 was water-in-oil microemulsion.
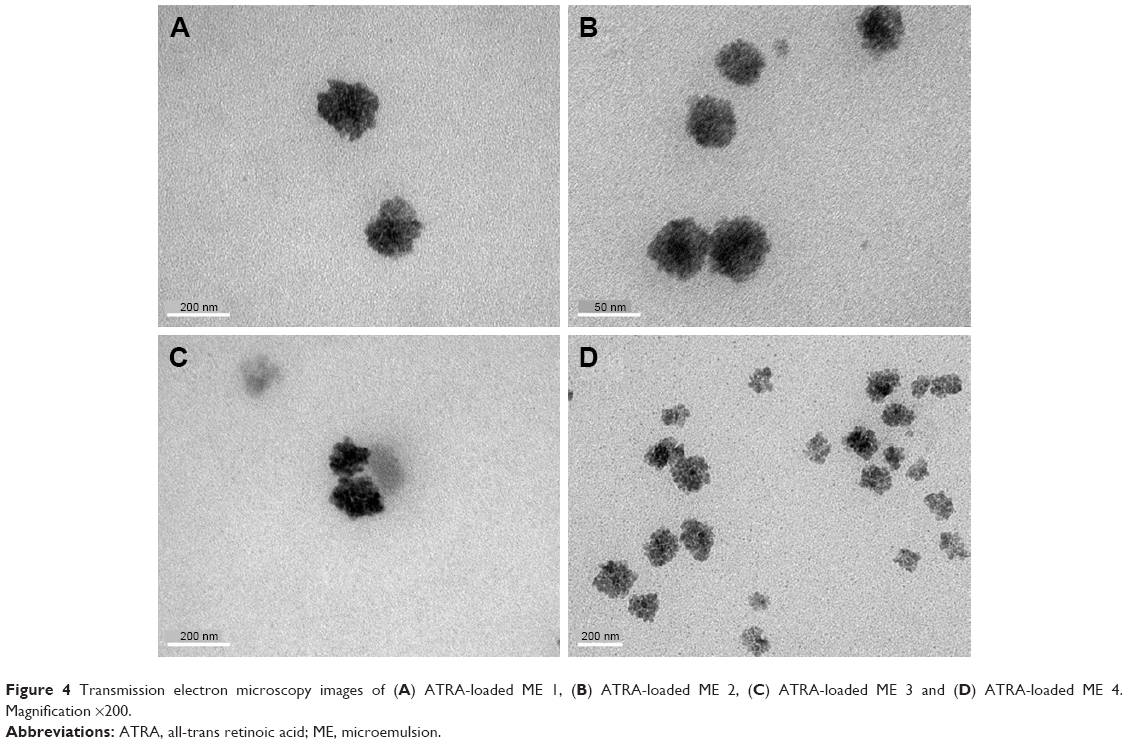 | Figure 4 Transmission electron microscopy images of (A) ATRA-loaded ME 1, (B) ATRA-loaded ME 2, (C) ATRA-loaded ME 3 and (D) ATRA-loaded ME 4. |
ATRA-loaded ME 1 and ATRA-loaded ME 2 had average conductivities significantly lower than blank ME 1 and blank ME 2, respectively. The addition of ATRA, which is highly lipophilic drug, in microemulsion led to the decrease of the conductivity by increasing the ratio of oil phase, especially in oil-in-water microemulsion. These results agreed with the result of Djekic et al23 that the addition of lipophilic drug (ibuprofen) resulted in the decrease of the conductivity of oil-in-water microemulsion when compared with blank microemulsion. However, the average conductivities of ATRA-loaded ME 3 and ATRA-loaded ME 4 were not significantly different compared with blank ME 3 and blank ME4, respectively. Since ME 3 and ME 4 were water-in-oil microemulsion and bicontinuous microemulsion, respectively, containing very low amount of water, the addition of ATRA, therefore, did not affect their conductivities.
Transmission electron microscopy
The TEM images of all of the microemulsion formulations (ME 1-ME 4) demonstrated nanospheres as shown in Figure 4. The average sizes of ME 1, ME 2, ME 3 and ME 4 were 186.55±10.68, 44.73±4.29, 112.31±6.46, 165.98±14.56 nm, respectively. The average particle sizes obtained from DLS were not significantly different from those obtained using the TEM technique.
Rheological behavior
The rheological behaviors of ATRA-loaded ME 1, ATRA-loaded ME 2, ATRA-loaded ME 3 and ATRA-loaded ME 4 are shown in Figure 5. The rheological profiles revealed that all ATRA-loaded microemulsion exhibited a linear relationship between shear rate and shear stress, indicating that ATRA-loaded microemulsion demonstrated a Newtonian flow behavior.24
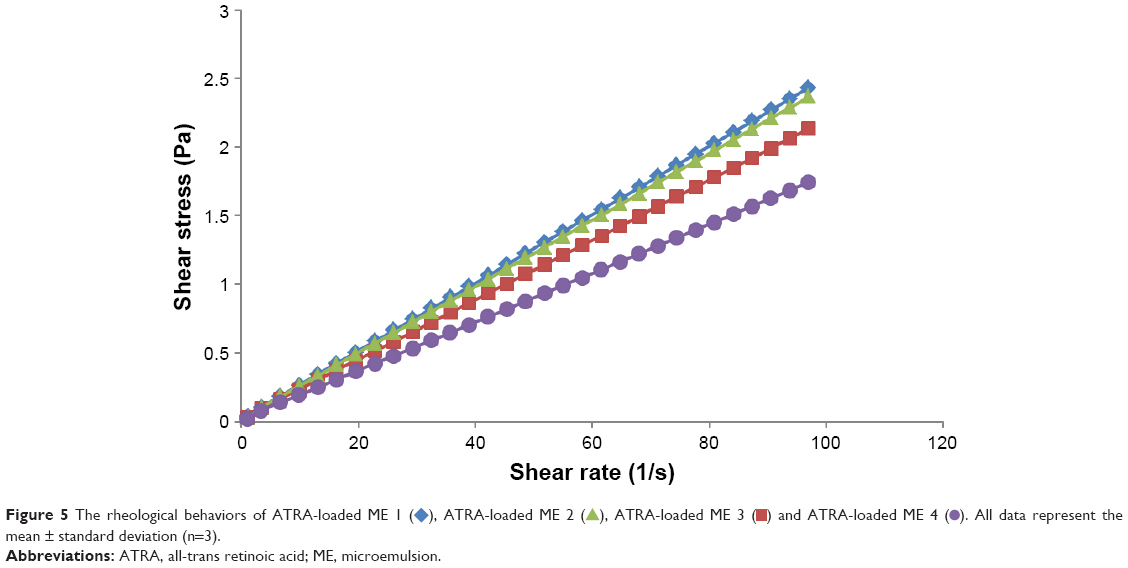 | Figure 5 The rheological behaviors of ATRA-loaded ME 1 ( |
 ), ATRA-loaded ME 2 (
 ), ATRA-loaded ME 3 (
 ) and ATRA-loaded ME 4 (
 ). All data represent the mean ± standard deviation (n=3).
In vitro drug release
The in vitro release profiles of ATRA from the various microemulsion formulations are shown in Figure 6. The release kinetics of ATRA from each microemulsion formulation were evaluated by fitting with the zero-order, first-order and Higushi models. Based on the coefficient of determination (R2), the zero-order model was found to provide the best fit for the ATRA release profiles of all microemulsion formulations as shown in Table 4. The release rate for ME 1 was significantly greater than those for ME 3 and ME 4. The release rate of ME 1 was not significantly different from that of ME 2. There were no significant differences in the release rates between ME 3 and ME 4. Regarding the type of microemulsion as evaluated by electrical conductivity, ATRA-loaded ME 1 and ATRA-loaded ME 2 were oil-in-water microemulsion while ATRA-loaded ME 3 and ATRA-loaded ME 4 were water-in-oil microemulsion. The ATRA release rate correlated with the type of microemulsion that the release rate of oil-in-water microemulsion was higher than water-in-oil microemulsion.
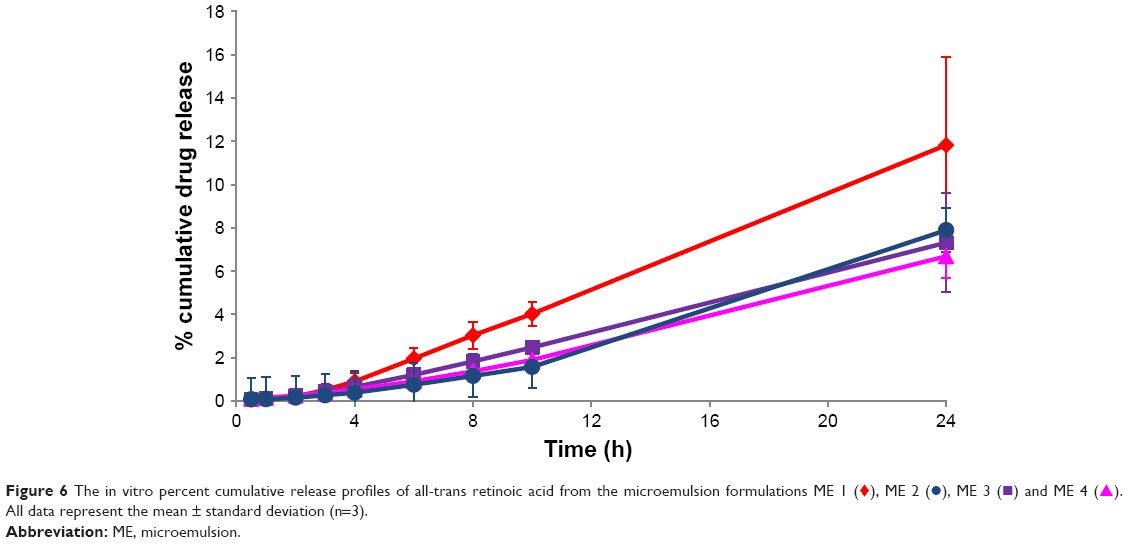 | Figure 6 The in vitro percent cumulative release profiles of all-trans retinoic acid from the microemulsion formulations ME 1 ( |
 ), ME 2 (
 ), ME 3 (
 ) and ME 4 (
 ). All data represent the mean ± standard deviation (n=3).
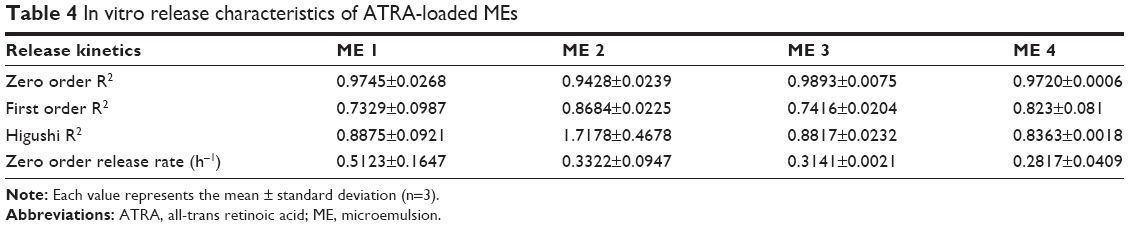 | Table 4 In vitro release characteristics of ATRA-loaded MEs |
Djordjevic et al25 investigated the effect of oil-in-water microemulsion and water-in-oil microemulsion on release rate of diclofenac diethylamine, a drug that can be solubilized in oil more than in water. Our results agreed with their findings, which revealed that oil-in-water microemulsion had drug release rate more than water-in-oil microemulsion.
In vitro intestinal absorption study
Since the solubility of ATRA in fish oil was 1.63±0.01 mg/mL, fish oil was combined with ATRA at 1.4 mg/mL (90% of its solubility) for use as the control for this study. The Papp values for ATRA in the control and various ATRA-loaded microemulsion formulations are shown in Table 5. Only the Papp for ATRA-loaded ME 4 was significantly higher than that of the control. Since the control formulation was a simple lipid solution whereas the microemulsion formulations were nanoscale-sized vesicles, the possible absorption enhancement mechanism might involve the vesicles as drug carriers and surfactants as absorption enhancer.
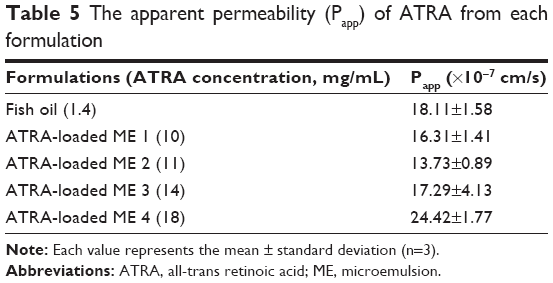 | Table 5 The apparent permeability (Papp) of ATRA from each formulation |
Generally, colloidal drug carriers increase lipophilic drug absorption by solubility enhancement, in which drug can be absorbed through the intestinal membrane as the free drug or drug entrapped in vesicles. According to the in vitro release study described in In vitro drug release section, ATRA-loaded ME 4 had a low release rate. This result indicated that free drug absorption might not be a major mechanism for the enhanced intestinal absorption. The major absorption enhancement mechanism for the microemulsions might involve the vesicles as drug carriers. However, the formulation, which could increase the absorption of ATRA was only ATRA-loaded ME 4 that contained the highest amount of surfactant mixture (90% of total weight). This suggested that the proportion of surfactant in microemulsion formulation played an important role in the intestinal drug absorption enhancement more than the type of microemulsion.
Theoretically, lipid-based formulations can improve drug absorption by increasing membrane fluidity and facilitating transcellular absorption, opening tight junctions to allow drug transport, inhibiting P-glycoprotein-mediated drug efflux, and enhancing lymphatic drug transport.26 These studies suggested that the vesicle drug carriers, especially microemulsion enhanced drug absorption from various mechanisms as described above.
CLSM study
According to the in vitro intestinal absorption study described in In vitro intestinal absorption study section, ME 4 provided the highest Papp values. Therefore, ME 4 was selected for loading with Nile red to compare the penetration depths and fluorescent intensity with the control (Nile red in fish oil).
Figure 7A1 and B1 show the serial x–z plane images at different penetration depths for nile red in fish oil and nile red-loaded ME 4. Nile red in fish oil could penetrate to 50 μm while the nile red-loaded ME 4 could penetrate to 80 μm. The fluorescent intensity profiles of Nile red at various penetration depths for the fish oil control and ME 4 are shown in Figure 8. ME 4 also demonstrated a higher fluorescent intensity of the nile red than fish oil.
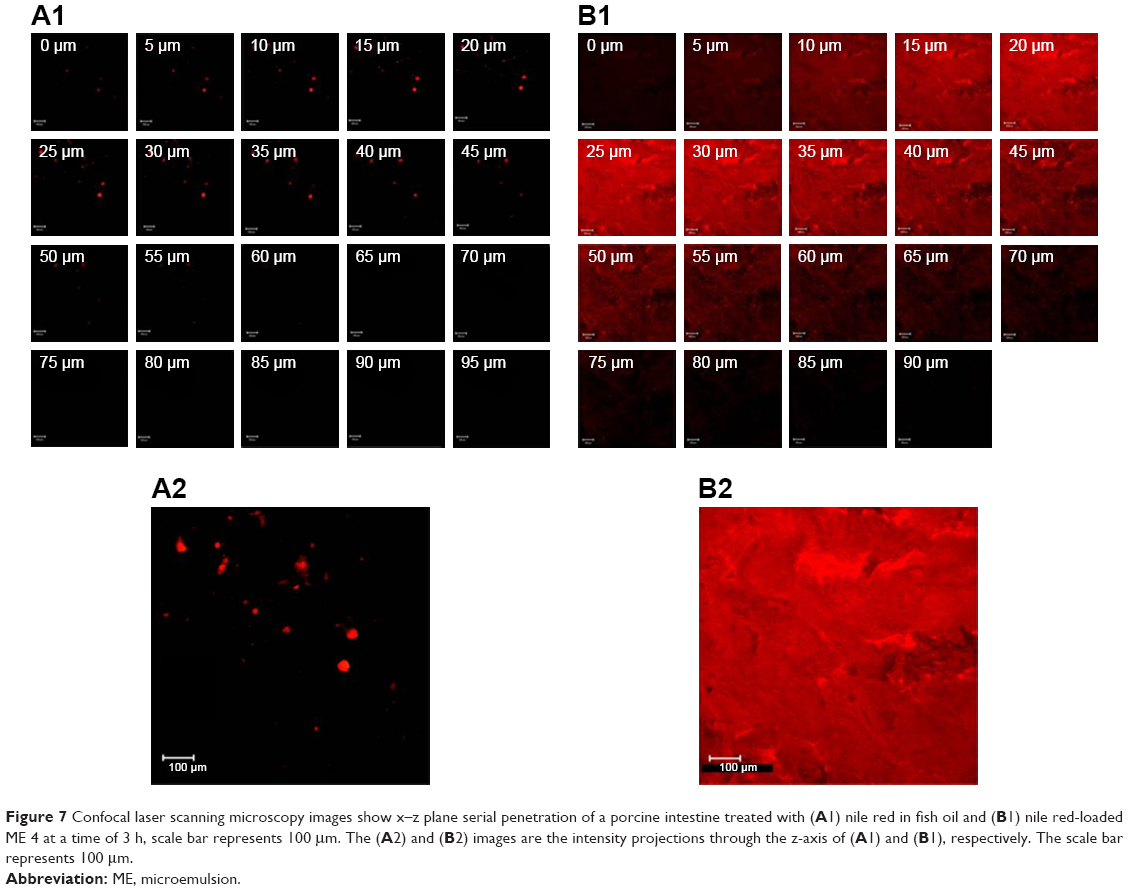 | Figure 7 Confocal laser scanning microscopy images show x–z plane serial penetration of a porcine intestine treated with (A1) nile red in fish oil and (B1) nile red-loaded ME 4 at a time of 3 h, scale bar represents 100 μm. The (A2) and (B2) images are the intensity projections through the z-axis of (A1) and (B1), respectively. The scale bar represents 100 μm. |
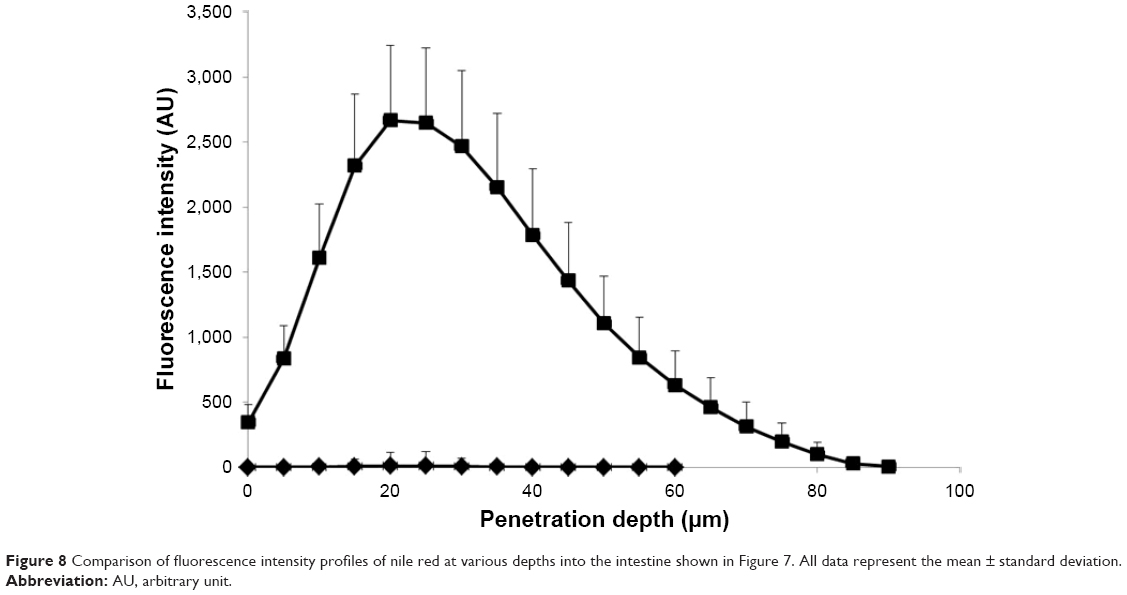 | Figure 8 Comparison of fluorescence intensity profiles of nile red at various depths into the intestine shown in Figure 7. All data represent the mean ± standard deviation. |
These findings agreed with the in vitro intestinal absorption study that ME 4 could increase absorption of lipophilic molecules when compared with control.
Evaluation of intestinal membrane damage
LDH cytotoxicity assay
To evaluate the safety of the microemulsion for oral administration, the LDH cytotoxicity assay was applied for comparison with the edible oil (fish oil) as a control. The percent cytotoxicity of the blank fish oil, blank ME 4, ATRA in fish oil and ATRA-loaded ME 4 are shown in Table 6. The percent cytotoxicity of the blank fish oil was not significantly different from ATRA in fish oil, and the percent cytotoxicity of the blank ME 4 was also not significantly different from the ATRA-loaded ME 4, which indicated that the addition of ATRA did not affect the cytotoxicity. The percent cytotoxicity of the blank fish oil was not significantly different from the blank ME 4, which indicated that the amount of the surfactant mixture in microemulsion did not affect the cytotoxicity. The percent cytotoxicity of the blank ME 4 was less than that of ATRA in fish oil. There were no significant differences among the blank fish oil, ATRA in fish oil and ATRA-loaded ME 4. The percent cytotoxicity was not significantly different between the ATRA-loaded ME 4 and blank fish oil. These findings suggested that the ATRA-loaded ME 4 was safe for oral administration because the percent cytotoxicity of the ATRA-loaded ME 4 did not differ from that of fish oil, an edible oil, which is generally used as food supplement.
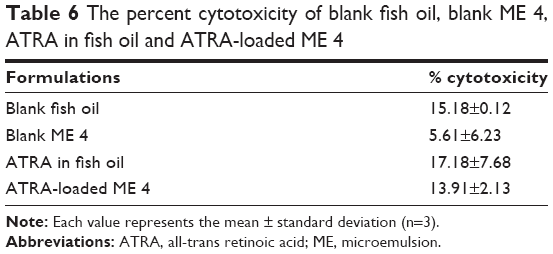 | Table 6 The percent cytotoxicity of blank fish oil, blank ME 4, ATRA in fish oil and ATRA-loaded ME 4 |
Histological examination
After being treated with each formulation for the LDH cytotoxicity assay, the intestinal tissues were stained with H&E stain to evaluate their morphological changes. The tissues that were treated with PBS, 3% w/w Triton X-100, ATRA in fish oil and ATRA-loaded ME 4 are shown in Figure 9A–D, respectively. Figure 9A shows that in the tissues that were treated with PBS, the villi were highly intact and the intestinal glands were viable. The tissue treated with 3% w/w Triton X-100 showed severe degeneration of the villi, as seen in Figure 9B; however, the intestinal glands were still viable. Figure 9C shows tissue that was treated with ATRA in fish oil in which the villi were intact and villus cells were viable compared with the tissue that was treated with 3% w/w Triton X-100 (Figure 9B). Figure 9D shows tissue that was treated with ATRA-loaded ME 4 in which villi were still intact, and the villus cells, as well as the intestinal glands, were viable compared with the tissue that was treated with 3% w/w Triton X-100 (Figure 9B). The villi of the tissue that had been treated with the ATRA-loaded ME 4 (Figure 9D) did not differ from the villi of the tissue that had been treated with ATRA in fish oil (Figure 9C). These morphological changes agreed with the LDH cytotoxicity evaluation that the cytotoxicity of the ATRA-loaded ME 4 did not differ from that of ATRA in fish oil.
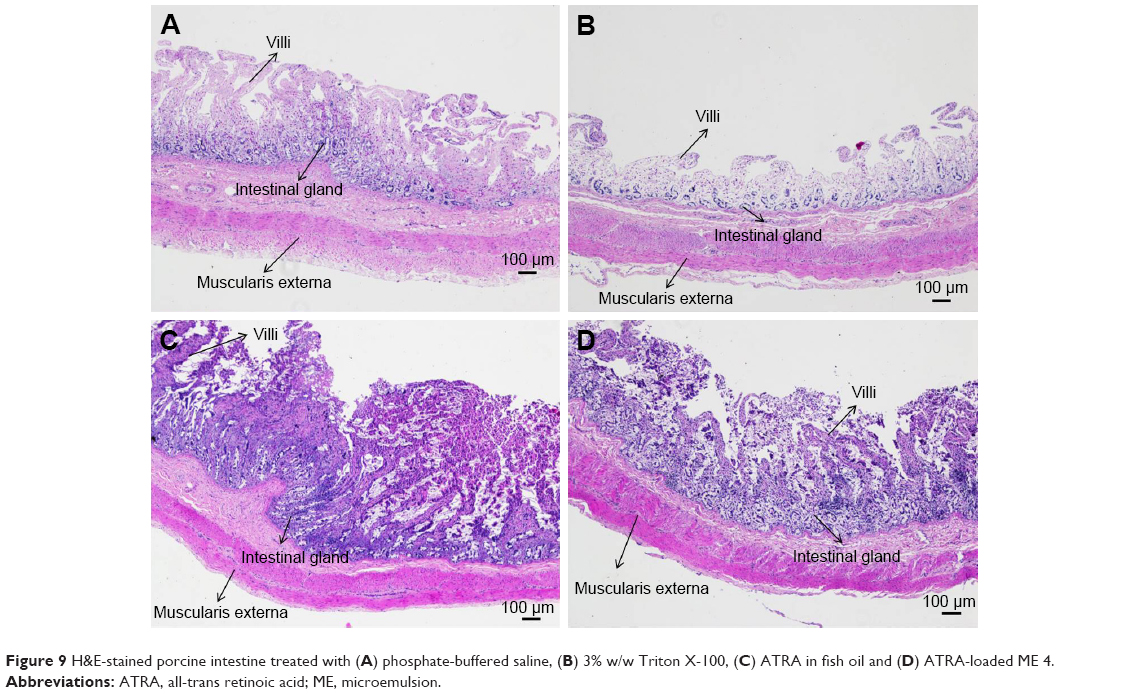 | Figure 9 H&E-stained porcine intestine treated with (A) phosphate-buffered saline, (B) 3% w/w Triton X-100, (C) ATRA in fish oil and (D) ATRA-loaded ME 4. |
Formulation-stability study
Although microemulsion is generally regarded as thermodynamically stable, the increase in the amount of lipophilic drug loaded in microemulsion resulting in the instability of microemulsion such as translucent and phase separation.27 The ATRA-loaded ME 4 was stored at 25°C and 40°C to evaluate its chemical and physical stability. During storage at 25°C or 40°C for 6 months, the microemulsion was still transparent and there was no phase separation or drug precipitation. The percentages of ATRA remaining at 25°C and 40°C after 1, 2, 3, 4, 5 and 6 months compared with baseline are shown in Figure 10. At 6 months, the average percentage of ATRA remaining at 25°C was 64.68±1.84 whereas the value at 40°C was 57.67±0.93. The average percentage of ATRA remaining at 25°C was significantly higher than at 40°C, indicating that the ATRA-loaded ME 4 was more stable at 25°C than 40°C.
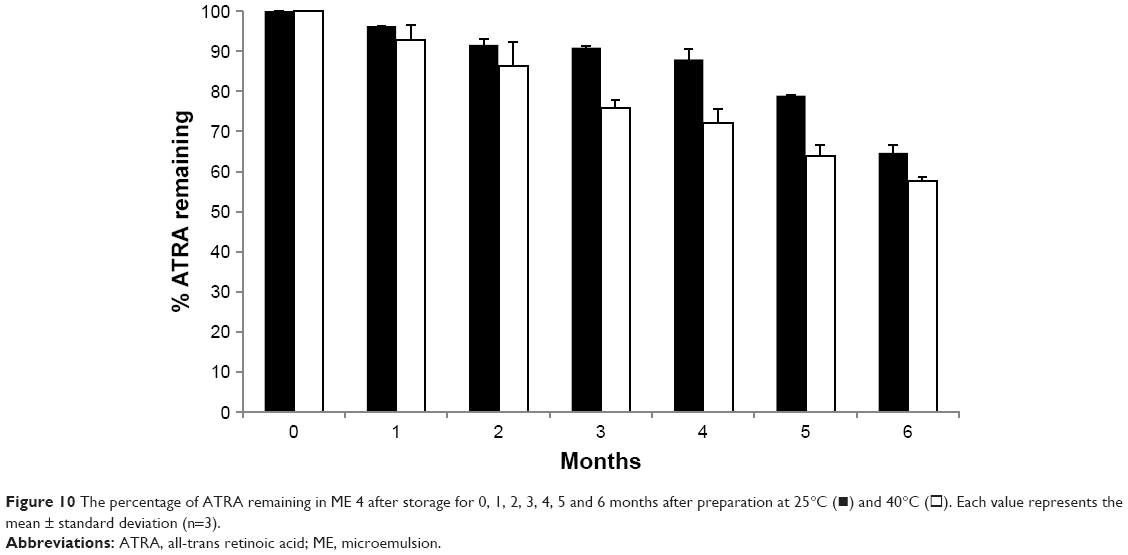 | Figure 10 The percentage of ATRA remaining in ME 4 after storage for 0, 1, 2, 3, 4, 5 and 6 months after preparation at 25°C (■) and 40°C (□). Each value represents the mean ± standard deviation (n=3). |
Tables 7 and 8 show the average particle sizes and zeta potentials for the ATRA-loaded ME 4 at baseline, 1, 2, 3, 4, 5 and 6 months after preparation when stored at 25 or 40°C. The average particle sizes of the ATRA-loaded ME 4 at 1, 2, 3, 4, 5 and 6 months after preparation at either 25°C or 40°C did not significantly differ from that baseline. These results indicated that the storage temperature did not affect the particle size of the ATRA-loaded ME 4.
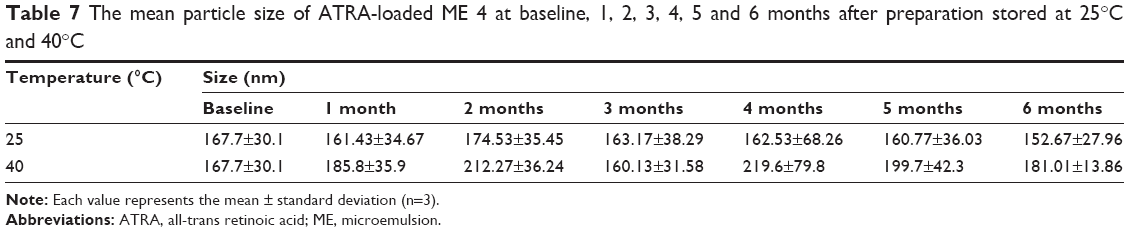 | Table 7 The mean particle size of ATRA-loaded ME 4 at baseline, 1, 2, 3, 4, 5 and 6 months after preparation stored at 25°C and 40°C |
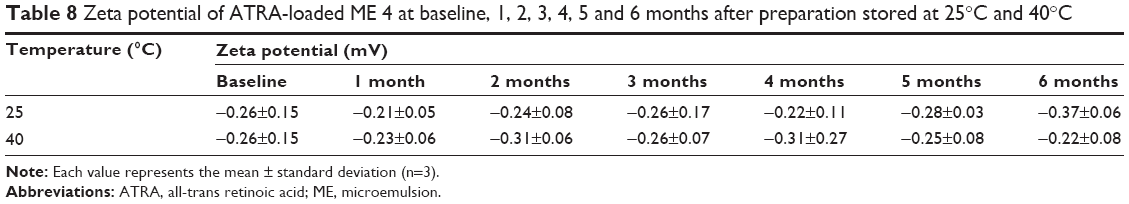 | Table 8 Zeta potential of ATRA-loaded ME 4 at baseline, 1, 2, 3, 4, 5 and 6 months after preparation stored at 25°C and 40°C |
The average zeta potentials for the ATRA-loaded ME 4 at 1, 2, 3, 4, 5 and 6 months after preparation at either 25°C or 40°C also did not significantly differ from the value observed at baseline. These results indicated that the storage temperature did not affect the zeta potential of the ATRA-loaded ME 4. There was a report showing that the larger negative zeta potential of emulsion droplets was an important factor for emulsion stability.28 According to the microemulsion stability evaluation by Acharya et al,29 their microemulsion formulations had very low zeta potential (about −0.11 mV) similar to our result (about −0.26 mV). However, their microemulsion formulations were still stable for long-term storage (3 months) and accelerated condition (centrifugation). This indicated that the very low negative charge of particles might not affect the microemulsion stability. However, the good stability of ATRA-loaded ME 4 might depend on the high viscosity of microemulsion formulation because it contained very low amount of water (5% of total weight).
Conclusions
A novel ATRA-loaded microemulsion containing oleth-5 as the surfactant was successfully prepared. This microemulsion could enhance the intestinal absorption of ATRA. However, the intestinal absorption enhancement depended on the amount of surfactant in the microemulsion formulation. The LDH cytotoxicity test revealed that the cytotoxicity of the microemulsion containing ATRA to the intestinal membrane did not differ from that of an edible oil (fish oil). The ATRA-loaded microemulsion was stable at 25°C. In summary, this novel microemulsion was an effective and safe delivery system for the oral administration of ATRA.
Acknowledgments
The authors are grateful to the Thailand Research Funds (grant no MRG6080062) and the Faculty of Pharmaceutical Sciences, Burapha University for the financial support. The authors would like to thank Associate Professor Dr Parnpen Viriyavejakul (MD, PhD) from the Department of Tropical Pathology, Faculty of Tropical Medicine, Mahidol University for histopathological interpretation of the intestinal tissues.
Disclosure
The authors report no conflicts of interest in this work.
References
Coombs CC, Tavakkoli M, Tallman MS. Acute promyelocytic leukemia: where did we start, where are we now, and the future. Blood Cancer J. 2015;5:e304. | ||
Adamson PC. All-trans-retinoic acid pharmacology and its impact on the treatment of acute promyelocytic leukemia. Oncologist. 1996;1(5):305–314. | ||
Muindi JR, Frankel SR, Huselton C, et al. Clinical pharmacology of oral all-trans retinoic acid in patients with acute promyelocytic leukemia. Cancer Res. 1992;52(8):2138–2142. | ||
Qi ZH, Shieh WJ. Aqueous media for effective delivery of tretinoin. J Incl Phenom Macrocycl Chem. 2002;44(1):133–136. | ||
Li Z, Han X, Zhai Y, et al. Critical determinant of intestinal permeability and oral bioavailabilityof pegylated all trans-retinoic acid prodrug-based nanomicelles: chain length of poly (ethylene glycol) corona. Colloids Surf B Biointerfaces. 2015;130:133–140. | ||
Sane R, Mittapalli RK, Elmquist WF. Development and evaluation of a novel microemulsion formulation of elacridar to improve its bioavailability. J Pharm Sci. 2013;102(4):1343–1354. | ||
Nornoo AO, Zheng H, Lopes LB, Johnson-Restrepo B, Kannan K, Reed R. Oral microemulsions of paclitaxel: in situ and pharmacokinetic studies. Eur J Pharm Biopharm. 2009;71(2):310–317. | ||
Noble S, Markham A. Cyclosporin. A review of the pharmacokinetic properties, clinical efficacy and tolerability of a microemulsion-based formulation (Neoral). Drugs. 1995;50(5):924–941. | ||
Ghosh PK, Majithiya RJ, Umrethia ML, Murthy RS. Design and development of microemulsion drug delivery system of acyclovir for improvement of oral bioavailability. AAPS PharmSciTech. 2006;7(3):77. | ||
Zhao JH, Ji L, Wang H, et al. Microemulsion-based novel transdermal delivery system of tetramethylpyrazine: preparation and evaluation in vitro and in vivo. Int J Nanomedicine. 2011;6:1611–1619. | ||
Gundogdu E, Alvarez IG, Karasulu E. Improvement of effect of water-in-oil microemulsion as an oral delivery system for fexofenadine: in vitro and in vivo studies. Int J Nanomedicine. 2011;6:1631–1640. | ||
Fisher S, Wachtel EJ, Aserin A, Garti N. Solubilization of simvastatin and phytosterols in a dilutable microemulsion system. Colloids Surf B Biointerfaces. 2013;107:35–42. | ||
Nolte K, Backfisch G, Neidlein R. In vitro studies of poorly absorbed drugs using porcine intestine in the ring model RIMO. Arzneimittelforschung. 2000;50(7):664–668. | ||
Westerhout J, van de Steeg E, Grossouw D, et al. A new approach to predict human intestinal absorption using porcine intestinal tissue and biorelevant matrices. Eur J Pharm Sci. 2014;63:167–177. | ||
Bader CA, Shandala T, Carter EA, et al. A molecular probe for the detection of polar lipids in live cells. PLoS One. 2016;11(8):e0161557. | ||
Alama T, Kusamori K, Katsumi H, Sakane T, Yamamoto A. Absorption-enhancing effects of gemini surfactant on the intestinal absorption of poorly absorbed hydrophilic drugs including peptide and protein drugs in rats. Int J Pharm. 2016;499(1–2):58–66. | ||
Charoenputtakhun P, Opanasopit P, Rojanarata T, Ngawhirunpat T. All-trans retinoic acid-loaded lipid nanoparticles as a transdermal drug delivery carrier. Pharm Dev Technol. 2014;19(2):164–172. | ||
Spernath A, Aserin A. Microemulsions as carriers for drugs and nutraceuticals. Adv Colloid Interface Sci. 2006;128–130:47–64. | ||
Acharya DP, Hartley PG. Progress in microemulsion characterization. Curr Opin Colloid Interface Sci. 2012;17:274–280. | ||
Lawrence MJ, Rees GD. Microemulsion-based media as novel drug delivery systems. Adv Drug Deliv Rev. 2000;45(1):89–121. | ||
Djordjevic L, Primorac M, Stupar M, Krajisnik D. Characterization of caprylocaproyl macrogolglycerides based microemulsion drug delivery vehicles for an amphiphilic drug. Int J Pharm. 2004;271(1–2):11–19. | ||
Xing Q, Song J, You X, et al. Microemulsions containing long-chain oil ethyl oleate improve the oral bioavailability of piroxicam by increasing drug solubility and lymphatic transportation simultaneously. Int J Pharm. 2016;511(2):709–718. | ||
Djekic L, Primorac M, Filipic S, Agbaba D. Investigation of surfactant/cosurfactant synergism impact on ibuprofen solubilization capacity and drug release characteristics of nonionic microemulsions. Int J Pharm. 2012;433(1–2):25–33. | ||
Silva AE, Barratt G, Chéron M, Egito ES. Development of oil-in-water microemulsions for the oral delivery of amphotericin B. Int J Pharm. 2013;454(2):641–648. | ||
Djordjevic L, Primorac M, Stupar M. In vitro release of diclofenac diethylamine from caprylocaproyl macrogolglycerides based microemulsions. Int J Pharm. 2005;296(1–2):73–79. | ||
O’Driscoll CM. Lipid-based formulations for intestinal lymphatic delivery. Eur J Pharm Sci. 2002;15(5):405–415. | ||
Dai J, Kim SM, Shin IS, et al. Preparation and stability of fucoxanthin-loaded microemulsions. J Ind Eng Chem. 2014;20(4):2103–2110. | ||
Chansiri G, Lyons RT, Patel MV, Hem SL. Effect of surface charge on the stability of oil/water emulsions during steam sterilization. J Pharm Sci. 1999;88(4):454–458. | ||
Acharya SP, Pundarikakshudu K, Panchal A, et al. Preparation and evaluation of transnasal microemulsion of carbamazepine. AJPS. 2013;8(1):64–70. |
 © 2017 The Author(s). This work is published and licensed by Dove Medical Press Limited. The
full terms of this license are available at https://www.dovepress.com/terms
and incorporate the Creative Commons Attribution
- Non Commercial (unported, 3.0) License.
By accessing the work you hereby accept the Terms. Non-commercial uses of the work are permitted
without any further permission from Dove Medical Press Limited, provided the work is properly
attributed. For permission for commercial use of this work, please see paragraphs 4.2 and 5 of our Terms.
© 2017 The Author(s). This work is published and licensed by Dove Medical Press Limited. The
full terms of this license are available at https://www.dovepress.com/terms
and incorporate the Creative Commons Attribution
- Non Commercial (unported, 3.0) License.
By accessing the work you hereby accept the Terms. Non-commercial uses of the work are permitted
without any further permission from Dove Medical Press Limited, provided the work is properly
attributed. For permission for commercial use of this work, please see paragraphs 4.2 and 5 of our Terms.