Back to Journals » Clinical Ophthalmology » Volume 13
Development of a new algorithm based on FDT Matrix perimetry and SD-OCT to improve early glaucoma detection in primary care
Authors Morejon A, Mayo-Iscar A ![]() , Martin R
, Martin R ![]() , Ussa F
, Ussa F
Received 19 June 2018
Accepted for publication 5 September 2018
Published 27 December 2018 Volume 2019:13 Pages 33—42
DOI https://doi.org/10.2147/OPTH.S177581
Checked for plagiarism Yes
Review by Single anonymous peer review
Peer reviewer comments 3
Editor who approved publication: Dr Scott Fraser
Angela Morejon,1 Agustin Mayo-Iscar,1,2 Raul Martin,1,3,4 Fernando Ussa1,5
1IOBA-Eye Institute, Universidad de Valladolid, Valladolid, Spain; 2Department of Statistics and Operational Research and IMUVA, Universidad de Valladolid, Valladolid, Spain; 3Department of Theoretical Physics, Atomic Physics and Optics, Universidad de Valladolid, Valladolid, Spain; 4Faculty of Health and Human Sciences, Plymouth University, Plymouth, England, UK; 5Ophthalmology Department, The James Cook University Hospital, Middlesbrough, UK
Purpose: The purpose of this study was to develop an objective algorithm to discriminate the earliest stages of glaucoma using frequency doubling technology (FDT) Matrix perimetry and spectral domain-optical coherence tomography (OCT) technology to improve primary care detection.
Materials and methods: Three hundred six eyes (mean age 58.67±15.12) from 161 patients were included and classified in the following three groups: 101 nonglaucoma (GI-NG), 100 glaucoma suspect (GII-SG), and 105 open-angle glaucoma (GIII-OAG). All participants underwent a visual field exploration using the Humphrey Matrix visual field instrument and retinal nerve fiber layer evaluation using the Topcon 3D OCT-2000. Pattern deviation plot was divided into 19 areas and five aggrupation or quadrants and ranked with a value between 0 and 4 according to its likelihood of normality, and differences among three groups were analyzed. Principal component analysis (PCA) was also used to extract the most notable features of FDT and OCT, and a logistic regression analysis was applied to obtain the classification rules.
Results: Only area numbers 7 and 12 and the central zone of FDT Matrix showed statistical differences (P<0.05) between GI-NG and GII-SG. The classification rules were estimated by the four PCA obtained from FDT Matrix and 3D OCT-2000 in a separate and combined use. Area under the receiver operating characteristic curve was 78.88% with FDT-PCA, 82.09% with OCT-PCA, and 94.27% with combined use of FDT and OCT-PCA to discriminate GI-NG and GII-SG.
Conclusion: The predictive rules based on FDT-PCA or OCT-PCA provide a high sensitivity and specificity to detect the earliest stages of glaucoma and even better in combined use. These predictive rules may help the future development of software for FDT Matrix perimetry and 3D OCT-2000, which will greatly improve their diagnostic ability, making them useful in daily practice in a primary care setting.
Keywords: FDT Matrix, 3D OCT-2000, PCA, glaucoma, primary care
Introduction
Glaucoma is the second leading cause of blindness wordwide.1–6 This disease affects ~61 million people,7 with only half of them being aware of their condition.8 Furthermore, the number of people with glaucoma has increased in recent years. It is estimated that a total of 79 million people will be affected by the year 2020.7 Therefore, screening tools for early detection of glaucoma are essential.
Visual field (VF) testing and optic nerve head (ONH) evaluation are necessary for proper diagnosis of glaucoma. The standard automated perimetry (SAP) (HFA II; Carl Zeiss Meditec, Dublin, CA, USA) using 24-2 algorithm has become the gold standard, but may not be selective for the earliest ganglion cell loss that occurs in glaucoma.9 From 30% to 50% of the retinal ganglion cells from an area of the VF can be lost prior to detecting a VF defect by SAP.10 Current studies show that other VF program exploration in SAP, as the 10-2 algorithm, could even improve the early detection of glaucoma.11
Nevertheless, many other technologies to explore VF, such as the frequency doubling technology (FDT) Matrix perimeter (Carl Zeiss Meditec, Jena, Germany), have been developed to improve the early glaucoma detection12 and may be able to detect abnormalities before clear evidence of structural damage is available.5,9
The accuracy of the FDT perimetry has been previously studied and shows good overall agreement with SAP when healthy patients are compared with patients with moderate and severe glaucoma.2,13–16 However, controversy exists regarding the utility of the FDT perimetry as a screening tool to detect early glaucoma2,5,12,15,17–19 and its ability to predict future glaucomatous VF loss9,20 by detecting abnormalities sooner than SAP.20 The main reason for this controversy may be because the criteria to classify the results of the FDT perimetry are unclear and depend on the operator’s subjective interpretation of the results. Although several authors have proposed different criteria to classify an FDT test as abnormal,21–24 an accepted consensus is not clear.
On the contrary, the retinal nerve fiber layer (RNFL) assessment of ONH also seems to detect structural abnormalities up to 6 years before finding any functional damage in SAP.25 One of the most popular technologies to measure RNFL is optical coherence tomography (OCT) system using spectral domain (SD) signal detection improving the acquisition time and the axial resolution.26
However, despite the high resolution of SD-OCT technology, some controversy exists about its diagnostic accuracy of early glaucoma detection as well.27–29 Currently, the main ophthalmology societies consider the VF as the gold standard for glaucoma assessment, and it must not be replaced with structural analysis itself.30,31
The purpose of this study is to create an easy and objective rule to discriminate between nonglaucomatous and glaucoma suspect subjects to be used in primary eye care using FDT Matrix perimetry and SD-OCT technology to improve the effectiveness of early detection of this disease by nonglaucoma subspecialists or primary eye care practitioners.
Materials and methods
Study design
This was a prospective, clinical, and comparative study. The ethics committee of the University of Valladolid reviewed and approved the study protocol. Written informed consent was obtained from each subject, and all subjects were treated in accordance with the Declaration of Helsinki.
Study population
All patients were assessed in the Glaucoma Unit of the IOBA Eye Institute (University of Valladolid), and they were enrolled in this study following these inclusion criteria: age of 40 years or older, because glaucoma prevalence starts to rise up from this age on,7 best corrected visual acuity (BCVA) of 20/40 Snellen chart or better, and spherical equivalent error between +6.00 and −6.00 diopters, to avoid low retinal sensitivity in VF or VF defects due to low BCVA or a high refractive error. After eye examination by a glaucoma expert ophthalmologist, patients were classified into three study groups according to the European Glaucoma Society diagnostic criteria6 without taking into account the FDT and 3D OCT-2000 results, that were masked for the expert:
- Group I or nonglaucoma group (GI-NG): eyes with a normal shape of ONH, a normal IOP (<21 mm Hg) and a normal VF in SAP defined as a glaucoma hemifield test within normal limits, absence of any depressed cluster of three points on the pattern deviation plot, and a mean deviation (MD) index less than −6 dB.32
- Group II or glaucoma suspect group (GII-SG): eyes with a suspicious shape of the ONH defined as an asymmetry between the two cups of 0.2 cup/disc ratio or a large cup in both eyes,33 or with low-risk ocular hypertension (IOP >21 mm Hg) or with a slightly depressed VF in SAP defined as an MD less than −6 dB, fewer than 25% of the points on the pattern deviation plot depressed below the 5% level and absence of any cluster of three points.32,34
- Group III or open-angle glaucoma group (GIII-OAG): eyes with a glaucomatous ONH defined as a thinner rim, a vertical elongation of the cup or any disc margin hemorrhage, or a moderate VF defect in SAP defined as an MD between −6 and −12 dB, the presence of more than one cluster of three points on the pattern deviation plot depressed below the 5% level, or IOP treated with hypotensive eye drops.32
Patients were excluded if they had any anterior segment, neurological or retinal disease that might affect the VF outcomes, structural damage or ONH atrophy different of glaucoma, or if they had significant lens opacity (>level 2 in lens opacities classification system III).35
Eyes were also excluded if signal strength or image quality of 3D OCT was lower than 60 or if any of reliability indexes of FDT Matrix perimetry were >25%.
Eye examination
All subjects underwent an exhaustive ophthalmic examination that included the following: BCVA; slit lamp examination; Goldmann applanation tonometry (AT 900®; Haag-Streit AG, Koeniz, Switzerland) for IOP assessment; structural evaluation of the ONH by funduscopy with +66 diopters lens and OCT (Topcon 3D OCT-2000; Topcon Medical Systems, Inc., Oakland, NJ, USA) in “3D-disc” program; and VF exploration by SAP (VFA, Carl Zeiss Meditec) using the Swedish Interactive Threshold Algorithm (SITA) 24-2 program and with the FDT Matrix perimetry (Welch Allyn and Carl Zeiss Meditec) using the N-30-F program. A reliable FDT Matrix test score of <33% in any of the reliability indexes was a mandatory requirement.36
The 3D OCT-2000 is a high speed SD-OCT system able to acquire 18,000 retina A-scans in one second. The 3D-disc program analyzes a volume of 512 A-scans and 128 B-scans or 6×6 mm in physical dimensions centered over ONH34 and represents the RNFL thickness in four sectors (inferior, superior, nasal, or temporal) each of them subdivided at the same time in three, with a total of 12 sectors. All these values expressed in microns were collected.
The SITA 24-2 program is one of the most popular strategies exploring VF in glaucoma and checking evolution.37 But, in this study, the SITA results were taken into account only for the group classification, but not for statistical analysis.
The FDT perimeter is a compact, efficient, and relatively inexpensive device that tolerates mild refractive errors and provides rapid VF testing.36 The stimulus presented in this perimetry is based on the phenomenon of “doubling-illusion” described by Kelly, and it consists of a sinusoidal grating of low spatial frequency (0.25 cyc/deg) that is counterphased with a high temporal frequency (25 Hz), in which the apparent spatial frequency of a grating appears to be doubled.38,39 The N-30-F program is a threshold strategy in which the stimuli of 10° by 10° are presented at 19 locations throughout the central VF using a Modified Binary Search algorithm.40
FDT Matrix results classification
The 19 areas of the pattern standard deviation plot of the FDT Matrix perimetry in the N-30-F program were arbitrarily identified from 1 to 18; number 19 was ascribed to the central area.
The probability level of each area of the FDT Matrix perimetry was also ranked arbitrarily from 0 to 4 based on the probability of depth defect assigned by the FDT Matrix algorithm; score 0 was ascribed to P≥5%, score 1 to P<5%, score 2 to P<2%, score 3 to P<1%, and score 4 to P<0.5%.
Differences among three groups for the 19 areas were analyzed. The values of the areas corresponding to the superior and inferior hemifields were also summed separately to obtain two more score indexes for the superior and inferior hemifields (S-FDTi and I-FDTi, respectively). The same procedure was applied to obtain the score of five areas: the four quadrants [Q1 (nasal-superior quadrant), Q2 (temporal-superior quadrant), Q3 (nasal-inferior quadrant), Q4 (temporal-inferior quadrant)] of the pattern standard deviation plot and the central zone (CZ) (Figure 1).
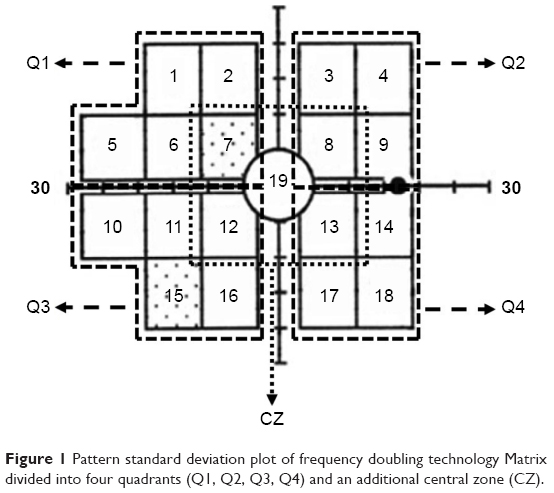 | Figure 1 Pattern standard deviation plot of frequency doubling technology Matrix divided into four quadrants (Q1, Q2, Q3, Q4) and an additional central zone (CZ). |
Statistical analysis
Data analysis was carried out using the statistical package SAS v9.4 (SAS Institute, Cary, NC, USA) and the statistical package R (R Core Team, 2014). R is a language and environment for statistical computing of R Foundation for Statistical Computing, Vienna, Austria: URL http://www.R-project.org/). It was checked that the distributions of the variables were no far from the normal pattern by using graphical approaches and by calculating the skewness and kurtosis coefficients. Baseline numeric characteristics were summarized with mean values and standard deviations. Student’s t-test was applied for identifying differences in these variables between pairs of study groups. In this way, as these pairwise comparisons were carried among three groups, those P-values <0.05 would appear as statistically significant after a Bonferroni correction for multiple comparison.
Principal component analysis (PCA) was used to extract the most important features of FDT Matrix and 3D OCT-2000 separately performing a factorial analysis assessing all clinical variables (age, VA, IOP), functional (FDT Matrix), and structural tests (3D OCT). We obtained four principal components (PCA1 to PCA4) from the original data. After performing these analyses, a varimax rotation was applied for increasing the interpretability of these variables.
A logistic regression analysis was applied to obtain classification rules to separate the three study groups. Several analyses were performed depending on the inclusion of different configurations of PCA components from FDT Matrix and 3D OCT-2000 and different subsets of individuals (GII-SG and GIII-OAG or GI-NG and GII-SG).
As a subproduct of the estimated regression models, it is possible to obtain estimations for the probability of belonging to any study group. In order to evaluate the performance of the proposed classification rules, values of sensitivity and specificity and the area under the receiver operating characteristic curve (AUC) were calculated. In this evaluation, a leave-one-out strategy was applied for reducing the bias corresponding to use the same data for estimating the classification rules and for validating it.
When comparing between pairs of groups, P-values <0.05 were considered as statistically significant.
Results
Patients’ characteristics
Three hundred six eyes from 161 patients (55% women and 45% men) were included in the study (mean patient age 58.67±15.12 years). Only five patients were excluded from the study due to low reliability in FDT Matrix perimetry. The sample size was classified as follows: 101 eyes in the GI-NG group (52% women and 48% men; mean age 51.75±10.28 years), 100 in the GII-SG group (69% women and 31% men; mean age 58.76±10.75 years), and 105 in the GIII-OAG group (46% women and 54% men; mean age 65.59±12.74 years).
Analysis of FDT Matrix results
Statistical differences (P<0.05) were found between GII-SG and GIII-OAG groups in the 19 areas and the four quadrants and the CZ of the pattern standard deviation plot of the FDT Matrix perimetry as well as in VF indexes (MD and PSD). However, only area numbers 7 (mean value and standard deviation: 0.11±0.34 dB for GI-NG and 0.30±0.73 dB for GII-SG), 12 (0.09±0.40 dB for GI-NG and 0.22±0.59 dB for GII-SG), and 15 (0.09±0.29 dB for GI-NG and 0.28±0.71 dB for GII-SG) of pattern standard deviation plot were statistically different between GI-NG and GII-SG group (P<0.05).
Only the CZ showed significant differences between GI-NG: 0.11±0.20 dB and GII-SG: 0.22±0.37 dB (P<0.05). For VF indexes, only PSD was significantly different between GI-NG: 3.72±0.82 and GII-SG: 4.32±1.42 (P<0.05). Pairwise differences among three study groups after Bonferroni correction are shown in Table 1.
 | Table 1 Pairwise differences for the 19 areas of pattern deviation plot of FDT Matrix perimetry and visual field indices |
PCA of FDT Matrix and 3D OCT-2000
Besides the clinical variables studied as age, VA, or IOP, a factorial analysis was performed to summarize the information of functional and structural tests performed as FDT Matrix and 3D OCT-2000 in a reduced number of uncorrelated variables. Tables 2 and 3 show the correlations of the four PCA obtained, in addition to the variability percentage of each FDT Matrix or 3D OCT-2000 variables explained by the four PCA. The factorial analysis is also uncorrelated with other clinical factors.
 | Table 2 Division in the four PCA (FDT_PCA1, FDT_PCA2, FDT_PCA3, and FDT_PCA4) of FDT Matrix perimetry and its correlation in percentage with each area and index of FDT |
 | Table 3 Division in the four PCA (3D_PCA1, 3D_PCA2, 3D_PCA3, and 3D_PCA4) of 3D OCT-2000 and its correlation in percentage with each sector of 3D OCT-2000 |
After obtaining the PCA based on functional and structural tests, we composed different predictive rules, applying the following formula:
|
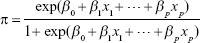
where π is the probability of suffering the disease, β0 is the estimated value of intercept, β1 … βp are the estimated values of each variable of the rule, and x1 … xp are the individual values for each patient.
Predictive rule based on PCA of FDT Matrix
This predictive rule (Table 4) offers a sensitivity of 70.30% and a specificity of 77.23% to discriminate between GI-NG and GII-SG obtaining an AUC of 78.88%, as shown in Figure 2. Using the same formula, the sensitivity may improve up to 80.00% to discriminate between GI-NG and both groups (GII-SG and GIII-OAG), and even more, the sensitivity may rise up to 89.42% to discriminate between GI-NG and GIII-OAG while keeping the same specificity.
 | Table 4 Estimated parameters from logistic regression models for creating a predictive rule based on PCA of FDT Matrix |
 | Figure 2 Area under the receiver operating characteristic curve of 78.88% to discriminate between GI-NG and GII-PG based on principal component analysis of FDT Matrix perimetry. |
Predictive rule based on PCA of 3D OCT-2000
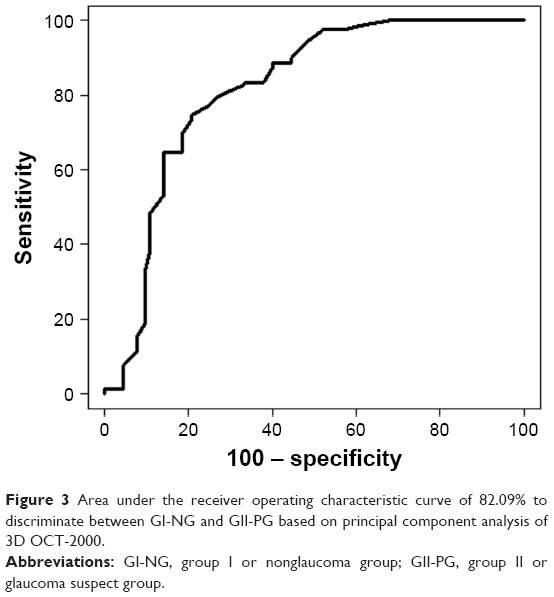
This predictive rule (Table 5) offers a sensitivity of 78.26% and a specificity of 79.75% to discriminate between GI-NG and GII-SG obtaining an AUC of 82.09%, as shown in Figure 3. Using the same formula, the sensitivity decreases to 74.32% to discriminate between GI-NG and both groups (GII-SG and GIII-OAG) and to 89.42% to discriminate between GI-NG and GIII-OAG but keeping the same specificity.
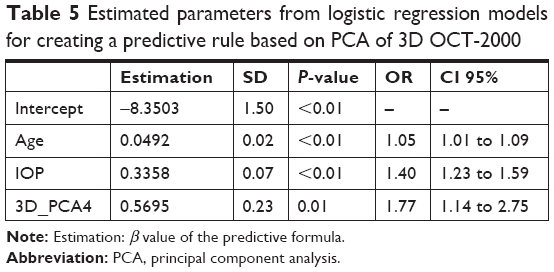 | Table 5 Estimated parameters from logistic regression models for creating a predictive rule based on PCA of 3D OCT-2000 |
 | Figure 3 Area under the receiver operating characteristic curve of 82.09% to discriminate between GI-NG and GII-PG based on principal component analysis of 3D OCT-2000. |
Predictive rule based on PCA of FDT Matrix and 3D OCT-2000
This predictive rule (Table 6) offers an improved sensitivity of 90.11% and a specificity of 91.30% to discriminate between GI-NG and GII-SG obtaining an AUC of 94.27%, as shown in Figure 4. Using the same formula, the specificity may improve up to 93.57% to discriminate between GI-NG and both groups (GII-SG and GIII-OAG), and even more, the specificity may rise up to 96.20% to discriminate between GI-NG and GIII-OAG while keeping the same sensitivity.
 | Table 6 Estimated parameters from logistic regression models for creating a predictive rule based on PCA of FDT Matrix and 3D OCT-2000 |
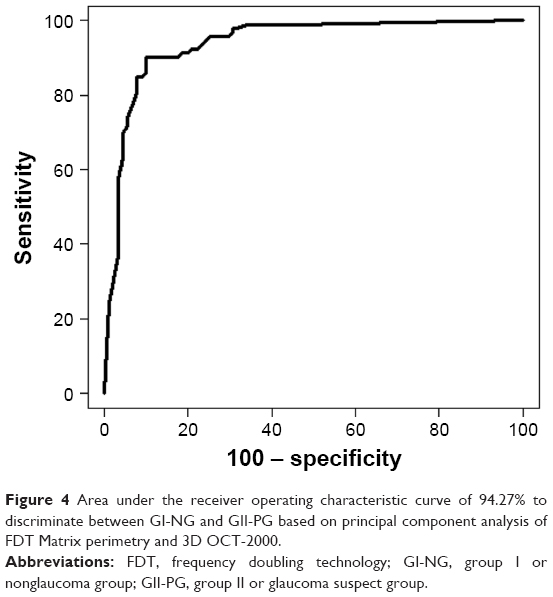 | Figure 4 Area under the receiver operating characteristic curve of 94.27% to discriminate between GI-NG and GII-PG based on principal component analysis of FDT Matrix perimetry and 3D OCT-2000. |
Discussion
Currently, the most frequent clinical practice performed in glaucoma screening programs and in primary care is IOP measurement1 combined with an optic disc evaluation. It is known that the isolated use of tonometry is not the most adequate test for glaucoma screening because a high percentage (30%–70%) of primary open-angle glaucoma patients show normal IOP values,41,42 and IOP has a circadian fluctuation.42 Therefore, glaucoma diagnosis must be based on structural and functional changes.
FDT Matrix is a rapid, reliable, and feasible method for VF assessment,16,43,44 with a moderate tolerance to refractive error and a low variability in locations of VF sensitivity loss.45 Several studies have reported the rough advantages of FDT perimetry and its good agreement with SAP,2,15,16,18,21 but controversy exists regarding the accuracy of FDT. Some authors conclude that FDT perimetry may have enough accuracy to detect glaucoma in the early stages,2,5,15,17,37 while other authors reject the idea that the FDT perimetry is sufficient to detect glaucoma.46,47
A proper interpretation of the FDT results requires a certain degree of knowledge. Several authors agree about the lack of a standard VF loss definition and the fact that a classification has not been developed and accepted for the FDT perimetry.21,43 This lack of consensus may explain why the use of the FDT perimetry in primary care has not been popularized in some countries, and it seems to be necessary to establish an objective criterion to improve glaucoma screening when using FDT technology.
Our approach to evaluate the pattern deviation plot shows that area numbers 7, 12, and 15 are possible indicators of early damage in GII-SG or glaucoma suspect group as well as the CZ and the PSD index.
In a similar study, Artes et al24 assigned a value ranging from 0 to 4 to the areas of the pattern deviation plot based on the probability of normality, and they added together all the scores. However, they used this approach to analyze the degree of agreement between SAP and FDT using the 24-2 algorithm. They found that FDT defects appear less abnormal than these on SAP. This finding suggests that the 24-2 algorithm may not be the most suitable one for the early detection of glaucoma and agrees with other studies that recommend the 24-2 program for monitoring the disease due to the stimuli size.48 We use a similar approach to analyze the pattern deviation plot, but we use the N-30-F program whose stimuli (10° square instead of 5° square from the 24-2 program) are valid for the detection and classification of VF defects.48
Landers et al23 compared the accuracy of several diagnosis protocols for FDT perimetry vs the conventional protocol of VF loss (two or more adjacent areas of the pattern deviation plot with P<5% or one with P<1%). They concluded that a nasal step of VF loss could be the most accurate protocol to predict future glaucomatous VF loss. In our study, we have also observed a nasal area of the pattern deviation plot, the area number 15 could be susceptible to early changes in glaucoma.
Another study that evaluates the diagnostic accuracy of FDT analyzing the number of missed points on the pattern deviation divided into four quadrants is the one performed by Casson et al.21 They concluded that FDT is more accurate in localizing scotomas in moderate and severe glaucoma but not in early glaucoma or in eyes that are suspicious for glaucoma. In this study, the pattern deviation plot was divided into five areas, the four quadrants and one more additional in CZ. Our results suggest that CZ could be early affected in glaucoma suspect.
Although our results show statistical differences in area numbers 7, 12, and 15 of the pattern deviation plot of FDT Matrix between GI-NG and GII-SG, we consider this finding complementary to the objective and predictive rules based on PCA in order to improve the early detection of glaucomatous damage. On the contrary, SD-OCT technology has supposed a revolution regarding the speed imaging acquisition and a higher axial resolution of these images, hence improving the structural analysis of retinal layers including ONH. Nevertheless, it is still controversial whether SD-OCT has improved diagnostic ability compared with the previous generation of OCT in glaucoma patients.28,49
For these reasons, this study has calculated several predictive and objective rules to improve the sensitivity and specificity of detecting glaucoma suspect based on PCA of uncorrelated FDT Matrix and 3D OCT-2000 variables, as well as other clinical factors studied as age, VA, and IOP. Our study involves a novel finding, including all these variables together in objective rules trying to improve the early detection of glaucoma.
The rules described in this work establish a better accuracy when functional and structural factors are included at the same time in agreement with several authors.50–52
Yousefi et al53 studied the diagnostic accuracy of FDT Matrix perimetry after extracting the most important features in PCA components obtaining a sensitivity of 77% and a specificity of 94% to discriminate between healthy and moderate OAG, while our results show a sensitivity slightly higher (80%) when we compare GI-NG vs GII-SG and GIII-OAG together with a lower specificity (77.23%).
Zhang et al54 extracted 48 PCA of the RNFL thickness measured by 3D OCT-2000 after applying a multiple regression model to compare them with SAP. In this case, they found a sensitivity of 74.4% and a specificity of 98% to discriminate between healthy subjects and patients with a high glaucoma suspicion; they also concluded that the combination of structural and functional PCA would provide a tool with a powerful diagnostic accuracy. This situation is very similar to our study, but we have found even a higher sensitivity (78.26%) when we create rules from PCA of 3D OCT-2000 with a specificity of 79.75%.
According to our results, we have found highly accurate predictive rules when structural and functional PCA are combined obtaining a sensitivity of 90.11% and a specificity of 91.30% to discriminate between GI-NG and GII-SG.
Limitations
One weakness of this study is that we did not consider the test–retest variability; however, the rationale is to perform a single test (N-30-F FDT Matrix), as an examination with sufficient accuracy to be used in primary care. The test may be used to discriminate nonglaucoma subjects from suspicious, preperimetric, or early glaucoma patients. However, the response variability is independent from the VF loss;45 thus, the defects found in the results of a single test could be reliable. In addition, the main characteristics of the samples used in our work need to be considered: the eyes included in our study had no other ocular diseases other than glaucoma and did not have other clinical signs different from the typical signs of early or preperimetric glaucoma.
Conclusion
The predictive rule based on PCA of FDT Matrix or PCA based on 3D OCT-2000 provides a high sensitivity and specificity to detect the earliest stages of glaucoma. Nevertheless, the combined use of FDT Matrix and 3D OCT-PCA may improve considerably the early detection of glaucoma in a primary care setting, providing a better accuracy than the isolate used of FDT Matrix or 3D OCT-2000. The predictive rules based on this formula may help the future development of software for FDT Matrix perimetry and 3D OCT-2000, which will greatly improve their diagnostic ability, making them useful in day-to-day practice in a primary care setting.
Acknowledgment
Agustin Mayo-Iscar was partially supported by Spanish Ministerio de Economía y Competitividad, grant MTM2017-86061-C2-1-P, and by Consejería de Educación de la Junta de Castilla y León and FEDER, grant VA005P17 and VA002G18.
Disclosure
The authors report no conflicts of interest in this work.
References
Alward WL. Frequency doubling technology perimetry for the detection of glaucomatous visual field loss. Am J Ophthalmol. 2000;129(3):376–378. | ||
Burnstein Y, Ellish NJ, Magbalon M, Higginbotham EJ. Comparison of frequency doubling perimetry with Humphrey visual field analysis in a glaucoma practice. Am J Ophthalmol. 2000;129(3):328–333. | ||
Trible JR, Schultz RO, Robinson JC, Rothe TL. Accuracy of glaucoma detection with frequency-doubling perimetry. Am J Ophthalmol. 2000;129(6):740–745. | ||
Mills RP, Budenz DL, Lee PP, et al. Categorizing the stage of glaucoma from pre-diagnosis to end-stage disease. Am J Ophthalmol. 2006;141(1):24–30. | ||
Ferreras A, Polo V, Larrosa JM, et al. Can frequency-doubling technology and short-wavelength automated perimetries detect visual field defects before standard automated perimetry in patients with preperimetric glaucoma? J Glaucoma. 2007;16(4):372–383. | ||
European Glaucoma Society. European Glaucoma Society Terminology and Guidelines for Glaucoma, 4th Edition - Chapter 2: Classification and terminology. British Journal of Ophthalmology. 2017;101:73–127. | ||
Quigley HA, Broman AT. The number of people with glaucoma worldwide in 2010 and 2020. Br J Ophthalmol. 2006;90(3):262–267. | ||
Quigley HA. Number of people with glaucoma worldwide. Br J Ophthalmol. 1996;80(5):389–393. | ||
Medeiros FA, Sample PA, Weinreb RN. Frequency doubling technology perimetry abnormalities as predictors of glaucomatous visual field loss. Am J Ophthalmol. 2004;137(5):863–871. | ||
Quigley HA, Addicks EM, Green WR. Optic nerve damage in human glaucoma. III. Quantitative correlation of nerve fiber loss and visual field defect in glaucoma, ischemic neuropathy, papilledema, and toxic neuropathy. Arch Ophthalmol. 1982;100(1):135–146. | ||
De Moraes CG, Hood DC, Thenappan A, et al. 24-2 Visual fields miss central defects shown on 10-2 tests in glaucoma suspects, ocular hypertensives, and early glaucoma. Ophthalmology. 2017;124(10):1449–1456. | ||
Leeprechanon N, Giangiacomo A, Fontana H, Hoffman D, Caprioli J. Frequency-doubling perimetry: comparison with standard automated perimetry to detect glaucoma. Am J Ophthalmol. 2007;143(2):263–271. | ||
White AJ, Sun H, Swanson WH, Lee BB. An examination of physiological mechanisms underlying the frequency-doubling illusion. Invest Ophthalmol Vis Sci. 2002;43(11):3590–3599. | ||
Swanson WH, Sun H, Lee BB, Cao D. Responses of primate retinal ganglion cells to perimetric stimuli. Invest Ophthalmol Vis Sci. 2011;52(2):764–771. | ||
Cello KE, Nelson-Quigg JM, Johnson CA. Frequency doubling technology perimetry for detection of glaucomatous visual field loss. Am J Ophthalmol. 2000;129(3):314–322. | ||
Patel A, Wollstein G, Ishikawa H, Schuman JS. Comparison of visual field defects using matrix perimetry and standard achromatic perimetry. Ophthalmology. 2007;114(3):480–487. | ||
Horn FK, Brenning A, Jünemann AG, Lausen B. Glaucoma detection with frequency doubling perimetry and short-wavelength perimetry. J Glaucoma. 2007;16(4):363–371. | ||
Liu S, Lam S, Weinreb RN, et al. Comparison of standard automated perimetry, frequency-doubling technology perimetry, and short-wavelength automated perimetry for detection of glaucoma. Invest Ophthalmol Vis Sci. 2011;52(10):7325–7331. | ||
Burgansky-Eliash Z, Wollstein G, Patel A, et al. Glaucoma detection with matrix and standard achromatic perimetry. Br J Ophthalmol. 2007;91(7):933–938. | ||
Landers JA, Goldberg I, Graham SL. Detection of early visual field loss in glaucoma using frequency-doubling perimetry and short-wavelength automated perimetry. Arch Ophthalmol. 2003;121(12):1705–1710. | ||
Casson R, James B, Rubinstein A, Ali H. Clinical comparison of frequency doubling technology perimetry and Humphrey perimetry. Br J Ophthalmol. 2001;85(3):360–362. | ||
Patel SC, Friedman DS, Varadkar P, Robin AL. Algorithm for interpreting the results of frequency doubling perimetry. Am J Ophthalmol. 2000;129(3):323–327. | ||
Landers J, Sharma A, Goldberg I, Graham S. A comparison of diagnostic protocols for interpretation of frequency doubling perimetry visual fields in glaucoma. J Glaucoma. 2006;15(4):310–314. | ||
Artes PH, Hutchison DM, Nicolela MT, Leblanc RP, Chauhan BC. Threshold and variability properties of matrix frequency-doubling technology and standard automated perimetry in glaucoma. Invest Ophthalmol Vis Sci. 2005;46(7):2451–2457. | ||
Sommer A, Katz J, Quigley HA, et al. Clinically detectable nerve fiber atrophy precedes the onset of glaucomatous field loss. Arch Ophthalmol. 1991;109(1):77–83. | ||
Keane PA, Bhatti RA, Brubaker JW, Liakopoulos S, Sadda SR, Walsh AC. Comparison of clinically relevant findings from high-speed Fourier-domain and conventional time-domain optical coherence tomography. Am J Ophthalmol. 2009;148(2):242–248. | ||
Sung KR, Kim DY, Park SB, Kook MS. Comparison of retinal nerve fiber layer thickness measured by Cirrus HD and Stratus optical coherence tomography. Ophthalmology. 2009;116(7):1264–1270. | ||
Sung KR, Kim JS, Wollstein G, Folio L, Kook MS, Schuman JS. Imaging of the retinal nerve fibre layer with spectral domain optical coherence tomography for glaucoma diagnosis. Br J Ophthalmol. 2011;95(7):909–914. | ||
Jeoung JW, Park KH. Comparison of Cirrus OCT and Stratus OCT on the ability to detect localized retinal nerve fiber layer defects in preperimetric glaucoma. Invest Ophthalmol Vis Sci. 2010;51(2):938–945. | ||
Prum BE, Rosenberg LF, Gedde SJ, et al. Primary open-angle glaucoma preferred practice Pattern(®) guidelines. Ophthalmology. 2016;123(1):P41–P111. | ||
Prum BE, Lim MC, Mansberger SL, et al. Primary open-angle glaucoma suspect preferred practice Pattern(®) guidelines. Ophthalmology. 2016;123(1):P112–P151. | ||
Hodapp E, Parrish RK, Anderson DR. Clinical Decisions in Glaucoma. 1st ed. St Louis: Mosby; 1993. | ||
Fingeret M, Medeiros FA, Susanna R, Weinreb RN. Five rules to evaluate the optic disc and retinal nerve fiber layer for glaucoma. Optometry. 2005;76(11):661–668. | ||
Wollstein G, Ishikawa H, Wang J, Beaton SA, Schuman JS. Comparison of three optical coherence tomography scanning areas for detection of glaucomatous damage. Am J Ophthalmol. 2005;139(1):39–43. | ||
Chylack LT, Wolfe JK, Singer DM, et al. The lens opacities classification system III. The longitudinal study of cataract study group. Arch Ophthalmol. 1993;111(6):831–836. | ||
Anderson AJ, Johnson CA. Frequency-doubling technology perimetry. Ophthalmol Clin North Am. 2003;16(2):213–225. | ||
Sharma P, Sample PA, Zangwill LM, Schuman JS. Diagnostic tools for glaucoma detection and management. Surv Ophthalmol. 2008;53 (Suppl 1):S17–S32. | ||
Kelly DH. Frequency doubling in visual responses. J Opt Soc Am. 1966;56(11):1628–1633. | ||
Zeppieri M, Demirel S, Kent K, Johnson CA. Perceived spatial frequency of sinusoidal gratings. Optom Vis Sci. 2008;85(5):318–329. | ||
Turpin A, Mckendrick AM, Johnson CA, Vingrys AJ. Performance of efficient test procedures for frequency-doubling technology perimetry in normal and glaucomatous eyes. Invest Ophthalmol Vis Sci. 2002;43(3):709–715. | ||
Iwase A, Suzuki Y, Araie M, et al. The prevalence of primary open-angle glaucoma in Japanese: the Tajimi Study. Ophthalmology. 2004;111(9):1641–1648. | ||
Shuba LM, Doan AP, Maley MK, et al. Diurnal fluctuation and concordance of intraocular pressure in glaucoma suspects and normal tension glaucoma patients. J Glaucoma. 2007;16(3):307–312. | ||
Terry AL, Paulose-Ram R, Tilert TJ, et al. The methodology of visual field testing with frequency doubling technology in the National Health and Nutrition Examination Survey, 2005–2006. Ophthalmic Epidemiol. 2010;17(6):411–421. | ||
Spry PG, Hussin HM, Sparrow JM. Performance of the 24-2-5 frequency doubling technology screening test: a prospective case study. Br J Ophthalmol. 2007;91(10):1345–1349. | ||
Spry PG, Johnson CA, Mckendrick AM, Turpin A. Variability components of standard automated perimetry and frequency-doubling technology perimetry. Invest Ophthalmol Vis Sci. 2001;42(6):1404–1410. | ||
Bozkurt B, Yilmaz PT, Irkec M. Relationship between Humphrey 30-2 SITA Standard Test, Matrix 30-2 threshold test, and Heidelberg retina tomograph in ocular hypertensive and glaucoma patients. J Glaucoma. 2008;17(3):203–210. | ||
Kamdeu Fansi AA, Li G, Harasymowycz PJ. The validity of screening for open-angle glaucoma in high-risk populations with single-test screening mode frequency doubling technology perimetry (FDT). J Glaucoma. 2011;20(3):167–171. | ||
Anderson AJ, Johnson CA, Fingeret M, et al. Characteristics of the normative database for the Humphrey matrix perimeter. Invest Ophthalmol Vis Sci. 2005;46(4):1540–1548. | ||
Reis AS, Vidal KS, Kreuz AC, Monteiro ML, Nicolela MT, Malta RF. Nerve fiber layer in glaucomatous hemifield loss: a case-control study with time- and spectral-domain optical coherence tomography. Arq Bras Oftalmol. 2012;75(1):53–58. | ||
Shah NN, Bowd C, Medeiros FA, et al. Combining structural and functional testing for detection of glaucoma. Ophthalmology. 2006;113(9):1593–1602. | ||
Garway-Heath DF, Friedman DS. How should results from clinical tests be integrated into the diagnostic process? Ophthalmology. 2006;113(9):1479–1480. | ||
Cellini M, Bernabini B, Carbonelli M, Zamparini E, Campos EC. Optical coherence tomography, frequency-doubling technology, and colour Doppler imaging in ocular hypertension. Eye. 2007;21(8):1071–1077. | ||
Yousefi S, Goldbaum MH, Zangwill LM, Medeiros FA, Bowd C. Recognizing patterns of visual field loss using unsupervised machine learning. Proc SPIE Int Soc Opt Eng. 2014:90342M. | ||
Zhang X, Raza AS, Hood DC. Detecting glaucoma with visual fields derived from frequency-domain optical coherence tomography. Invest Ophthalmol Vis Sci. 2013;54(5):3289–3296. |
 © 2018 The Author(s). This work is published and licensed by Dove Medical Press Limited. The
full terms of this license are available at https://www.dovepress.com/terms
and incorporate the Creative Commons Attribution
- Non Commercial (unported, 3.0) License.
By accessing the work you hereby accept the Terms. Non-commercial uses of the work are permitted
without any further permission from Dove Medical Press Limited, provided the work is properly
attributed. For permission for commercial use of this work, please see paragraphs 4.2 and 5 of our Terms.
© 2018 The Author(s). This work is published and licensed by Dove Medical Press Limited. The
full terms of this license are available at https://www.dovepress.com/terms
and incorporate the Creative Commons Attribution
- Non Commercial (unported, 3.0) License.
By accessing the work you hereby accept the Terms. Non-commercial uses of the work are permitted
without any further permission from Dove Medical Press Limited, provided the work is properly
attributed. For permission for commercial use of this work, please see paragraphs 4.2 and 5 of our Terms.