Back to Journals » Patient Preference and Adherence » Volume 20
Development and Validation of the Treatment Adherence Scale for Non-Dialysis Chronic Kidney Disease Patients in China: A Mixed-Methods Study
Authors Cui Y ![]() , Li X, Liu N, Li J
, Li X, Liu N, Li J ![]() , Feng Y, Li S, Bai X, Li F, Liu H, Zhang Y
, Feng Y, Li S, Bai X, Li F, Liu H, Zhang Y ![]() , Lv H
, Lv H
Received 10 October 2025
Accepted for publication 18 February 2026
Published 5 March 2026 Volume 2026:20 573282
DOI https://doi.org/10.2147/PPA.S573282
Checked for plagiarism Yes
Review by Single anonymous peer review
Peer reviewer comments 2
Editor who approved publication: Dr Johnny Chen
Yi Cui,1,2,* Xiaoyan Li,1,* Na Liu,2 Jiayao Li,2 Ying Feng,1 Sisi Li,1 Xiuxiu Bai,1 Fuqiong Li,1 Hongbao Liu,1 Yinling Zhang,2 Honghong Lv1
1Department of Nephrology, Tangdu Hospital, The Fourth Military Medical University (Air Force Medical University), Xi’an, People’s Republic of China; 2Department of Nursing, The Fourth Military Medical University (Air Force Medical University), Xi’an, People’s Republic of China
*These authors contributed equally to this work
Correspondence: Honghong Lv, Department of Nephrology, Tangdu Hospital, The Fourth Military Medical University (Air Force Medical University), No. 569, Xinsi Road, Baqiao District, Xi’an, Shaanxi, 710038, People’s Republic of China, Tel +8615991792275, Email [email protected] Yinling Zhang, Department of Nursing, The Fourth Military Medical University (Air Force Medical University), No. 169, Changle West Road, Xincheng District, Xi’an, Shaanxi, 710038, People’s Republic of China, Tel +8613991283755, Email [email protected]
Purpose: Chronic kidney disease (CKD) is a global public health priority. Adherence to complex therapeutic regimens is crucial for non-dialysis patients. However, the absence of multidimensional assessment instruments has impeded precise adherence evaluation and targeted interventions. This study aimed to develop and validate a disease-specific Treatment Adherence Scale for Non-Dialysis CKD Patients (TAS-NCKD).
Methods: A cross-sectional mixed-methods study was conducted in China. Preliminary items were developed by a scoping review and two Delphi expert rounds. Three rounds of surveys (n=160, 350, and 370) were conducted for the construction and psychometric validation of the scale. Feasibility, reliability, validity, discrimination and difficulty, and optimal cutoff determination was verified.
Results: The third validation cohort consisted of 181 patients with CKD stage 1, 49 with stage 2, 59 with stage 3, 38 with stage 4, and 43 with stage 5. The final TAS-NCKD comprises 45 items across 5 dimensions. The scale demonstrated high feasibility with a completion rate of 92.5%, and a completion time within 18 minutes. The Cronbach’s α, split-half reliability, test-retest reliability for the scale were 0.955, 0.968, and 0.836. The scale-level content validity index (CVI) and item-level CVI were 0.992 and 0.875– 1. Confirmatory factor analysis showed a good model fit. Convergent and discriminant validity both met the standards. Item characteristic curves were ideal and the optimal cutoff was established at 179 points.
Conclusion: The TAS-NCKD is a valid and reliable instrument for assessing treatment adherence in Chinese non-dialysis CKD patients. This study provides targeted insights for improving patient self-management and may help slow disease progression.
Keywords: chronic kidney disease, non-dialysis, treatment adherence, scale development and validation, China
Introduction
Chronic kidney disease (CKD) is a lifelong condition characterized by high prevalence, disability rate, medical costs, and low public awareness.1 It has emerged as a significant global public health issue that poses serious threats to human health. Currently, the median prevalence of CKD is 9.5% globally and 8.2% in China.2,3 Notably, less than 1% of patients undergo dialysis, indicating that the majority of patients remain in the non-dialysis stage.4 Poor early control drives multi-system complications, reducing quality of life, increasing the burden on the family and society, and elevating morbidity and mortality.5 Therefore, targeting the non-dialysis intervenable window to slow kidney function decline is critical for improving patients’ clinical outcome.
The 2024 KDIGO Clinical Practice Guidelines for CKD Assessment and Management emphasize delaying disease progression as the core treatment goal.6 The optimal management has shifted from disease-centered to patient-centered integrated team-based care, and that in addition to medication, dietary, exercise, other lifestyle changes are the cornerstones of long-term CKD control. Good treatment adherence is essential to achieve effective outcomes and preserve renal function.7 The World Health Organization (WHO) defines it as patients’ adherence to the recommendations of healthcare providers, such as medication intake, dietary control, and lifestyle modification.8 This definition emphasizes behavioral orientation and multidimensional construct focused on actionable practices rather than attitudes or willingness alone. Studies have shown that good treatment adherence in non-dialysis CKD patients facilitates disease regression, prevents complications, and delays dialysis initiation.9,10 Therefore, there is an urgent need for a disease-specific assessment instrument to quantify the drivers of treatment adherence and enable personalized interventions.
Emerging digital health technologies and artificial intelligence (AI) are reshaping chronic disease management, particularly for CKD patients requiring long-term adherence monitoring. Recent studies highlight that AI-driven nutritional risk assessment tools can identify high-risk non-adherent patients by analyzing real-time biomarker and dietary log data,11 while digital platforms improve medication adherence via personalized reminders and remote follow-up.12 However, most digital interventions lack a validated, disease-specific adherence assessment instrument to anchor their strategies. Current adherence assessment instruments for non-dialysis CKD patients focus narrowly on dietary and medication, lacking holistic evaluation. Methods for assessing dietary adherence include dietary diary,13 24-hour recall,14 urea nitrogen measurement,15 and questionnaires such as Renal Adherence Attitude Questionnaire (RAAQ), Renal Adherence Behavior Questionnaire (RABQ),16 and Diet History Questionnaire (DHQ).17 Measurement of medication adherence includes indirect and direct measures. Indirect measures encompass detecting drug concentration,18 calculating drug dosage and proportion of days covered (PDC),19 Direct measures are mainly in the form of questionnaires, such as the Simplified Medication Adherence Questionnaire (SMAQ),20 Medication Adherence Report Scale (MARS),21 and 8-item Morisky Medication Adherence Scale (MMAS-8),22 Whereas the End-Stage Renal Disease Adherence Questionnaire (ESRD-AQ) captures dialysis-specific barriers, it neglects cardinal adherence determinants in non-dialysis CKD patients.23 Existing instruments fail to capture the multidimensionality of non-dialysis CKD adherence, including disease awareness, lifestyle adaptation challenges, and proactive self-monitoring behaviors. This gap underscores the necessity of developing a multidimensional, psychometrically sound scale that can integrate with digital health systems to enable precise CKD management.
The knowledge-attitude-practice (KAP) model, a classic health behavior theory, provides a valuable framework for conceptualizing treatment adherence dimensions in non-dialysis CKD patients.24,25 Deficits in disease-specific knowledge and maladaptive attitudes compromise behavioral sustainability. For non-dialysis CKD patients, CKD-related knowledge fundamentally shapes adherence patterns, attitudes drive behavioral persistence, and observable practices constitute the ultimate manifestation of adherence. Thus, the KAP model offers a robust foundation for developing the Treatment Adherence Scale for Non-Dialysis CKD Patients (TAS-NCKD), which is designed to quantify concrete behaviors while assessing knowledge accuracy and attitude strength to comprehensively reflect treatment adherence levels.
The primary objective of this study was to construct a culturally adapted treatment adherence scale for Chinese non-dialysis CKD populations and conduct a preliminary psychometric evaluation of feasibility, reliability, validity, discrimination, difficulty, and optimal cutoff determination. We hypothesized that the TAS-NCKD would contain non-dialysis CKD-specific adherence items and exhibit good psychometric properties, providing a high-quality assessment tool and theoretical basis for targeted adherence interventions.
Materials and Methods
Study Design
This methodological study rigorously adhered to DeVellis’26 scale development procedure, including the development of an instrument to measure treatment adherence in non-dialysis CKD patients and psychometric assessments of the developed scale’s reliability and validity. To collect data for scale construction (first two rounds) and validation (third round), we conducted three rounds of cross-sectional surveys, all using convenience sampling with no data crossover across all phases. The cross-sectional section was reported following the Strengthening the Reporting of Observational studies in Epidemiology (STROBE) guidelines (Table S1 in Supplementary materials).
Participants and Procedure
The study was conducted across three tertiary hospitals in Xi’an, China, from May 2024 to May 2025. In advance, the heads of the three hospitals’ nephrology departments were contacted to recruit patients who were either hospitalized in the department or waiting in the outpatient clinics and who met the inclusion criteria. After explaining the study purpose, participants voluntarily signed an informed consent form. The research team then distributed paper-based questionnaires on site, collected them promptly upon completion, and checked for any missing or ambiguous responses. The study was approved by the Ethics Committee of the Second Affiliated Hospital of the Fourth Military Medical University (No. K202503-41) and strictly conducted in accordance with the principles of the Declaration of Helsinki.
Inclusion in the study requires patients to satisfy the following criteria: (1) met the diagnostic criteria for CKD according to the clinical practice guideline;27 (2) not on dialysis; (3) aged ≥18 years; (4) conscious, with normal communication skills and ability to complete the questionnaire; (5) informed and voluntary participation. Exclusion criteria: (1) cognitive impairment or comorbid psychiatric disorders; (2) comorbid serious cardiovascular, neurological, pulmonary, or other systemic disorders.
Phase I: Development of the Preliminary Items
To generate the initial item pool, we conducted a scoping review using the Joanna Briggs Institute (JBI) Scoping Review Guidelines in Australia as the methodological framework, strictly following its steps and the PCC (Participants, Concept, Context) principles.28 The target population was non-dialysis CKD patients. The core concept was treatment adherence which typically covers core elements such as medication adherence, dietary adherence, lifestyle adherence, and follow-up adherence. The context focused on a practice pattern of specific behaviors whether in the context of inpatient or home-based care settings. Based on this, we developed search strategies and searched across English databases (PubMed, Embase, Cochrane Library, Web of Science, CINAHL, PsycINFO) and Chinese databases (CNKI, Wanfang Data Knowledge Service Platform, VIP Database, China Biology Medicine disc) and followed the Preferred Reporting Items for Systematic Review and Meta-analysis Protocols Extension for Scoping Reviews (PRISMA-ScR) to screen the literature. A total of 2638 records were initially retrieved, 490 duplicates were removed, 1685 records were excluded after title/abstract screening, and 463 full-text articles were assessed for eligibility, with 36 studies finally included. Guided by the KAP theory, we analyzed and categorized the knowledge, attitudes, and behaviors related to treatment adherence in non-dialysis CKD patients. On this basis, the preset dimensions and an item pool for the scale were drafted.
Following the scoping review, two rounds of Delphi expert consultation were conducted either face-to-face or by e-mail to revise items. A total of 17 experts, including five experienced nephrologists, five nurse specialists, four chronic disease management experts, two psychologists, and one questionnaire development expert, were consulted in the first round, and 16 experts, including one nephrologist withdrew due to scheduling conflicts, were consulted in the second round. Experts rated each dimension and item in terms of importance and relevance. The importance was evaluated using a 5-point Likert scale (5 = extremely important, 4 = important, 3 = moderately important, 2 = unimportant, 1 = extremely unimportant), while the relevance was assessed via a 4-point Likert scale (4 = highly relevant, 3 = moderately relevant, 2 = weakly relevant, 1 = irrelevant). Through scoping review and expert consultations, the preliminary dimensions and item pool for TAS-NCKD were determined.
Phase II: Preliminary Validation of the Draft Scale: 1st Survey
The preliminary validation commenced with a pilot survey of 50 CKD non-dialysis patients to eliminate items with ceiling or floor effects. Subsequently, 160 eligible participants were recruited from the nephrology department of a tertiary hospital in Xi’an for the first-round survey. Participants independently completed the draft scale with prompt collection by the research team. The data were used for preliminary item selection to construct a trial scale.
Phase III: Validation of the Trial Scale: 2nd Survey
Similar to the first-round survey, we still first selected 50 CKD non-dialysis patients to eliminate items with ceiling or floor effects. To ensure the validity of the results, the participants’ sample size in the second-round survey should be 5–10 times the number of preset items,29 considering a nonresponse rate of 10%-20%, in addition to the graded response model (GRM) parameter estimation in item response theory (IRT) requires a sample size of at least 250 cases,30 and finally 350 non-dialysis CKD patients were recruited from nephrology departments of three tertiary hospitals. This phase aimed to conduct further item selection and finalize the final scale.
Phase IV: Evaluation of the Final Scale: 3rd Survey
The third-round survey aimed to evaluate the final scale’s feasibility, reliability, validity, discrimination, difficulty, and optimal cutoff determination. According to Tinsley’s criterion, the sample size should be more than five times the number of items or at least 200 cases,31 so we finally recruited 370 non-dialysis CKD patients. 56 patients (approximately 15% of those in the third round-survey) were randomly selected for retesting after 2 weeks to assess test-retest reliability. The flow chart illustrating the entire study process for scale development and preliminary validation is shown in Figure 1.
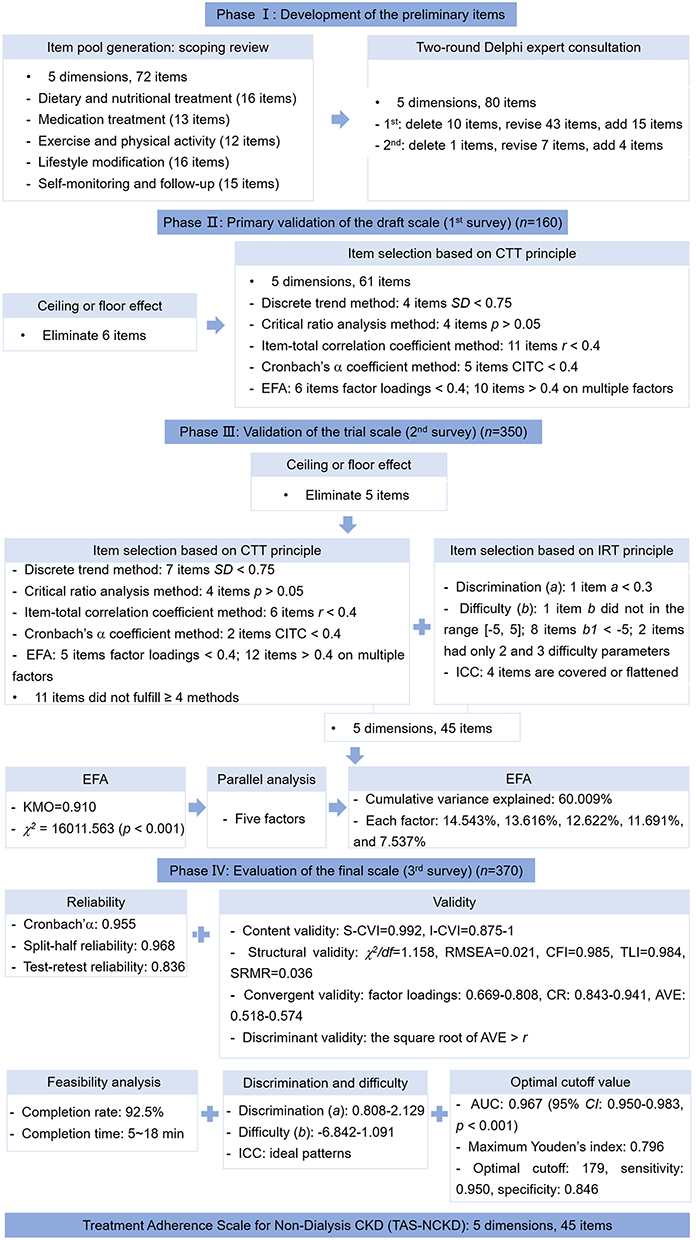 |
Figure 1 The scale development process. Abbreviations: CTT, classical test theory; SD, standard deviation; CITC, corrected item-total correlation; EFA, exploratory factor analysis; IRT, item response theory; ICC, item characteristic curve; KMO, Kaiser-Meyer-Olkin; CVI, content validity index; RMSEA, root mean square error of approximation; CFI, comparative fit index; TLI, Tucker-Lewis index; SRMR, standardized root mean square residual; CR, composite reliability; AVE, average variance extracted; AUC, the area under curve. |
Statistical Analysis
Data were analyzed by SPSS 27.0, Mplus 8.3, and R 4.5.0 software. Normality was assessed using the one-sample Kolmogorov–Smirnov test. Quantitative data are presented as mean ± standard deviation (SD), and categorical data are presented as frequency and percentage.
The ceiling or floor effect was considered present if the responses of more than 15% of participants fell on the highest or lowest score. Item selection based on classical test theory (CTT) consists of the following five methods:29 (1) discrete trend method: items with an SD < 0.75 were excluded; (2) critical ratio analysis method: participants were ranked according to their total scale scores. The top 27% and bottom 27% were classified into two groups. Independent samples t-test was used to analyze the differences between the items of the two groups and the items with a non-significant difference (p > 0.05) were excluded; (3) item-total correlation coefficient method:32 the correlation coefficient between each item and the total scale score was calculated and the item with a correlation coefficient < 0.4 or p > 0.05 were excluded; (4) Cronbach’s α coefficient method:33 items with a corrected item-total correlation (CITC) < 0.4 and whose deletion resulted in an increase in the overall Cronbach’s α coefficient were considered for exclusion; (5) exploratory factor analysis (EFA): items with a factor loading < 0.4 or multi-factor loadings > 0.4 were excluded. These five methods were used to statistically analyze each item of the scale in the first and second rounds of the survey, and the items that satisfied four or more of these methods were retained.
IRT is complementary to CTT, embodying the micro-assessment of scale items to improve the measurement instrument’s precision.34 Prior to IRT-based item selection, the unidimensionality of the scale must be assessed. If the ratio of the first to second eigenvalue > 3, it indicates that it is suitable for IRT analysis, which mainly includes the following three methods:35 (1) discrimination (parameter a): this parameter reflects an item’s ability to differentiate between respondents with varying levels of the latent trait. Items with a outside the range of [0.3, 3] were considered for deletion;34 (2) difficulty (parameters b): higher b values indicate greater item difficulty. As the scale used a 5-point Likert format, four difficulty parameters (b1, b2, b3, b4) were estimated. These parameters were expected to be within the range [−5, 5] and exhibit a monotonically increasing order (b1< b2 < b3 < b4). Items with the b parameters beyond these ranges can be deleted or modified;36 (3) item characteristic curve (ICC): ideal ICCs for the endpoint response categories (category 1 and category 5) should show monotonic trends. ICCs for the middle response categories (categories 2, 3, and 4) should show a normal distribution. Items exhibiting flat ICCs or overlapping ICCs (indicating poor discrimination or indistinct category functioning) were considered for deletion.
Reliability analysis was performed to assess the reliability and stability of the scale. This primarily involved the following three methods: (1) internal consistency reliability: Cronbach’s α coefficient ≥ 0.70 was considered acceptable;37 (2) split-half reliability: the scale items were split into two halves via odd-even allocation. The Guttman split-half coefficient was calculated to assess the correlation between the two halves. A split-half reliability coefficient > 0.6 was considered satisfactory; (3) test-retest reliability: the same scale was administered to the same participants on two separate occasions and the correlation coefficient between the scores of the two surveys > 0.7 was acceptable.38
Validity analysis was conducted to evaluate the accuracy and authenticity of the scale, including content validity, construct validity, criterion validity, convergent validity, and discriminant validity. Content validity was evaluated using the content validity index (CVI), which included both the item-level CVI (I-CVI) and the scale-level CVI (S-CVI). Content validity was acceptable if the I-CVI ≥ 0.78 and the S-CVI ≥ 0.90.39 Construct validity was assessed via EFA and confirmatory factor analysis (CFA). The suitability of the data for factor analysis was determined by the Kaiser-Meyer-Olkin (KMO) measure of sampling adequacy and Bartlett’s test of sphericity.40 Factor analysis was considered appropriate when KMO > 0.9 and Bartlett’s sphericity test was statistically significant (p < 0.05). The number of factors to retain was determined using parallel analysis. This involved comparing the scree plot of eigenvalues derived from the actual data with the curve representing the average eigenvalues obtained from randomly generated correlation matrices. The point where these two eigenvalue curves intersected indicated the absolute maximum number of factors to be extracted. Five indices were used to evaluate the degree of fit of the factors:41 (1) chi-square/degrees of freedom (χ2/df): ≤ 3 is considered to meet the standard; (2) root mean square error of approximation (RMSEA): ≤ 0.05 indicates that the model fit is good; (3) comparative fit index (CFI): > 0.90 indicates good fit; (4) Tucker-Lewis index (TLI): > 0.90 indicates good fit; (5) standardized root mean square residual (SRMR): ≤ 0.05 indicates good fit. Convergent validity and discriminant validity were evaluated using CFA. The following indicators were used to assess convergent validity: factor loadings (> 0.5), composite reliability (CR) (> 0.7), and average variance extracted (AVE) (> 0.5). Discriminant validity was established using the Fornell-Larcker criterion: for each latent dimension, the square root of its AVE must be greater than the absolute value of its correlation with any other latent dimension in the model.
Determining the cutoff score is a crucial step in the development and application of assessment instruments. Receiver operating characteristic (ROC) curve analysis was employed to determine the diagnostic accuracy of a test or to establish its optimal cutoff value. The ROC curve was plotted with sensitivity on the Y-axis and 1 - specificity on the X-axis and the area under curve (AUC) was calculated. The optimal cutoff score was determined as the point corresponding to the maximum Youden’s index.42 The larger the AUC is, the higher the accuracy; 0.90–1 is excellent accurate, and 0.80–0.89 is good accuracy. Ideally, the optimal cutoff score corresponds to high sensitivity and specificity (> 0.90).43 Based on the optimal cutoff value, treatment adherence levels can be classified into two categories: good or poor. This classification framework enables clinicians and healthcare providers to quickly identify patients with poor treatment adherence.
In addition to good reliability and validity, it is essential to evaluate the feasibility of a scale, which is generally measured by the completion rate and the completion time. The scale is considered acceptable if the valid completion rate exceeds 85% and completion within 30 minutes.
Results
Development of the Preliminary Items: 72 Items→ 77 Items→ 80 Items
Following the summarization of the literature included in the scoping review using the KAP theory and the referral to previous assessment instruments, we developed a preliminary item pool comprising 72 items across five dimensions, including dietary and nutritional treatment (16 items), medication treatment (13 items), exercise and physical activity (12 items), lifestyle modification (16 items), and self-monitoring and follow-up (15 items). In the first round of Delphi expert consultation, 17 questionnaires were distributed, with all 17 returned valid responses (valid response rate of 100%). This round resulted in the deletion of 10 items, revision of 43 items, and addition of 15 items. The revised scale retained 5 dimensions with 77 items. In the second round of Delphi expert consultation, 17 questionnaires were distributed, resulting in 16 valid responses (valid response rate of 94.12%). This round led to the deletion of 1 item, revision of 7 items, and addition of 4 items. The preliminarily scale comprised 5 dimensions and 80 items.
Primary Validation of the Draft Scale (1st Survey): 80 Items→ 74 Items→ 61 Items
The pre-survey eliminated 6 items with ceiling or floor effects, leaving 74 items. 170 questionnaires were distributed in the first round of survey and 160 valid questionnaires were recovered with the valid response rate of 94.12%. The mean age of the patients was 47.32 ± 13.38 years, and the remaining general information is detailed in Table 1.
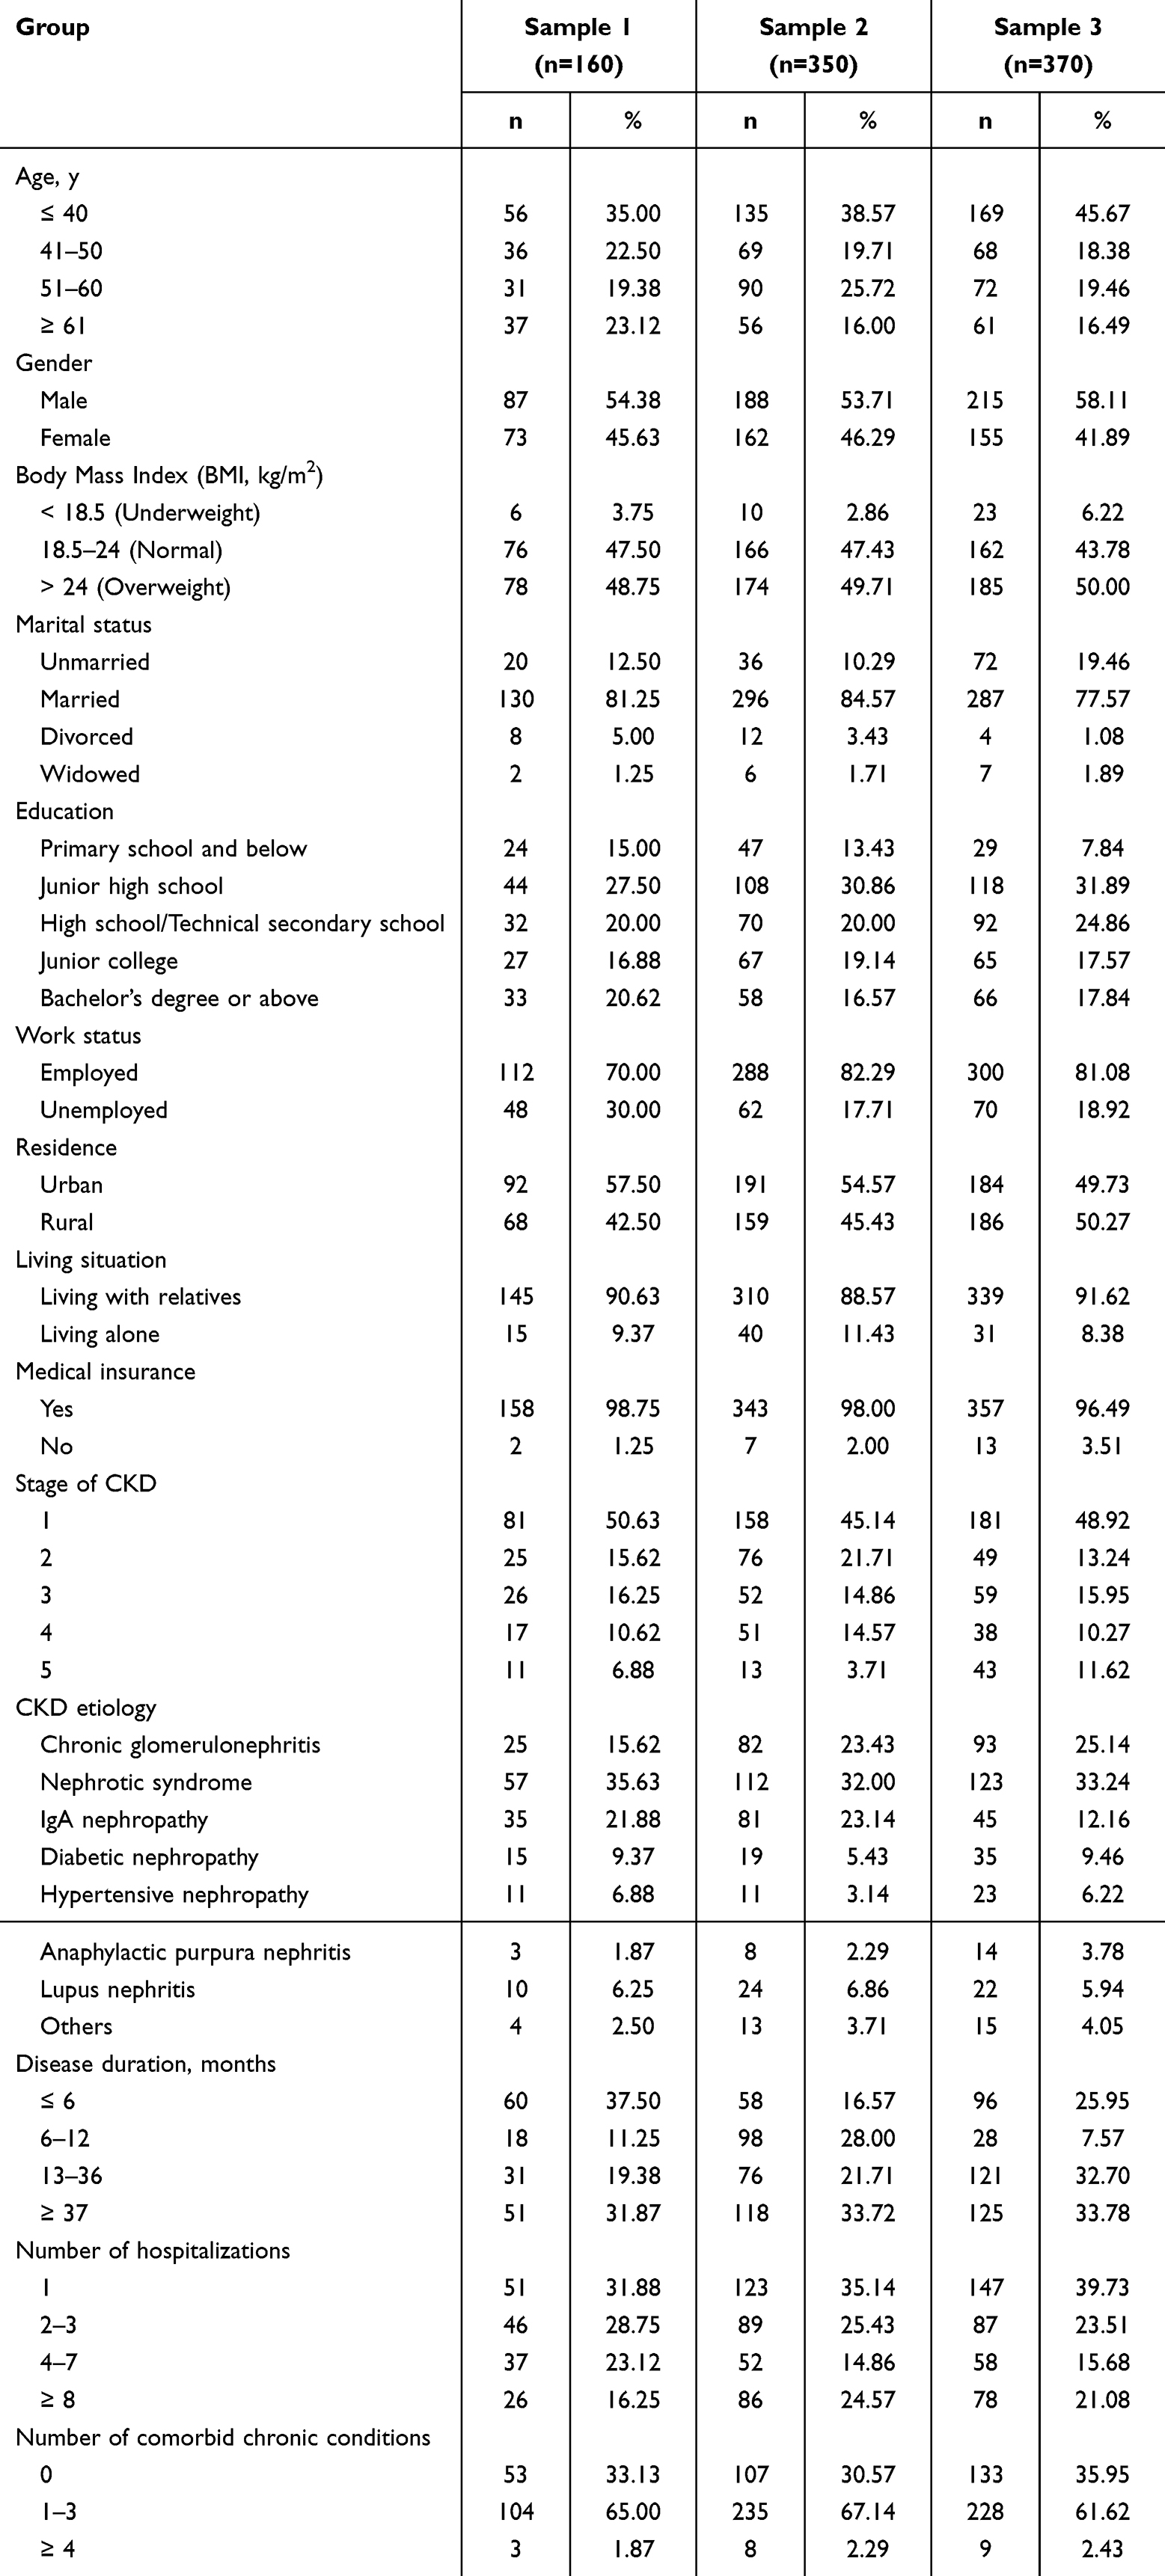 |
Table 1 Demographic and Clinical Information for Non-Dialysis CKD Patients in the Evaluation of the Treatment Adherence Scale |
In the first-round survey, item selection was performed on the draft scale based on CTT principle (Table S2 in Supplementary materials). A total of 13 items were ultimately eliminated, resulting in a trial scale containing 61 items.
Validation of the Trial Scale (2nd Survey): 61 Items→ 56 Items→ 45 Items
The second round of pre-survey eliminated 5 items with ceiling or floor effects, leaving 56 items. 365 questionnaires were distributed in the second round of survey and 350 valid questionnaires were recovered with the valid response rate of 95.89%. The mean age of the patients was 46.42 ± 13.88 years, and the remaining general information is detailed in Table 1.
In the second-round survey, further item selection was performed on the trial scale based on CTT and IRT principles (Table S3, S4 and Figure S1 in Supplementary materials). Ultimately, 11 items were excluded, resulting in a final scale comprising 45 items across 5 dimensions. EFA was conducted on this scale, and the KMO measure was 0.910 (> 0.6), and Bartlett’s test of sphericity yielded χ2 = 16,011.563 (p < 0.001), confirming suitability for factor analysis.
When the number of factors was unconstrained, parallel analysis (Figure 2) revealed that eigenvalues of the first five factors from the observed data exceeded the mean eigenvalues of random data matrices. This supported retaining five factors, aligning with the scale’s original theoretical structure. Subsequent EFA constrained to five factors demonstrated adequate explanatory power, with cumulative variance explained reaching 60.009%, and each factor percentage of variance explained were 14.543%, 13.616%, 12.622%, 11.691%, and 7.537%, respectively. All items exhibited factor loadings > 0.40 (Table 2), which indicated that the structure of TAS-NCKD is reasonable.
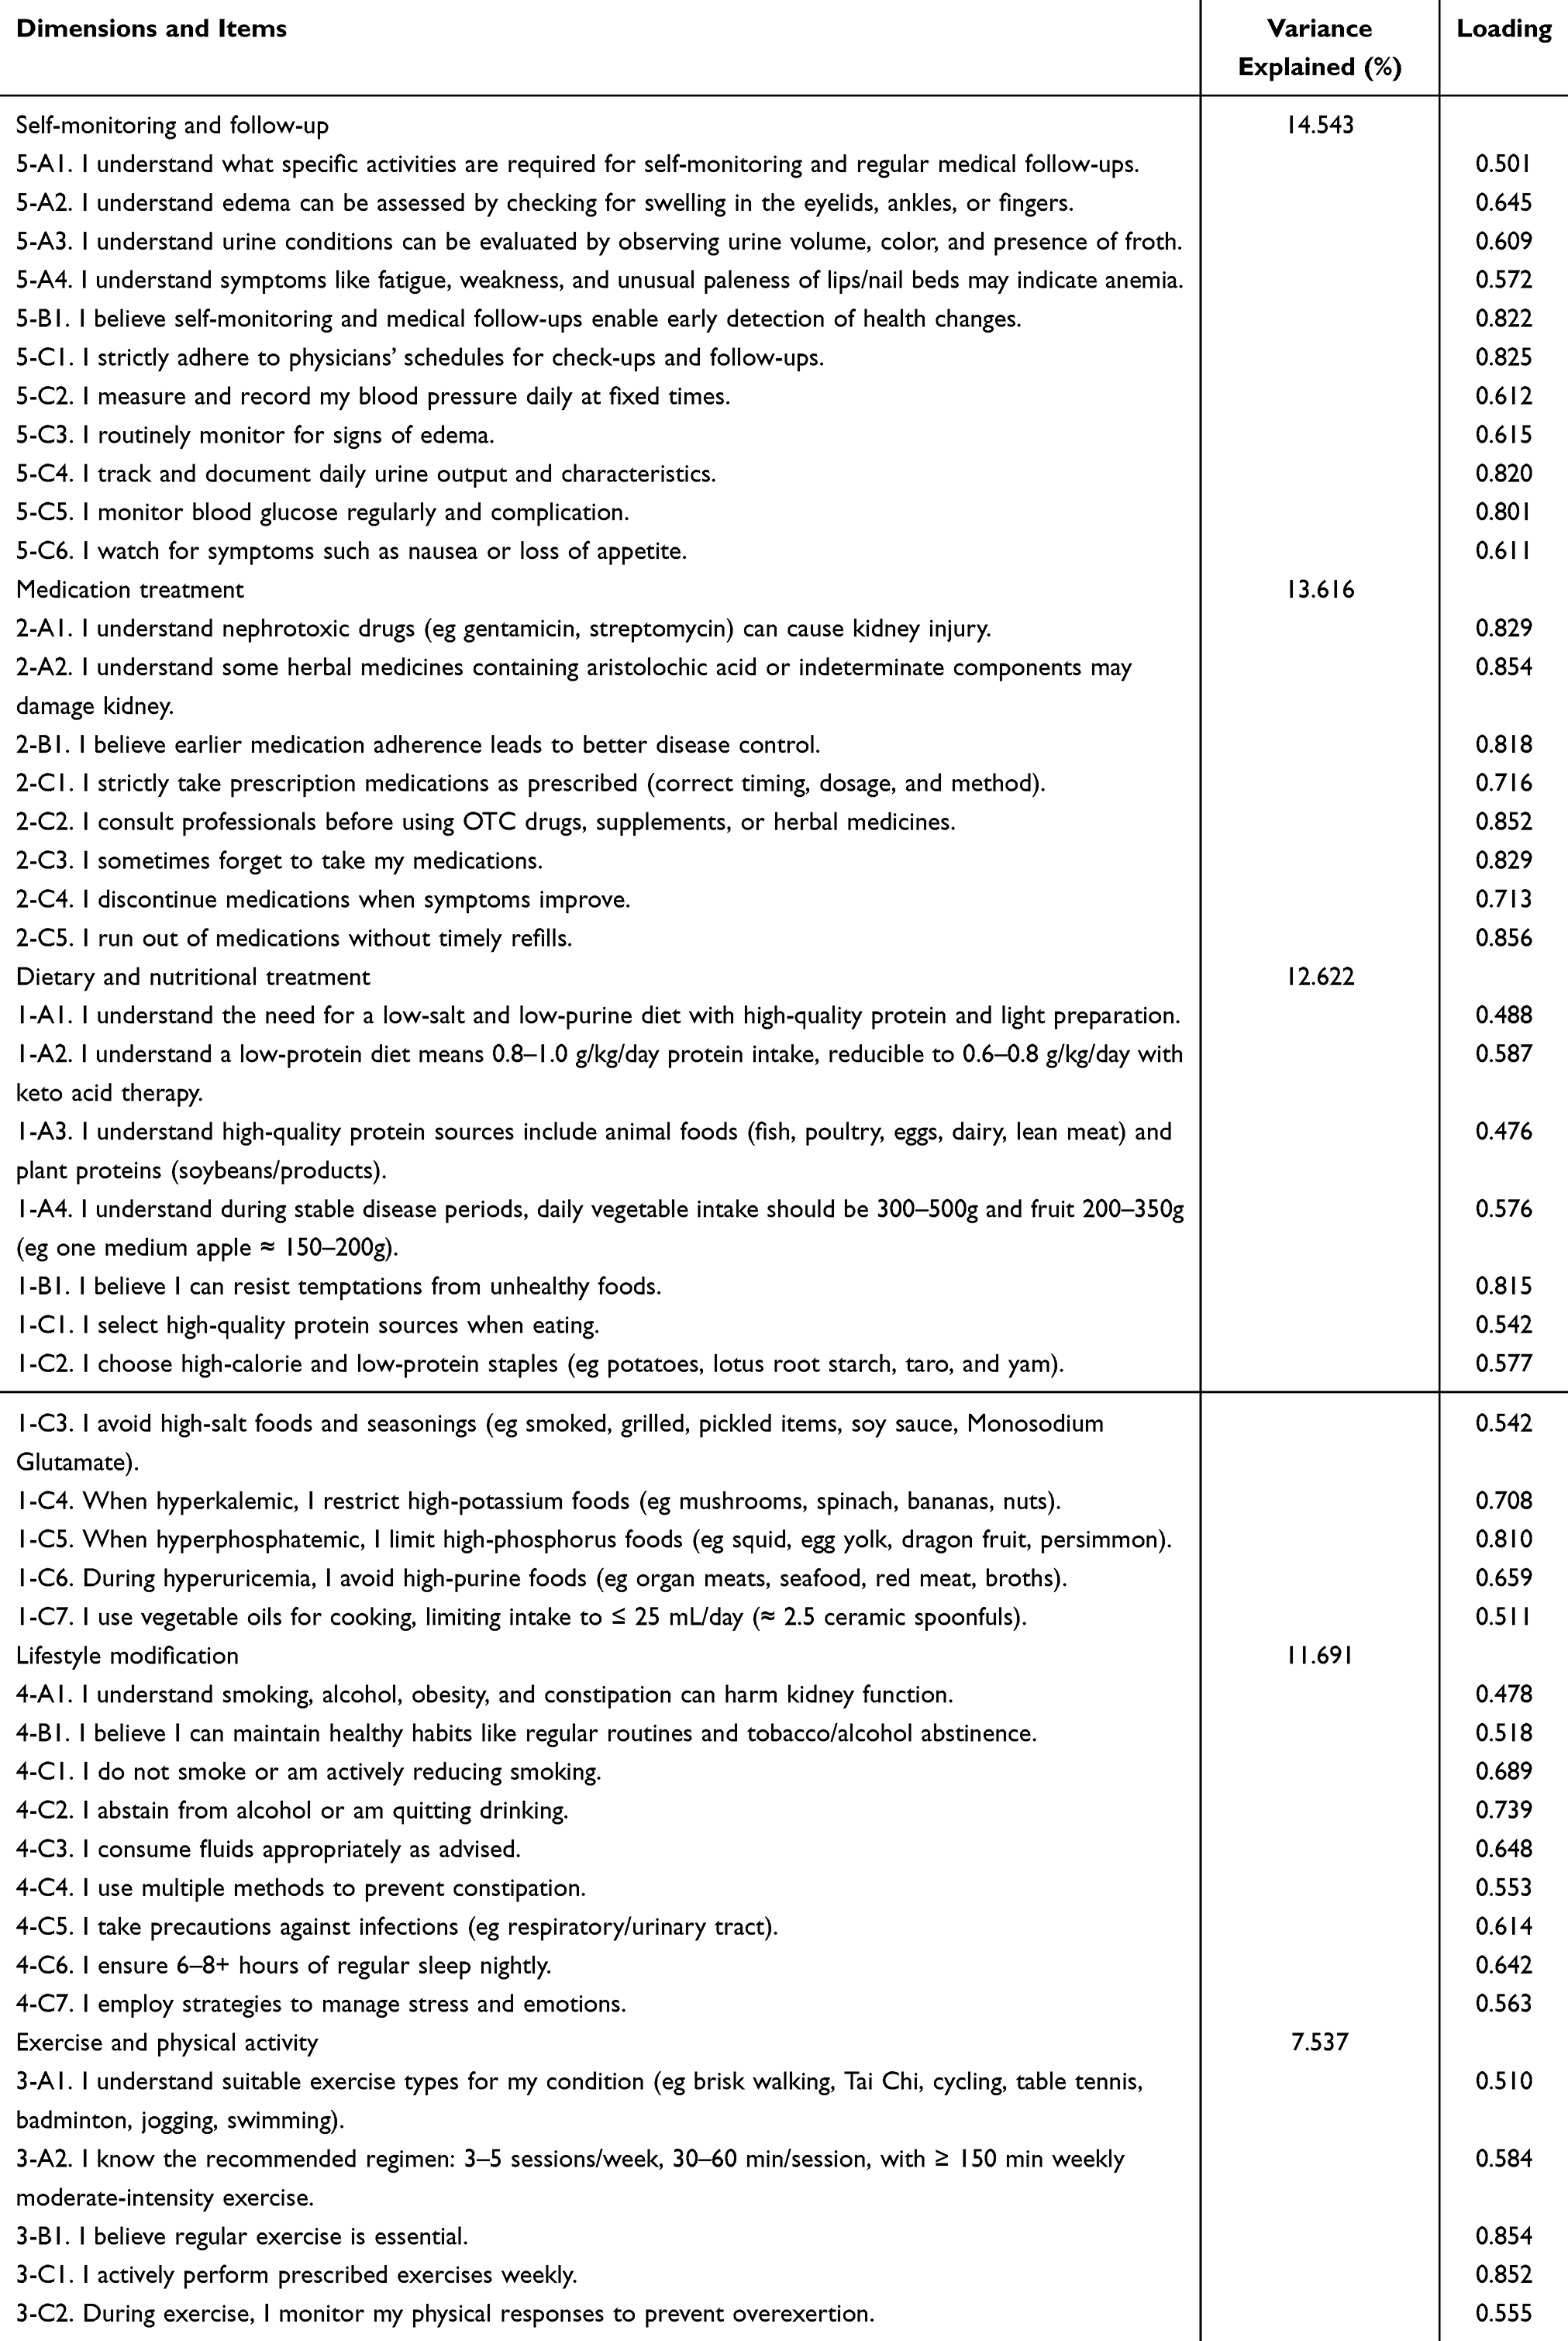 |
Table 2 Rotated Factor Loading Matrix for the Final Scale (45 Items) |
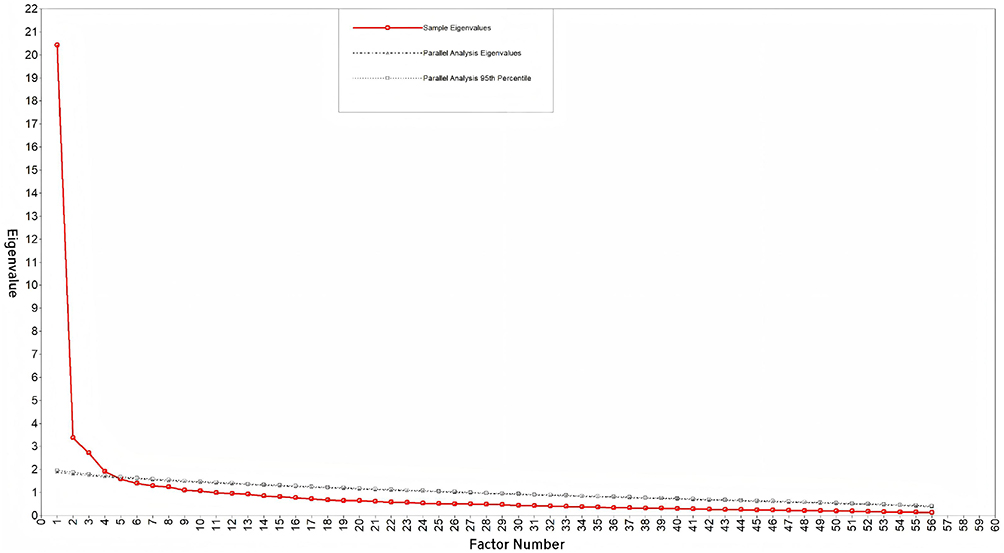 |
Figure 2 Scree plot of parallel analysis (2nd survey). |
On the basis of the results of EFA and item content interpretation, the five factors were named: dietary and nutritional treatment (12 items) - assessing adherence to dietary recommendations for CKD; medication treatment (8 items) - evaluating adherence to prescribed medication regimens; exercise and physical activity (5 items) - measuring participation in physical activities per CKD rehabilitation guidelines; lifestyle modification (9 items) - assessing adjustments to daily habits closely related to CKD; self-monitoring and follow-up (11 items) - evaluating adherence to self-monitoring and scheduled clinical reviews. As a result, the TAS-NCKD consisting of 45 items in 5 dimensions was formally created (Figure 3). All items were scored on a 5-point Likert scale ranging from “Strongly disagree” (1) to “Strongly agree” (5). Higher scores indicate better treatment adherence in non-dialysis CKD patients.
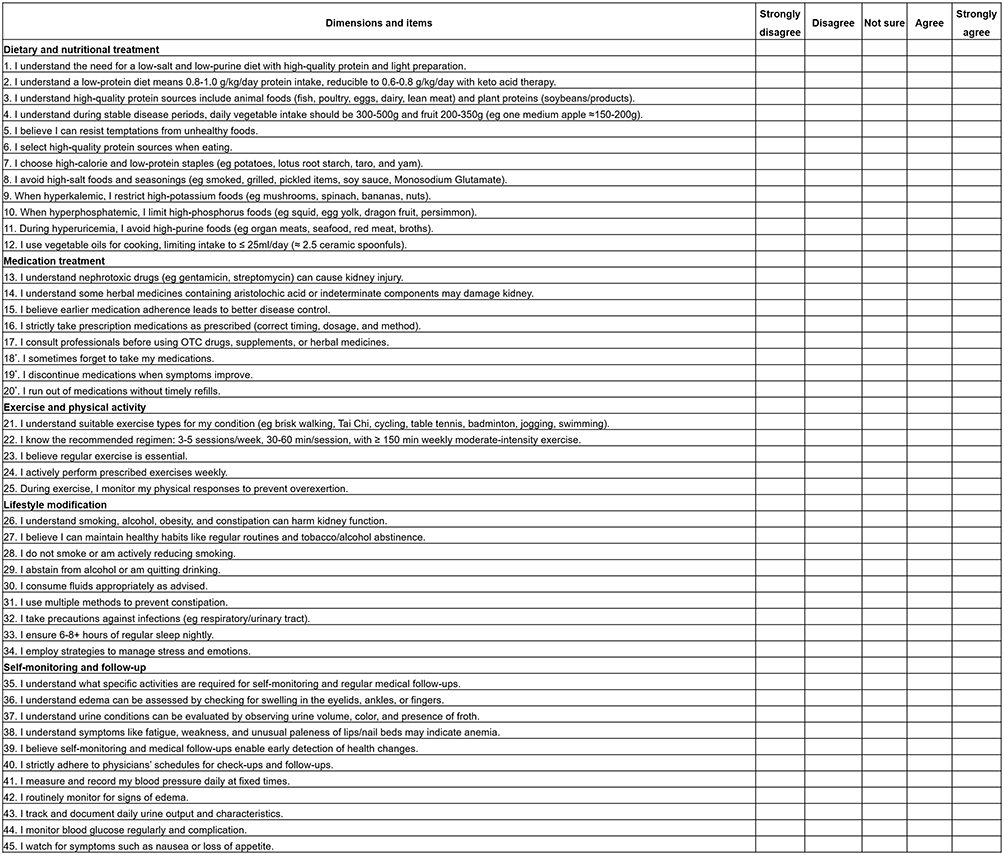 |
Figure 3 Treatment Adherence Scale for Non-dialysis Chronic Kidney Disease Patients ( Note: *Indicates reverse-scored items. |
Evaluation of the Final Scale (3rd Survey)
400 questionnaires were distributed in the third round of survey and 370 valid questionnaires were recovered with the valid response rate of 92.50%. The mean age of the patients was 44.55 ± 15.43 years, and the other general information is detailed in Table 1. For test-retest reliability assessment, 60 questionnaires were distributed to a subsample, with 56 valid returns (valid response rate was 93.33%). The retest subsample had a mean age of 43.55 ± 13.79 years. There was no statistically significant difference in demographic characteristics between the retest sample and the third-round survey sample (p > 0.05).
Feasibility Analysis
The scale demonstrated excellent feasibility and high patient compliance, with a completion rate of 92.5% in this survey phase. The completion time of the scale ranged from 5–18 minutes, all within 30 minutes, indicating that patients could easily understand and complete the scale without excessive burden.
Reliability
The Cronbach’s α coefficient for the scale was 0.955, and the Cronbach’s α coefficient for the dimensions ranged from 0.842 to 0.941, all > 0.7. Split-half reliability yielded a coefficient of 0.968, with inter-subscale correlations at 0.938. Subscale split-half coefficients ranged from 0.828 to 0.942, all > 0.60. The test-retest reliability coefficient of the scale was 0.836, and the coefficients of the dimensions ranged from 0.804 to 0.865, all > 0.7.
Validity
Eight domain experts evaluated scale content validity and the S-CVI of this scale was 0.992 and the I-CVI was 0.875–1, as detailed in Table S5 in Supplementary materials. CFA was conducted to verify structural validity. Using maximum likelihood estimation, the model fit indices met all criteria: χ2/df = 1.158 ≤ 3, RMSEA = 0.021 ≤ 0.05, CFI = 0.985 ≥ 0.90, TLI = 0.984 ≥ 0.90, and SRMR = 0.036 ≤ 0.05. All 45 items demonstrated standardized factor loadings > 0.60 (p < 0.05), confirming excellent fit for the 5-factor model of the TAS-NCKD (Figure 4).
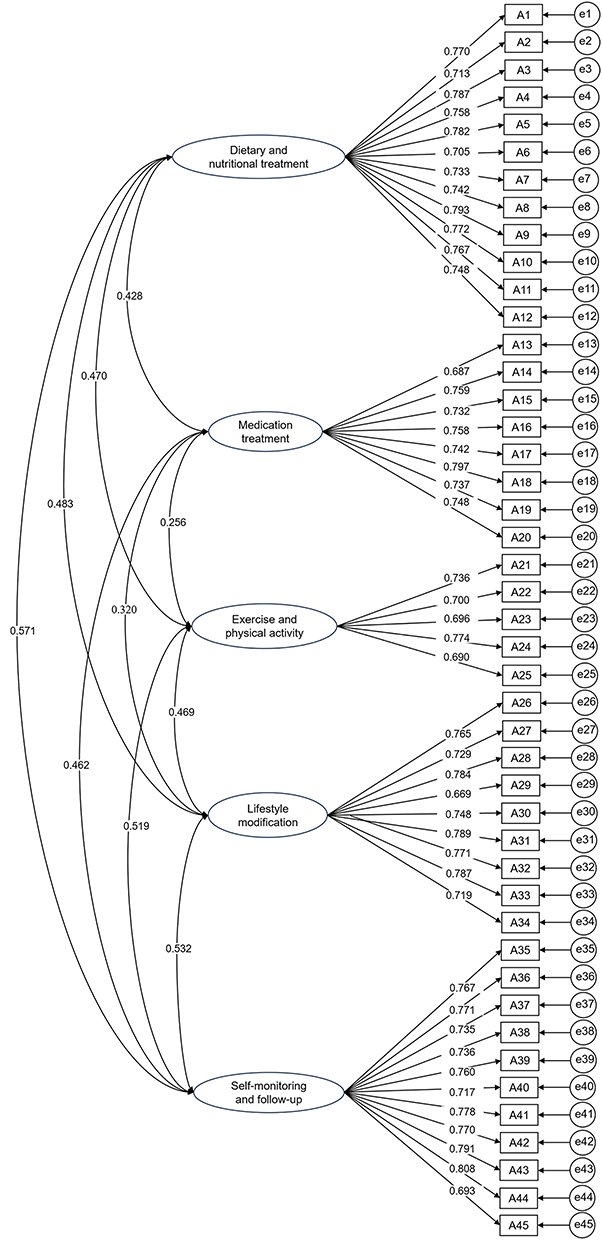 |
Figure 4 The proposed models of the scale by CFA. |
Convergent validity was confirmed by the factor loadings ranging 0.669–0.808 (all > 0.50), AVE values of 0.572, 0.556, 0.518, 0.566, and 0.574 (all > 0.50), and CR values of 0.941, 0.909, 0.843, 0.921, and 0.937 (all > 0.70). The square root of each dimension’s AVE exceeded its correlation coefficients with all other dimensions, as detailed in Table 3.
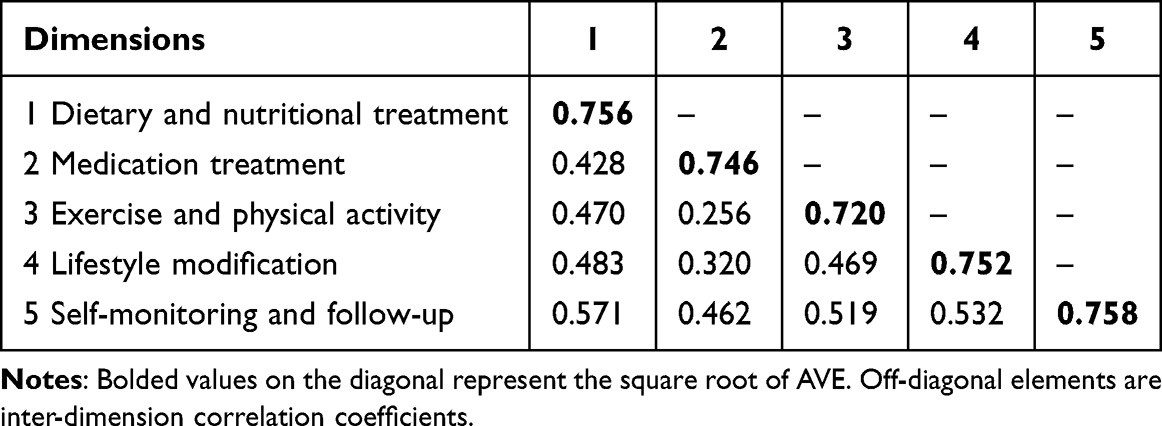 |
Table 3 Fornell-Larcker Matrix for the TAS-NCKD |
Discrimination and Difficulty
The scale demonstrated unidimensionality for IRT analysis, with the ratio of the first-to-second eigenvalues (15.474/3.802 = 4.07) > 3. Discrimination parameters (a) ranged from 0.808 to 2.129 across all 45 items (all > 0.30). Difficulty parameters (b) ranged from −6.842 to 1.091. Although five items (A14, A15, A17, A18, A20) had b1 values < −5, all other threshold parameters remained within [−5, 5] and satisfied monotonic ordering (b1< b2 < b3 < b4). ICCs showed ideal patterns with categories 1 and 5 exhibited monotonic trends and categories 2, 3, and 4 demonstrated unimodal distributions (Table S6 and Figure S2 in Supplementary materials).
Optimal Cutoff Value
ROC curve analysis for TAS-NCKD yielded an AUC of 0.967 (95% CI: 0.950–0.983; p < 0.001). The maximum Youden’s index was 0.796 (Table S7 in Supplementary materials), corresponding to a scale score of 178.5 points. Given that total scores are integers, the optimal cutoff was established at 179 points. At this threshold, sensitivity was 0.950 and specificity was 0.846 (Figure 5).
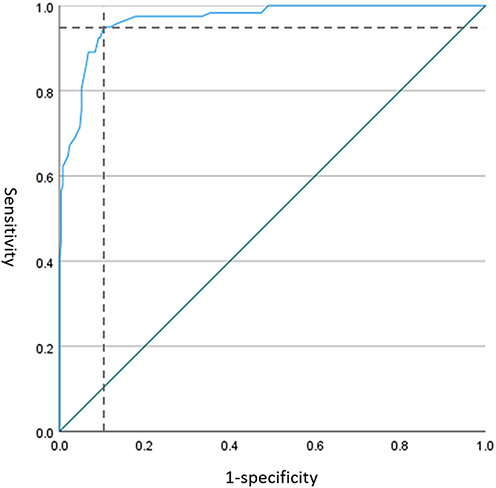 |
Figure 5 ROC curve for Tas-NCKD. |
Discussion
This study strictly adhered to scale development principles by establishing an item pool, constructing a preliminary scale draft, selecting items to form the final scale, and conducting a psychometric evaluation. This process ensured scientific rigor in developing the TAS-NCKD, providing a disease-specific measurement instrument for assessing treatment adherence in non-dialysis CKD patients.
Currently, CKD is an incurable lifelong condition requiring long-term medication, regular follow-up and lifestyle management including diet, exercise, and rest to slow disease progression and reduce complications such as hypertension, diabetes, and cardiovascular events.7 Enhancing treatment adherence in non-dialysis patients is thus pivotal to alleviating the burden on patients and their families and improving prognosis. Therefore, improving overall treatment adherence in non-dialysis CKD patients is imperative, and accurate adherence assessment is a fundamental prerequisite. Unlike previous unidimensional scales such as the RAAQ, RABQ, and MMAS-8 that focus only on diet or medication, the TAS-NCKD comprehensively covers five core dimensions: dietary and nutritional treatment, medication treatment, exercise and physical activity, lifestyle modification, and self-monitoring and follow-up, each integrating knowledge, attitudes, and behaviors. Distinct from dialysis-targeted scales, it addresses the unique treatment needs of non-dialysis CKD patients, whose dietary, fluid, and monitoring requirements differ substantially from dialysis populations.44 By addressing this unmet need, the TAS-NCKD responds to global kidney health initiatives and provides a foundation for targeted interventions and lifespan CKD management.
Notably, standardized adherence assessment tools remain underutilized in international nephrology practice, hindered by limited cross-cultural adaptability, clinical workflow constraints prioritizing acute complication management over adherence assessment, and weak links between tool results and actionable interventions.45,46 The TAS-NCKD addresses these issues with its concise design (5–18 min completion time) and clear good/poor adherence classification, making it a feasible addition to routine outpatient care and a model for promoting adherence tool utility globally.
The TAS-NCKD’s item pool was derived from a scoping review aligned with the WHO’s treatment adherence definition and refined via two rounds of Delphi consultation with multidisciplinary experts. A multi-tiered quantitative evaluation was then performed by synergistically integrating both CTT and IRT, enabling error reduction through macro- and micro-level psychometric analyses. The final items specify clinically actionable details (diet, medication, exercise, lifestyle, monitoring) for non-dialysis CKD patients beyond general principles, grounded in guidelines and practice. In terms of dietary and nutritional treatment, the sub-scale addresses both general principles and specific restrictions on high-sodium, high-potassium, high-phosphorus, high-purine, and high-fat foods, emphasizing that prohibitions are conditioned on biomarker abnormalities rather than blanket prohibitions. For medication treatment, building upon the MMAS-8, it supplements nephrotoxic medications (both Western and Chinese), medication-taking habits, and incorporates reverse-scored items to mitigate response bias and enhance data validity.47 Exercise and physical activity assessment comprehensively examines exercise types, duration, frequency, intensity, and outcomes. For lifestyle modification, beyond conventional lifestyle factors like smoking cessation, alcohol restriction, and sleep hygiene, it specifically highlights bowel regularity, weight control, infection prevention, and stress management. Regarding self-monitoring and follow-up, the sub-scale investigates daily self-assessment of urine characteristics, edema, anemia, nausea/appetite loss, while emphasizing proactive tracking of blood pressure and blood glucose for early complication detection. Following rigorous psychometric evaluation, the final TAS-NCKD was established, comprising 5 dimensions and 45 items. The scale requires 5–18 minutes for completion, a feasible duration that is acceptable to adult participants in clinical settings.
The TAS-NCKD demonstrates robust psychometric properties, including satisfactory reliability, validity, appropriate item characteristics, and empirically derived optimal cutoff values. Specifically, Cronbach’s α coefficients were > 0.70 for both the total scale and all subscales, indicating excellent internal consistency.37 Split-half reliability coefficients were all > 0.6, confirming good scale homogeneity. Test-retest coefficients were > 0.7 across all dimensions, confirming temporal stability.38 With an S-CVI of 0.992 and I-CVI ranging from 0.875 to 1, the scale exhibits excellent content validity, reflecting strong congruence between measured content and target constructs.39 CFA demonstrated good model fit, supporting structural validity. All items displayed factor loadings > 0.50 with CR > 0.70 and AVE > 0.50 per dimension, establishing convergent validity for precise target concept measurement. Discriminant validity meets the Fornell-Larcker criterion, confirming distinct dimensionality.48 All items demonstrated adequate discrimination (a >0.3). While the b1 parameters for several items were < −5, remaining threshold parameters remained within the acceptable range. ICCs exhibited appropriate psychometric properties, confirming the scale’s ability to discriminate between respondents of varying trait levels. The observed threshold deviations may stem from cognitive interference with adjacent reverse-scored items, marginally increasing item difficulty.49 Following expert panel deliberation, these items were retained due to their irreplaceable contribution to core construct domains, with all other psychometric indices meeting established standards. This decision aligns with methodological consensus that content representativeness outweighs minor statistical deviations when preserving measurement comprehensiveness.50 The scale achieved strong predictive accuracy with an AUC of 0.967. At the optimal cutoff score of 179, the sensitivity and specificity were 0.950 and 0.846 respectively, indicating robust discriminatory power for identifying patients with suboptimal adherence. This threshold enables timely initiation of specialized interventions for patients scoring < 179, optimizing resource allocation and enhancing CKD management efficiency.
The TAS-NCKD demonstrates promising potential for clinical practice implication and can be further empowered by integration with digital health and AI technologies. Digitizing the scale into mobile applications allows patients to complete assessments conveniently, with AI algorithms automatically analyzing results and generating personalized intervention recommendations. In routine practice, the scale can be administered by nurses or medical assistants while patients wait for consultations or when hospitalized. Brief verbal explanations of the scale’s purpose can significantly improve participation rates among hesitant patients. In addition, the TAS-NCKD should be integrated into routine CKD follow-up protocols, where poor adherence classification triggers mandatory targeted interventions such as regular telephone reminders and dietary counseling sessions. Designed for multidisciplinary clinical use, its predictive validity can be longitudinally verified against eGFR decline trajectories and hospitalization rates. The scale bridges critical measurement gaps in CKD behavioral medicine, and the implementation may provide high-level evidence for integrating the TAS-NCKD scale into routine clinical practice for non-dialysis CKD management, ultimately inform targeted intervention strategies, enhance treatment adherence, slow disease progression and reduce disease burden.
Strengths and Limitations
This study provides a multidimensional and specific assessment instrument to quantify treatment adherence in non-dialysis CKD patients. Methodologically, we employed an integrated qualitative-quantitative approach for item development, utilizing complementary psychometric methods (CTT and IRT) across three survey rounds to ensure rigorous item calibration precision. Furthermore, the established optimal cutoff score reduces missed interventions for high-risk patients, facilitating practical implementation in clinical settings. Although the 45-item scale may appear lengthy, its concise phrasing and comprehensibility enabled completion within 18 minutes, demonstrating high acceptability.
Nevertheless, there are several limitations. First, mild positive selection bias existed. Patients volunteering for scale validation studies are typically more engaged, health-conscious, and inherently more adherent. Future studies should expand recruitment to community-dwelling patients and use stratified sampling to improve representativeness. Second, further prospective clinical validation is required to confirm its ability to improve patient-centered outcomes across diverse clinical and cultural contexts, where context-sensitive items may elicit differential responses. To facilitate international use, a three-step cross-cultural adaptation pathway is proposed: (1) standardized forward-backward translation by bilingual experts; (2) multi-center psychometric validation with context-specific item adjustments; (3) development of international normative data. Finally, when the GRM model of IRT is used for evaluation, a sample size of at least 500 is required for more accurate parameter estimation. While the present study combines the results of the CTT indicators with those of the EFA and CFA, expanding the sample size would improve the scale in the future.
Conclusion
In this study, a standardized Treatment Adherence Scale for Non-Dialysis CKD Patients was developed. The initial dimensions and item pool were grounded in the KAP framework, existing literature, and expert consultations. Through three survey rounds employing comprehensive psychometric evaluations including ceiling/floor effect analysis, integrated CTT-IRT item screening, reliability/validity testing, EFA, CFA, and optimal cutoff determination, the final 45-item scale with five dimensions was established. The TAS-NCKD demonstrates robust psychometric properties, representing a practical instrument for assessing treatment adherence in non-dialysis CKD populations. This study provides population-specific insights for enhancing adherence behaviors and facilitating active disease self-management. Clinically, the scale can support stratified adherence screening and targeted interventions in routine clinical care, while its potential for integration with digital health technologies and cross-cultural adaptation lays a foundation for broader application. Future research will further verify its long-term predictive value in CKD outcomes.
Data Sharing Statement
The datasets used during the study are available from the corresponding author Honghong Lv on reasonable request.
Ethics Approval and Consent to Participate
This study received approval from the Ethics Committee of the Second Affiliated Hospital of the Fourth Military Medical University (No. K202503-41). Ethical guidelines were strictly adhered to throughout the investigation. All participants were assured of their right to withdraw at any time, and the collected data were used solely for academic purposes.
Author Contributions
All authors made a significant contribution to the work reported, whether that is in the conception, study design, execution, acquisition of data, analysis and interpretation, or in all these areas; took part in drafting, revising or critically reviewing the article; gave final approval of the version to be published; have agreed on the journal to which the article has been submitted; and agree to be accountable for all aspects of the work.
Funding
This study was funded by Nursing Research Foundation of Tangdu Hospital, The Fourth Military Medical University (Air Force Medical University) (Grant No. HLKYKT-202511).
Disclosure
The authors report no conflicts of interest in this work.
References
1. Murton M, Goff-Leggett D, Bobrowska A, et al. Burden of chronic kidney disease by KDIGO categories of glomerular filtration rate and albuminuria: a systematic review. Adv Ther. 2021;38(1):180–17. doi:10.1007/s12325-020-01568-8
2. Bello AK, Okpechi IG, Levin A, et al. An update on the global disparities in kidney disease burden and care across world countries and regions. Lancet Glob Health. 2024;12(3):e382–e395. doi:10.1016/S2214-109X(23)00570-3
3. Wang L, Xu X, Zhang M, et al. Prevalence of chronic kidney disease in China: results from the sixth China chronic disease and risk factor surveillance. JAMA Intern Med. 2023;183(4):298–310. doi:10.1001/jamainternmed.2022.6817
4. GBD Chronic Kidney Disease Collaboration. Global, regional, and national burden of chronic kidney disease, 1990–2017: a systematic analysis for the global burden of disease study 2017. Lancet. 2020;395(10225):709–733. doi:10.1016/S0140-6736(20)30045-3
5. Wing-Shing Fung W, Park HC, Hirakawa Y, et al. Capacity for the management of kidney failure in the International Society of Nephrology North and East Asia region: report from the 2023 ISN Global Kidney Health Atlas (ISN-GKHA). Kidney Int Suppl. 2024;13(1):97–109. doi:10.1016/j.kisu.2024.02.001
6. Levin A, Ahmed SB, Carrero JJ, et al. Executive summary of the KDIGO 2024 clinical practice guideline for the evaluation and management of chronic kidney disease: known knowns and known unknowns. Kidney Int. 2024;105(4):684–701. doi:10.1016/j.kint.2023.10.016
7. Ekholm M, Aulbach M, Walsh S, Phipps D, Rauta V, Knittle K. Behavioral interventions targeting treatment adherence in chronic kidney disease: a systematic review and meta-analysis. Soc Sci Med. 2025;366:117594. doi:10.1016/j.socscimed.2024.117594
8. Burkhart PV, Sabaté E. Adherence to long-term therapies: evidence for action. J Nurs Scholarsh. 2003;35(3):207.
9. Cedillo-Couvert EA, Ricardo AC, Chen J, et al. Self-reported medication adherence and CKD progression. Kidney Int Rep. 2018;3(3):645–651. doi:10.1016/j.ekir.2018.01.007
10. Thompson AS, Gaggl M, Bondonno NP, et al. Adherence to a healthful plant-based diet and risk of mortality among individuals with chronic kidney disease: a prospective cohort study. Clin Nutr. 2024;43(10):2448–2457. doi:10.1016/j.clnu.2024.09.021
11. Palomares SM, Ferrara G, Sguanci M, et al. The impact of artificial intelligence technologies on nutritional care in patients with chronic kidney disease: a systematic review. J Ren Nutr. 2025;S1051–S2276(25):126–128. doi:10.1053/j.jrn.2025.06.002
12. Deng T, Xue Y, Methakanjanasak N. Digital health integration in chronic kidney disease. Clin Chim Acta. 2025;582:120749. doi:10.1016/j.cca.2025.120749
13. Czaja-Stolc S, Puchalska-Reglińska E, Małgorzewicz S, et al. Adherence to caloric and protein recommendations in older hemodialysis patients: a multicenter study. Nutrients. 2022;14(19):4160. doi:10.3390/nu14194160
14. Thompson FE, Dixit-Joshi S, Potischman N, et al. Comparison of interviewer-administered and automated self-administered 24-hour dietary recalls in 3 diverse integrated health systems. Am J Epidemiol. 2015;181(12):970–978. doi:10.1093/aje/kwu467
15. Kalantar-Zadeh K, Moore LW, Tortorici AR, et al. North American experience with low protein diet for non-dialysis-dependent chronic kidney disease. BMC Nephrol. 2016;17(1):90. doi:10.1186/s12882-016-0304-9
16. Tang L, Fu Z. The effects of the transtheoretical model combined with nutritional intervention in hemodialysis patients. Am J Transl Res. 2021;13(7):7898–7905.
17. Amir S, Kim H, Hu EA, Ricardo AC, Mills KT, He J. Adherence to plant-based diets and risk of CKD progression and all-cause mortality: findings from the chronic renal insufficiency cohort (CRIC) study. Am J Kidney Dis. 2024;83(5):624–635. doi:10.1053/j.ajkd.2023.09.020
18. Kotsis F, Schultheiss UT, Wuttke M, et al. Self-reported medication use and urinary drug metabolites in the German chronic kidney disease (GCKD) study. J Am Soc Nephro. 2021;32(9):2315–2329. doi:10.1681/ASN.2021010063
19. Han Y, Saran R, Erickson SR, Hirth RA, He K, Balkrishnan R. Environmental and individual predictors of medication adherence among elderly patients with hypertension and chronic kidney disease: a geospatial approach. Res Social Adm Pharm. 2020;16(3):422–430. doi:10.1016/j.sapharm.2019.06.011
20. Gamal S, Elseasi AMA, Sabry NA, Farid SF. Impact of pharmacist led mobile application on medication adherence and efficacy in chronic kidney disease. NPJ Digit Med. 2025;8(1):325. doi:10.1038/s41746-025-01742-8
21. Mechta Nielsen T, Marott T, Hornum M, Feldt-Rasmussen B, Kallemose T, Thomsen T. Non-adherence, medication beliefs and symptom burden among patients receiving hemodialysis -a cross-sectional study. BMC Nephrol. 2023;24(1):321. doi:10.1186/s12882-023-03371-3
22. Parker K, Bull-Engelstad I, Aasebø W, et al. Medication regimen complexity and medication adherence in elderly patients with chronic kidney disease. Hemodial Int. 2019;23(3):333–342. doi:10.1111/hdi.12739
23. Belhmer FS, Al Amad MA, Albitahi MH, Babattah FK. Adherence to treatment regimens among end-stage renal disease patients: a cross-sectional study. Int J Nephrol Renovasc Dis. 2025;18:143–150. doi:10.2147/IJNRD.S511221
24. Cleland J. A critique of KAP studies and some suggestions for their improvement. Stud Fam Plann. 1973;4(2):42–47.
25. Xu F, Zhuang B, Wang Z, et al. Knowledge, attitude, and practice of patients receiving maintenance hemodialysis regarding hemodialysis and its complications: a single-center, cross-sectional study in Nanjing. BMC Nephrol. 2023;24(1):275. doi:10.1186/s12882-023-03320-0
26. DeVellis RF. Scale Development: Theory and Applications.
27. Kidney Disease: Improving Global Outcomes (KDIGO) CKD Work Group. KDIGO 2024 clinical practice guideline for the evaluation and management of chronic kidney disease. Kidney Int. 2024;105(4S):S117–S314. doi:10.1016/j.kint.2023.10.018
28. Arksey H, O’Malley L. Scoping studies: towards a methodological framework. Int J Soc Res Method. 2005;8(1):19–32. doi:10.1080/1364557032000119616
29. Tang H, Zhang W, Shen H, et al. Development and preliminary validation of the Dietary Self-management Behavior Questionnaire (DSMBQ) for breast cancer patients during chemotherapy: three rounds of survey. BMC Public Health. 2024;24(1):3579. doi:10.1186/s12889-024-21128-x
30. Fayers P. Item response theory for psychologists. Qual Life Res. 2004;13(3):715–716. doi:10.1023/B:QURE.0000021503.45367.f2
31. Tinsley HEA, Tinsley DJ. Uses of factor analysis in counseling psychology research. J Couns Psychol. 1987;34(4):414–424. doi:10.1037/0022-0167.34.4.414
32. Rodgers J, AlanNicewander W. Thirteen Ways to Look at the Correlation Coefficient. Am Stat. 1988;42(1):59–66.
33. Ferketich S. Focus on psychometrics: aspects of item analysis. Res Nurs Health. 1991;14(2):165–168. doi:10.1002/nur.4770140211
34. Kazemi A, Kajonius P. Assessing person-centred care: an item response theory approach. Int J Older People Nurs. 2021;16(1):e12352. doi:10.1111/opn.12352
35. Walsh A, Cao R, Wong D, et al. Using item response theory (IRT) to improve the efficiency of the Simple Clinical Colitis Activity Index (SCCAI) for patients with ulcerative colitis. BMC Gastroenterol. 2021;21(1):132. doi:10.1186/s12876-021-01621-y
36. Liu BQ, Wen ZH, Zhou L. Revision of the perioperative recovery scale for integrative medicine based on item response theory. Chin J Evid Based Med. 2024;24(04):439–444. In Chinese.
37. Thomas S. Scale development: theory and applications. Pers Psychol. 2022;75(1):243–244. doi:10.1111/peps.12499
38. DeVon HA, Block ME, Moyle-Wright P, et al. A psychometric toolbox for testing validity and reliability. J Nurs Scholarsh. 2007;39(2):155–164. doi:10.1111/j.1547-5069.2007.00161.x
39. Polit DF, Beck CT. The content validity index: are you sure you know what’s being reported? Critique and recommendations. Res Nurs Health. 2006;29(5):489–497. doi:10.1002/nur.20147
40. Kaiser HF. An index of factorial simplicity. Psychometrika. 1974;39(1):31–36.
41. Hu LT, Bentler PM. Cutoff criteria for fit indexes in covariance structure analysis: conventional criteria versus new alternatives. Struct Equation Model. 1999;6(1):1–55.
42. Cho S, Kim YJ, Lee M, Woo JH, Lee HJ. Cut-off points between pain intensities of the postoperative pain using receiver operating characteristic (ROC) curves. BMC Anesthesiol. 2021;21(1):29. doi:10.1186/s12871-021-01245-5
43. Lee SC, Liu CC, Kuo CJ, Hsueh IP, Hsieh CL. Sensitivity and specificity of a facial emotion recognition test in classifying patients with schizophrenia. J Affect Disord. 2020;275:224–229. doi:10.1016/j.jad.2020.07.003
44. Kovesdy CP, Brunori G, Fouque D, et al. Dietary protein intake recommendations for patients with non-dialysis-dependent CKD: what should healthcare providers do? Clin J Am Soc Nephrol. 2025. doi:10.2215/CJN.0000000772
45. Sharma N, Walker JD, Wenghofer E, et al. Indigenous approaches to health assessment: a scoping review protocol. Syst Rev. 2024;13(1):78. doi:10.1186/s13643-024-02496-2
46. Mechta Nielsen T, Schjerning N, Kaldan G, et al. Practices and pitfalls in medication adherence in hemodialysis settings - a focus-group study of health care professionals. BMC Nephrol. 2021;22(1):315. doi:10.1186/s12882-021-02514-8
47. Ilhan M, Guler N, Teker GT, Ergenekon O. The effects of reverse items on psychometric properties and respondents’ scale scores according to different item reversal strategies. Int J Assess Tools E. 2024;11(1):20–38. doi:10.21449/ijate.1345549
48. Cheung GW, Cooper-Thomas HD, Lau RS, Wang LC. Reporting reliability, convergent and discriminant validity with structural equation modeling: a review and best-practice recommendations. Asia Pac J Manag. 2024;41(2):745–783. doi:10.1007/s10490-023-09871-y
49. Antoniou F, Alghamdi MH. Confidence in mathematics is confounded by responses to reverse-coded items. Front Psychol. 2024;15:1489054. doi:10.3389/fpsyg.2024.1489054
50. Voormolen DC, Bom JAM, de Bekker-Grob EW, Brouwer WBF, van Exel J. Development and content validation of the 10-item well-being instrument (WiX) for use in economic evaluation studies. Appl Res Qual Life. 2024;19(2):381–413. doi:10.1007/s11482-023-10241-5
 © 2026 The Author(s). This work is published and licensed by Dove Medical Press Limited. The
full terms of this license are available at https://www.dovepress.com/terms
and incorporate the Creative Commons Attribution
- Non Commercial (unported, 4.0) License.
By accessing the work you hereby accept the Terms. Non-commercial uses of the work are permitted
without any further permission from Dove Medical Press Limited, provided the work is properly
attributed. For permission for commercial use of this work, please see paragraphs 4.2 and 5 of our Terms.
© 2026 The Author(s). This work is published and licensed by Dove Medical Press Limited. The
full terms of this license are available at https://www.dovepress.com/terms
and incorporate the Creative Commons Attribution
- Non Commercial (unported, 4.0) License.
By accessing the work you hereby accept the Terms. Non-commercial uses of the work are permitted
without any further permission from Dove Medical Press Limited, provided the work is properly
attributed. For permission for commercial use of this work, please see paragraphs 4.2 and 5 of our Terms.