Back to Journals » Clinical Interventions in Aging » Volume 21
Development and Validation of a Machine Learning Model for Predicting Serum Creatinine-Defined Acute Kidney Injury in Older Adults After Cardiac Surgery
Authors Fu Y, Qian J, Zhang Y ![]() , Ji F
, Ji F ![]()
Received 29 March 2026
Accepted for publication 4 June 2026
Published 11 June 2026 Volume 2026:21 612843
DOI https://doi.org/10.2147/CIA.S612843
Checked for plagiarism Yes
Review by Single anonymous peer review
Peer reviewer comments 2
Editor who approved publication: Dr Maddalena Illario
Yuhao Fu, Jiajie Qian, Yang Zhang, Fuhai Ji
Department of Anesthesiology, The First Affiliated Hospital of Soochow University, Suzhou, Jiangsu, 215006, People’s Republic of China
Correspondence: Fuhai Ji, Department of Anesthesiology, The First Affiliated Hospital of Soochow University, Suzhou, Jiangsu, 215006, People’s Republic of China, Email [email protected]
Background: Cardiac surgery-associated acute kidney injury (CSA-AKI) is a frequent and devastating postoperative complication, particularly among older adults. Accurate risk stratification and early prediction of CSA-AKI are essential for guiding preventive strategies and optimizing clinical decision-making.
Methods: In this retrospective study, data from two centers (n=623) were utilized for model training and internal validation, whereas data from a third, distinct center (n=110) were reserved for external validation. CSA-AKI was defined according to the Kidney Disease: Improving Global Outcomes (KDIGO) Serum creatinine criteria. Key predictors were identified using a consensus of four methods: Least Absolute Shrinkage and Selection Operator (LASSO), Recursive Feature Elimination (RFE), Boruta, and Random Forest-based filtering. Six machine learning (ML) models, including Logistic Regression (LR), K-Nearest Neighbors (KNN), Support Vector Machine (SVM), Random Forest (RF), Extreme Gradient Boosting (XGBoost), and Light Gradient Boosting Machine (LightGBM), were developed utilizing five-fold cross-validation. Predictive performance was assessed using the area under the receiver operating characteristic curve (AUC). The SHapley Additive exPlanations (SHAP) approach was applied to interpret the best-performing model.
Results: Development of CSA-AKI was noted in 177 patients (24.1%) during the first postoperative week. In terms of comparative performance, LightGBM exhibited the greatest AUC (0.784, 95% confidence interval [CI]: 0.702– 0.859). The most influential features were lactate, surgical duration, activated partial thromboplastin time (APTT), transfusion volume, and Prothrombin Time (PT). SHAP-based summary and force plots interpreted the model at global and local levels. Furthermore, SHAP dependence plots elucidated non-linear effects of single features on CSA-AKI risk.
Conclusion: Machine learning models demonstrate high efficacy in predicting CSA-AKI risk in older adults. The LightGBM model outperformed other algorithms; coupled with interpretability tools, it can assist clinicians to identify high-risk patients earlier and optimize perioperative management.
Keywords: acute kidney injury, cardiac surgery, older adults, machine learning, SHAP
Introduction
Cardiac surgery-associated acute kidney injury (CSA-AKI) is a major complication in cardiac surgery patients, with a reported incidence of 5% to 42%.1 Importantly, CSA-AKI is associated with significantly increased morbidity and mortality, prolonged length of hospital stay, and an increased risk of chronic kidney disease.2,3 Even for patients with complete renal recovery, the risk of death associated with AKI remains high for up to 10 years after cardiac surgery, regardless of other risk factors.1
Age is a key risk factor for CSA-AKI. Older adults are at higher risk due to weaker kidney function.4,5 These patients often face greater treatment challenges, higher costs, an increased requirement for dialysis, and reduced survival rates after surgery.6–8 However, current research on CSA-AKI specifically in older adults remains limited.
The pathophysiology of AKI following cardiac surgery is complex, multifactorial, and not yet fully understood. Hypoperfusion, ischaemia-reperfusion injury, neurohumoral activation, inflammation, oxidative stress, nephrotoxins, and mechanical factors are known contributing factors. All of these injury pathways can occur preoperatively, intraoperatively, and postoperatively.9 Identifying patients with modifiable risk factors for CSA-AKI may facilitate interventions to reduce their risk throughout the perioperative period. Clinical prediction models are mathematical tools designed to assist clinicians in their clinical decision-making. Logistic regression requires the statistical assumption of a linear relationship between variables and the outcome. Moreover, most previous models used this approach with variable selection based on univariate filtering or prior knowledge.10–13 However, univariate analysis may overlook potential predictors that are only significant in a multivariable context, while relying on prior knowledge may ignore novel risk factors present in the data.14,15 Therefore, it is highly important to establish a risk prediction model for CSA-AKI to identify high-risk older adults.
To analyze the multiple variables with nonlinear and complex relationships associated with CSA-AKI, a more effective approach is needed to build precise prediction models. Therefore, this study applied machine learning methods to develop a prediction model for CSA-AKI. Machine learning is widely applied in various areas of medicine, such as diagnosis, outcome prediction, medical image interpretation, and treatment.16 Additionally, to overcome the limitations of univariate filtering, we implemented an ensemble feature selection framework integrating Least Absolute Shrinkage and Selection Operator (LASSO), Recursive Feature Elimination (RFE), the Boruta algorithm, and Random Forest-based filtering (RF-filtering). By identifying the consensus across these four complementary algorithms, we ensured a robust and highly predictive variable set, effectively addressing the complex nature of CSA-AKI. Furthermore, SHapley Additive exPlanations (SHAP) analysis was employed to interpret the model, allowing for personalized risk stratification and management strategies tailored to individual patient profiles.
Method
Ethics and Reporting Guideline
This study was conducted in accordance with the Declaration of Helsinki. The reporting of this study follows the Transparent Reporting of a multivariable prediction model for Individual Prognosis Or Diagnosis statement + artificial intelligence (TRIPOD+AI) guideline14 (Table S1). This study protocol was approved by the medical ethics committee of The First Affiliated Hospital of Soochow University (ethical approval NO.2026348). The requirement for informed consent was waived due to the retrospective nature of this study. AI-assisted language editing was performed using ChatGPT, as detailed in the Declarations.
Study Population
This study included patients from 3 distinct medical centers in China. Patients who underwent surgery at the First Affiliated Hospital of Soochow University and Henan Provincial People’s Hospital between January 2013 and December 2023 were enrolled in the derivation cohort, while patients who underwent surgery at Nanfang Hospital Southern Medical University were enrolled in the validation cohort. Patients were included if they met the following criteria: age ≥65 years and undergoing first cardiac surgery between January 2013 and December 2023. Exclusion criteria included: had multiple surgeries within 7 days; had a preoperative eGFR <30 mL/min/1.73 m2; lacked the data necessary to diagnose AKI (preoperative and postoperative creatinine values); or were missing more than 30% of the medical records. Figure 1 gives the details on patient selection for the derivation and external validation cohorts.
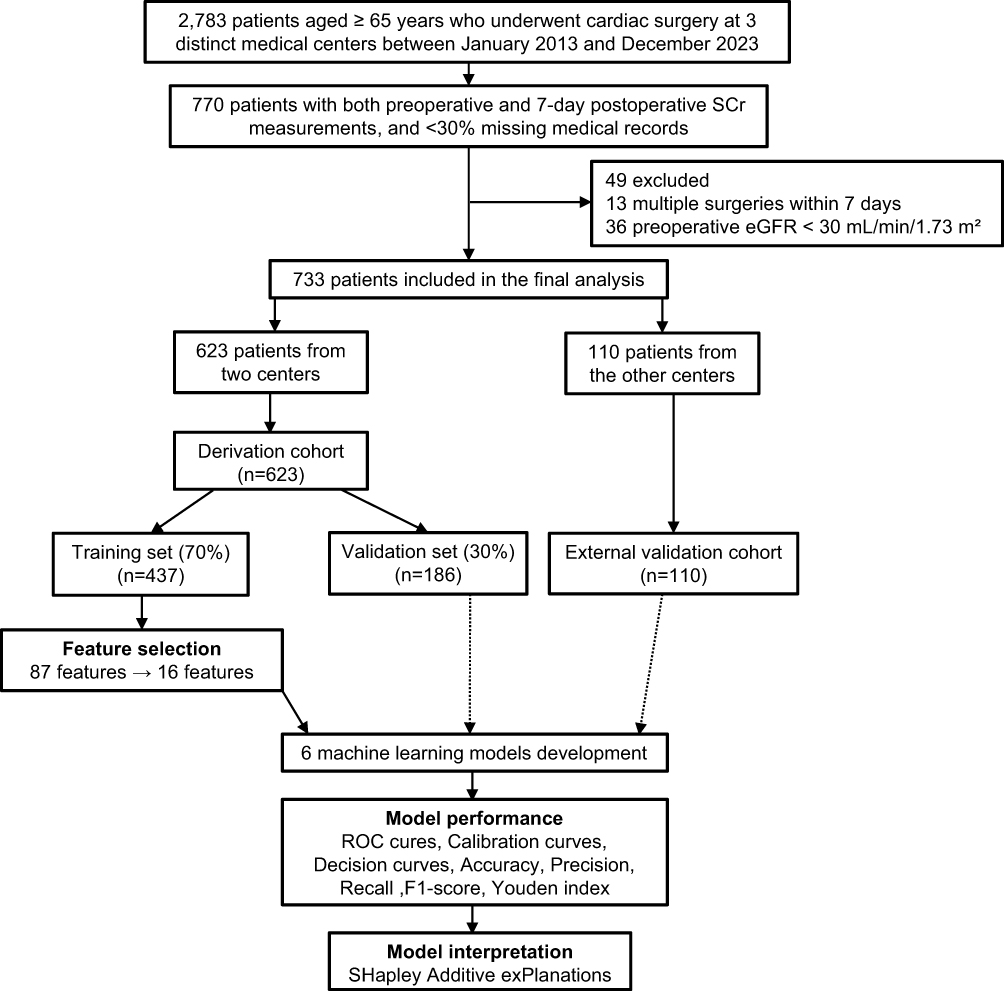 |
Figure 1 Flow diagram. Abbreviations: SCr, Serum Creatinine;eGFR, estimated Glomerular Filtration Rate. |
Data Collection and Preprocessing
Data were extracted from the “Lejiu” perioperative database and the “Madisto” intraoperative anesthesia system at all three centers. Lejiu contains records from preoperative assessment to postoperative follow-up, while Madisto captures real-time intraoperative data including minute-by-minute vital signs (blood pressure every 1–5 minutes), fluid balance, and drug use. All data were stored in a standardized format. Variables collected included demographics, baseline clinical status, surgical procedure, comorbidities, laboratory tests, concomitant medications, and intraoperative characteristics from electronic records. Demographic data included age and sex, while the preoperative clinical condition was evaluated using the American Society of Anesthesiologists (ASA) physical status classification. Surgical procedures were categorized as isolated valve or coronary artery bypass grafting(CABG) surgery, versus combined CABG + valve and other cardiac procedures.17 Comorbidities, such as hypertension, diabetes, coronary heart disease, and heart failure, were identified from admission and preoperative diagnoses. Preoperative laboratory variables encompassed renal function parameters (including preoperative creatinine, urea, cystatin C, and estimated glomerular filtration rate [eGFR]), liver function, electrolytes, coagulation profiles, arterial blood gas analysis, and complete blood counts with derived inflammatory indices (such as NLR, PLR, and SII). Baseline laboratory variables were defined as the most recent measurements within 7 days prior to surgery. Information regarding concomitant medications was divided into preoperative long-term medications (such as insulin, ACE inhibitors and ARBs) and intraoperative pharmacological management, which detailed the administration of vasoactive agents, anesthetics, muscle relaxants, and glucocorticoids. Finally, intraoperative data extracted from surgical and anesthesia records included surgical duration, invasive monitoring techniques, comprehensive fluid and transfusion management (detailing total fluid input and output, blood loss, crystalloid/colloid volumes, and specific blood product usage), as well as the duration of specific intraoperative physiological events such as hypotension, hypothermia, low SpO2, and tachycardia. Due to the unpredictable duration of drug effects across different patients and conditions, medication administration was treated as a discrete event. Each drug was encoded as a binary variable, set to 1 only in the time interval immediately following its administration. Variables with >15% missing data were excluded. Continuous variables were normalized prior to modeling to ensure comparability across different units of measurement. Missing data was found in 15 of the 87 variables. The percentage of missing data varied from 0.68% to 14.73%. Missing data were imputed by the random forest method using the missForest package in R.18 Data types and missing value statistics are listed in Table S2.
Outcome Measures
The outcome was the development of CSA-AKI, which was determined according to the 2012 Kidney Disease: Improving Global Outcomes (KDIGO) creatinine criteria.19 Specifically, it was determined by a serum creatinine (SCr) increase of 0.3 mg/dl (26.5 μmol/l) within 48 h or 1.5 times the baseline level within 7 days after surgery. Perioperative urine output was excluded from renal function evaluation due to data unavailability. Baseline renal function was assessed using SCr levels measured within 7 days preoperatively. To evaluate CSA-AKI, we extracted the SCr measurement taken within 7 days following surgery.
Feature Selection
To ensure model robustness, predictor variables with near-zero variance, defined as having less than 5% unique values, were initially excluded from the analysis. Subsequently, four distinct feature selection methods were employed within the training set to derive optimal predictor subsets for further model development. These methods included the Least Absolute Shrinkage and Selection Operator (LASSO), Random Forest-based filtering (RF-filtering), Random Forest-Recursive Feature Elimination (RF-RFE), and the Boruta algorithm.
LASSO applies an L1 regularization penalty to shrink the coefficients of less contributory or highly collinear variables exactly to zero. It is highly effective in handling high-dimensional data and multicollinearity, ultimately yielding a sparse and clinically interpretable model.20 RF-filtering directly ranks and screens variables based on feature importance scores derived from a single trained random forest model. It is computationally efficient, makes no assumptions about data distribution, and rapidly captures non-linear relationships between variables and outcomes.21 RF-RFE repeatedly trains random forest models, evaluates feature importance, and eliminates the lowest-ranking features in each iteration until the optimal subset is identified. By dynamically reassessing feature weights, it precisely accounts for complex dependencies and interactions, isolating a concise yet highly predictive combination of variables.22 Boruta introduces randomized “shadow features” and statistically compares their importance scores against the original features to confirm truly effective predictors. With a rigorous statistical foundation, Boruta is able to identify all-relevant features rather than just a minimal optimal subset.23
To comprehensively evaluate the results, a consensus voting mechanism was applied: only predictor variables identified by at least three of the four methods were ultimately selected for final model construction. All feature selection procedures were performed in R using the glmnet, Boruta, randomForest, and caret packages.
Model Development
The derivation set was randomly divided, 70% of the dataset was allocated to the train set, and 30% of the dataset was allocated to the test set. Six machine learning algorithms were employed for model development, including Logistic Regression (LR), valued for its high interpretability and status as a traditional benchmark in clinical research; K-Nearest Neighbors (KNN), a non-parametric method capable of capturing local data structures; Support Vector Machine (SVM), known for its robustness in modeling complex, non-linear decision boundaries; Random Forest (RF), an ensemble approach that effectively manages non-linear relationships while mitigating the risk of overfitting; Extreme Gradient Boosting (XGBoost), recognized for its advanced regularization techniques and high predictive accuracy; and Light Gradient Boosting Machine (LightGBM), favored for its superior computational efficiency and excellent performance on tabular data. To optimize model performance, a grid search strategy paired with 5-fold cross-validation was implemented. Through this iterative evaluation process, the optimal hyperparameter combination for each algorithm was selected to maximize the area under the receiver operating characteristic curve (AUC).
Model Performance and Interpretation
The established models were evaluated in the test set and validated in the validation cohort. Overall model performance was measured using accuracy, precision, recall, F1-score, Youden index, and the AUC. Discriminative ability was quantified by AUC with 95% confidence intervals (CIs), where higher values indicate superior discrimination. Model calibration was evaluated via calibration curves, with closer alignment to the diagonal line reflecting better predictive accuracy. Finally, decision curve analysis (DCA) was performed to determine clinical utility. A curve situated further from the extreme reference lines demonstrates a greater clinical net benefit across various threshold probabilities.
Based on cooperative game theory, SHAP analysis uses exact Shapley values to measure each feature’s contribution to individual predictions. By evaluating both main feature impacts and complex interaction effects, SHAP ensures consistent and locally accurate explanations for the model’s decisions. Ultimately, combining these local SHAP values facilitates a comprehensive understanding of the machine learning model’s behavior, significantly improving its transparency and interpretability from both global and local perspectives.24 This study utilized SHAP beeswarm plots for global interpretation, while force plots elucidated individual predictions. Additionally, SHAP dependence plots were used to illustrate feature effects and their interactions.
Statistical Analysis
In this study, continuous variables were not normally distributed, as determined by the Shapiro–Wilk test. Therefore, they were expressed as median [interquartile range (IQR)]. Categorical variables were expressed as counts (percentages). The analysis of continuous variables used the Mann–Whitney U-test or Kruskal–Wallis test. Categorical variables were evaluated using the chi-square test or Fisher exact test. All P-values were 2-tailed, and a P-value of <0.05 was considered statistically significant. The statistical analysis was conducted using R4.5.2.
Results
Patient Characteristics
A total of 733 participants were enrolled in this study, that is, 623 in the derivation cohort and 110 in the external validation cohort. The baseline characteristics and outcomes of the patients in the derivation and external validation cohorts are shown in Table 1. Baseline characteristics were well-balanced between the two groups In the derivation cohort, 150 (24%) patients developed CSA-AKI. In the external validation cohort, 27 (25%) patients developed CSA-AKI. Baseline characteristics of patients with and without AKI in the derivation and external validation cohorts are summarized in the Supplementary Tables S3–S5.
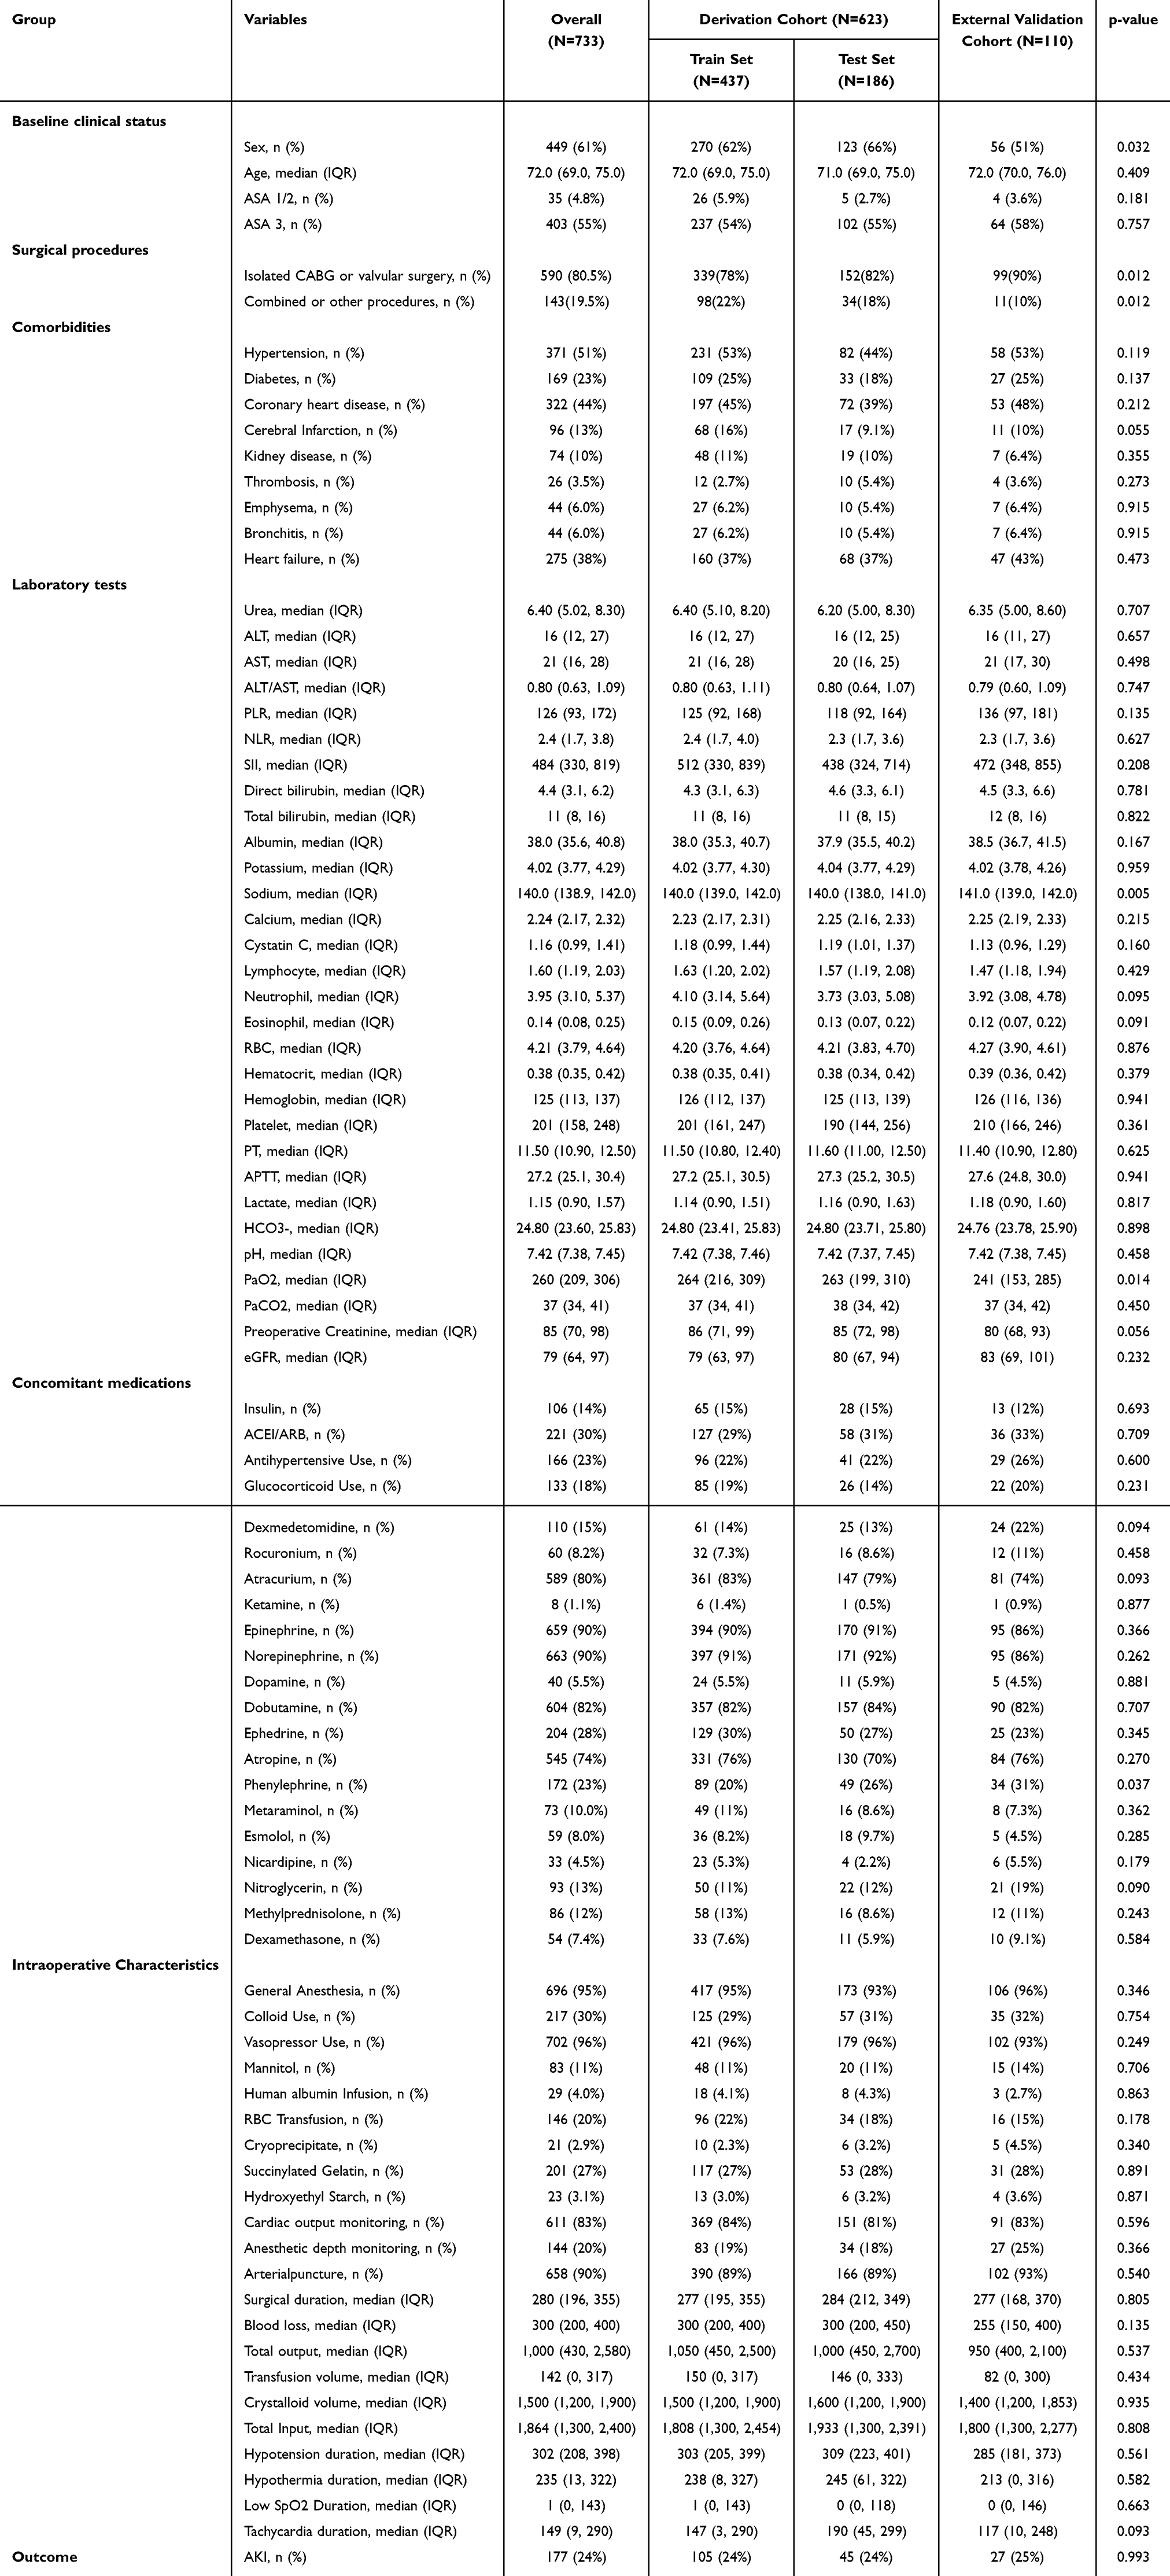 |
Table 1 Baseline Characteristics and Outcomes of the Patients |
Predictor Variables
To identify the most robust predictors for CSA-AKI, we employed a comprehensive feature selection strategy integrating four algorithms to minimize overfitting and handle multi-collinearity among variables. First, LASSO regression was performed; the optimal penalty parameter (λ) was determined through 10-fold cross-validation, selecting variables with non-zero coefficients at the minimum deviance (Figure 2A and B). Simultaneously, the Boruta algorithm was utilized to rank feature importance by comparing original attributes with shadow features (Figure 2C and D), while RF-Filtering and Recursive Feature Elimination (RFE) were applied to further evaluate the contribution of each variable to model accuracy and Gini impurity (Figure 2E and F). By taking the intersection of the top-performing features across these four algorithms (Figure 2G), we effectively narrowed down the potential predictors. Ultimately, the following 16 key variables were identified and incorporated into the final predictive model: surgical duration, blood Loss, transfusion volume, total Input, tachycardia duration, hypotension duration, hypothermia duration, NLR (Neutrophil-to-Lymphocyte Ratio), lactate, ALT, AST, ALT/AST ratio, PT, APTT, kidney disease, and RBC count.
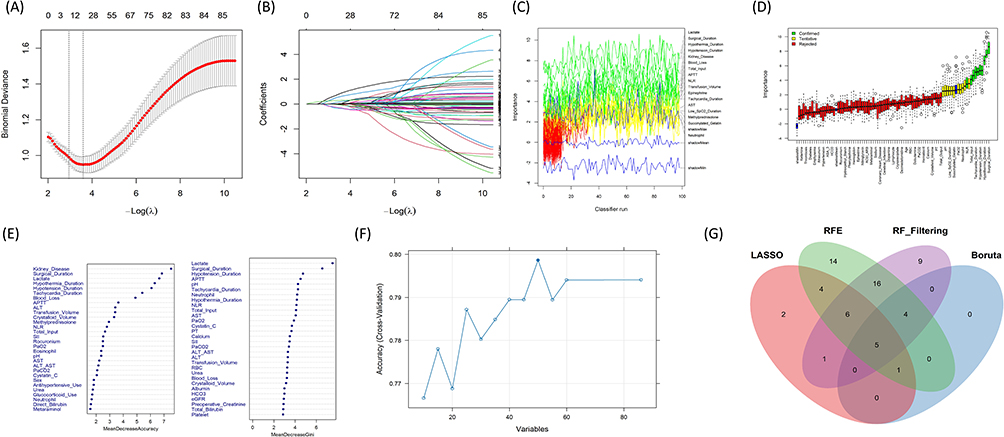 |
Figure 2 Feature selection (A) LASSO regression cross-validation curve. The horizontal axis represents log(λ), and the vertical axis represents the binomial deviance. The two vertical dotted lines indicate the optimal values of the penalty parameter (λ). (B) LASSO coefficient profile plot. The horizontal axis represents log(λ), showing the coefficient trajectories of each variable as the penalty increases. (C) Boruta algorithm importance history plot. It tracks the fluctuations in the importance of variables during continuous classifier runs. (D) Feature selection based on the Boruta algorithm. The horizontal axis is the name of each variable, and the vertical axis is the importance (Z value). The green boxes represent important (confirmed) variables, the yellow boxes represent tentative variables, the red boxes represent unimportant (rejected) variables, and the blue boxes represent shadow variables used as reference. (E) Random Forest variable importance plot. The variables are ranked according to the Mean Decrease Accuracy (left) and Mean Decrease Gini (right). (F) Recursive Feature Elimination (RFE) model performance plot. The horizontal axis shows the number of variables, and the vertical axis represents the model’s cross-validation accuracy. (G) A Venn diagram showing the intersection of the core variables selected by the four different algorithms (LASSO, RFE, RF Filtering, and Boruta). |
Model Performance
Among all machine learning models, the LightGBM model demonstrated the best overall performance in both derivation and external validation cohorts. In the test set, the LightGBM model achieved the highest AUC of 0.784 (95% CI: 0.702–0.859) (Figure 3A). It also showed the highest F1-score (0.584) and Youden Index (0.485) (Table 2). In the external validation, the model remained robust with an AUC of 0.719 (95% CI: 0.625–0.812) (Figure S1A), an F1-score of 0.529, and a Youden Index of 0.422 (Table 3), indicating a good ability to identify patients at high risk for AKI. In comparison, the traditional Logistic Regression model showed lower AUC of 0.775 and 0.710 in the two datasets, respectively. The calibration curves showed that the LightGBM model was well-calibrated (Figure S1B). In the validation set, the model’s predicted risks were closely aligned with the actual observed outcomes, as the smooth curve followed the 45-degree diagonal line (Figure 3B). Decision Curve Analysis (DCA) confirmed the clinical utility of the LightGBM model. Within a wide range of threshold probabilities (approximately 0.1 to 0.5), the LightGBM model provided a higher “Net Benefit” than both the “Treat All” and “Treat None” strategies. Furthermore, LightGBM outperformed other models like XGBoost and KNN in the most common clinical decision-making ranges, suggesting it is the most effective tool for supporting clinical decisions regarding AKI risk (Figures 3C and S1C).
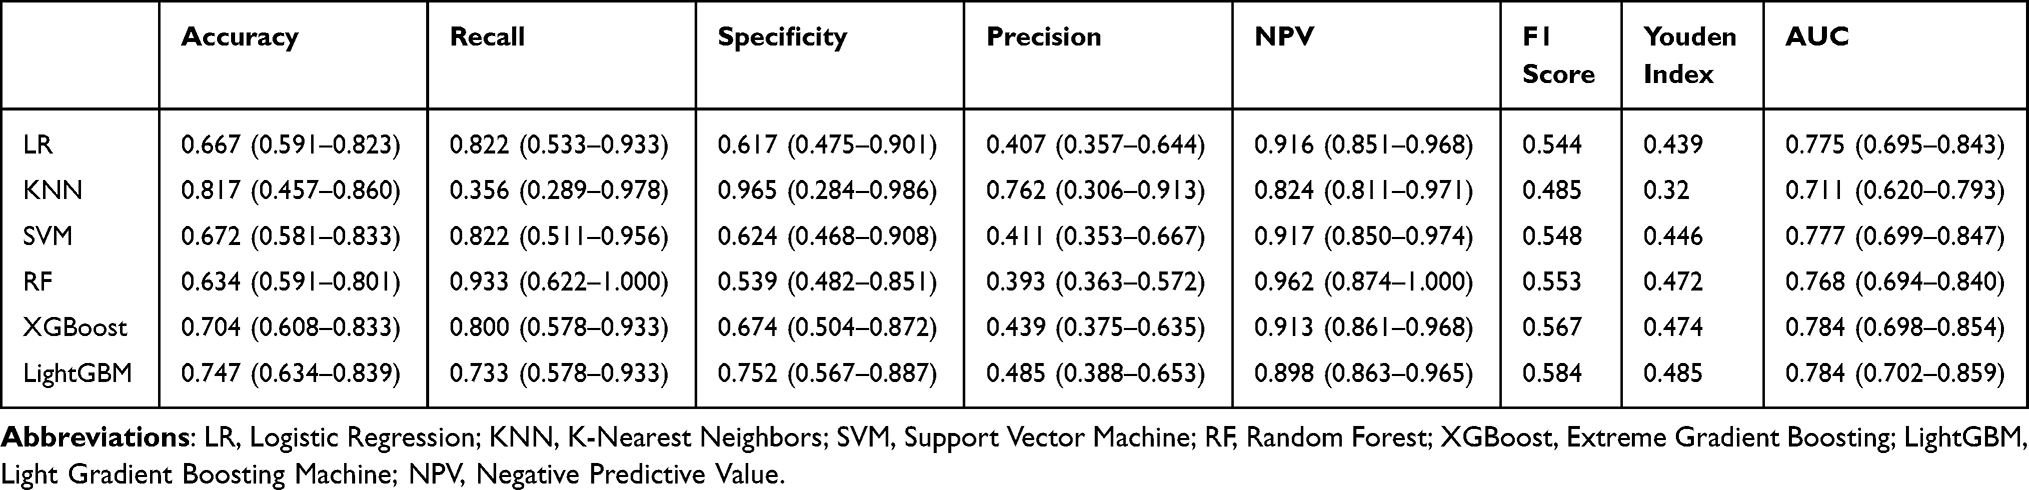 |
Table 2 Model Performance on the Internal Validation Set |
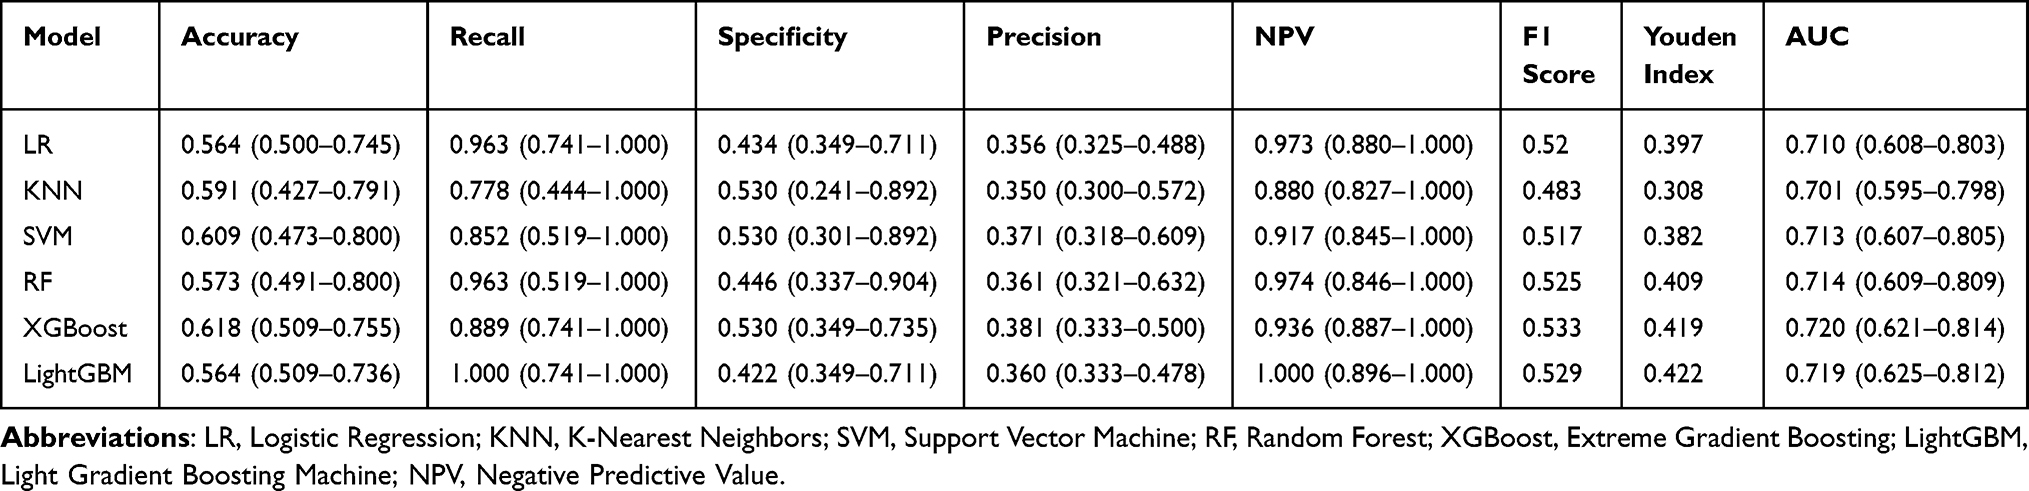 |
Table 3 Model Performance on the External Validation Set |
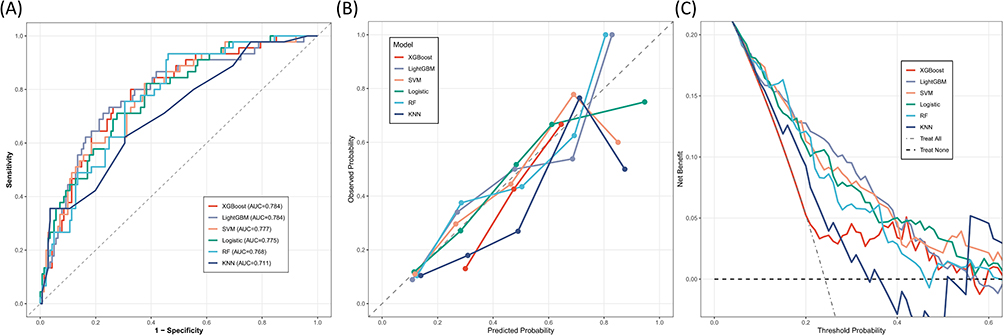 |
Figure 3 (A) Receiver Operating Characteristic (ROC) Curves. The AUC for each model is provided in the legend, with LightGBM and XGBoost achieving the highest AUC (0.784), indicating superior discriminative ability for AKI risk. (B) Calibration Curves. The curves illustrate the agreement between the predicted probabilities (x-axis) and the actual observed outcomes (y-axis). The dashed 45-degree diagonal line represents a perfect calibration. Models closer to this line, demonstrate better reliability in risk estimation. (C) Decision Curve Analysis (DCA). The decision curves evaluate the clinical utility of the models by calculating the net benefit across a range of threshold probabilities. |
Model Interpretations
To understand how different features affect our LightGBM model, we used SHAP analysis. Figure 4A and B show the importance of the top 10 variables, where lactate, surgical duration, APTT, transfusion volume, and PT are the most important factors. In Figure 4A, each dot represents one patient; yellow dots show high values and purple dots show low values. A SHAP value greater than zero on the horizontal axis means a higher risk of AKI. To show the specific relationship between these features and AKI, we drew dependence plots for the top eight variables in Figure 5. Our results show that higher levels of lactate, longer surgical duration, and increased blood loss are all clearly linked to a higher risk of AKI. We also found that when APTT and PT increase beyond a certain point, the risk of AKI rises very quickly. Similarly, a larger transfusion volume and a higher NLR also lead to an increased risk of AKI. In contrast, RBC count shows an opposite pattern, as lower red blood cell levels are associated with a higher risk while higher levels appear to be protective. Finally, we used waterfall plots to show how the model explains individual cases. In Figure 4C, for an AKI-negative case, factors like low lactate and short surgical duration work together to lower the predicted risk. However, in Figure 4D for an AKI-positive case, the strong negative effects of high lactate and long surgical duration overcome other factors and result in a high-risk prediction for that patient.
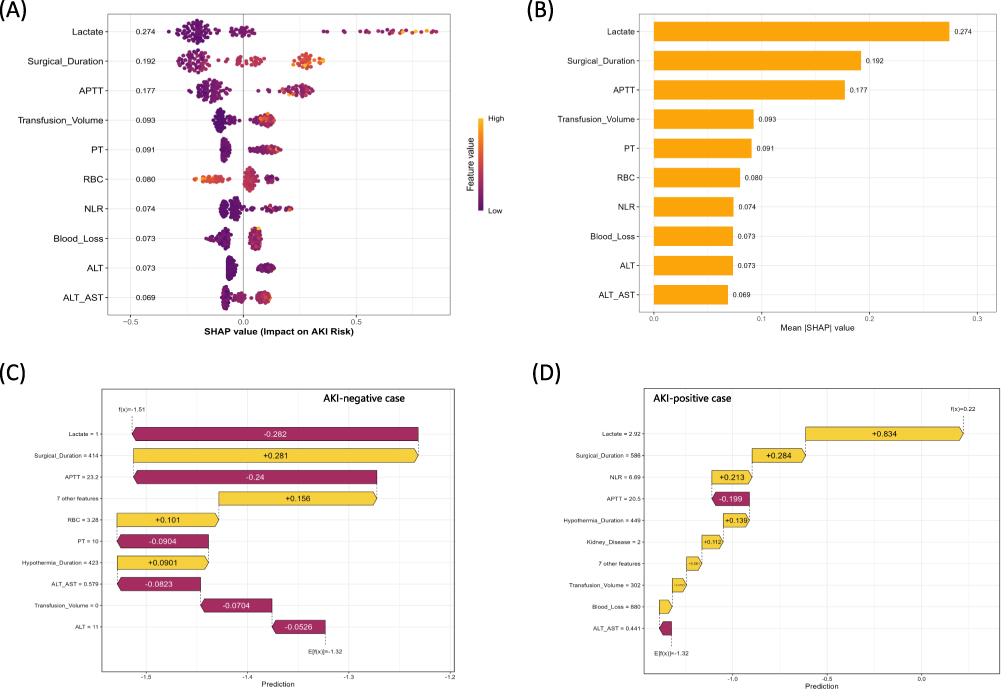 |
Figure 4 Interpretation of the LightGBM model using SHAP analysis. (A) SHAP Beeswarm Plot. The plot displays the top 10 features ranked by their importance. Each dot represents an individual patient in the validation cohort. The color indicates the feature value (yellow for high, purple for low). A positive SHAP value (x-axis) indicates an increased risk of postoperative AKI, while a negative value indicates a decreased risk. (B) Global Feature Importance. Features are ranked from top to bottom based on their mean absolute SHAP values, representing the average impact of each variable on the model’s output magnitude. (C) Local Explanation for an AKI-negative Case. The waterfall plot illustrates the contribution of each feature to the final prediction for a specific patient who did not develop AKI. The base value E[f(x)] represents the average predicted risk, and each bar shows how specific feature values (e.g., low Lactate) push the final prediction f(x) towards a lower risk score. (D) Local Explanation for an AKI-positive Case. This plot shows the feature contributions for a patient who developed AKI. In this case, high Lactate (+0.834) and increased Surgical Duration (+0.284) significantly pushed the prediction towards a higher risk, overriding protective factors and resulting in a higher final prediction value f(x). Abbreviations: AKI, acute kidney injury; ALT, alanine aminotransferase; APTT, activated partial thromboplastin time; NLR, neutrophil-to-lymphocyte ratio; PT, prothrombin time; RBC, red blood cell; SHAP, SHapley Additive exPlanations. LightGBM, Light Gradient Boosting Machine. |
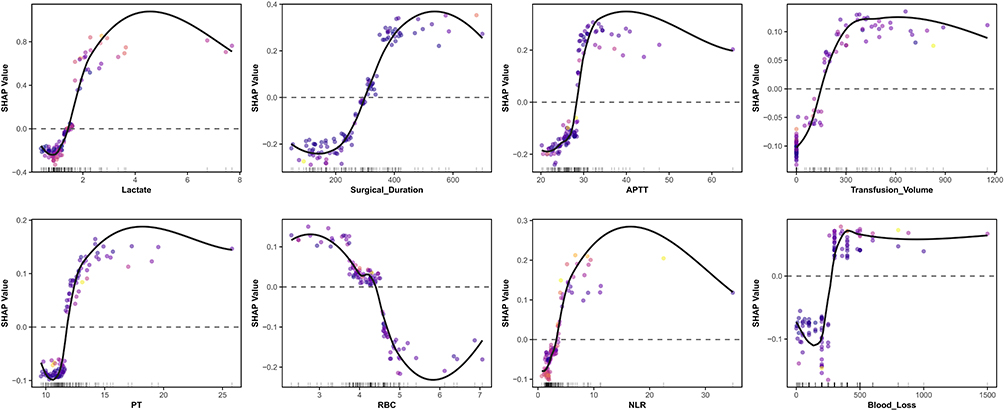 |
Figure 5 SHAP Dependence Plots. The plots show the non-linear relationship between the top 8 continuous predictors and their corresponding SHAP values. The x-axis represents the actual value of the feature, and the y-axis represents the impact on AKI risk. Solid black lines indicate LOESS smoothed trends, and dashed horizontal lines represent the SHAP zero baseline. Abbreviations: APTT, activated partial thromboplastin time; NLR, neutrophil-to-lymphocyte ratio; PT, prothrombin time; RBC, red blood cell; SHAP, SHapley Additive exPlanations. |
Discussion
In this study, we developed and externally validated machine learning models specifically designed to predict CSA-AKI in older adults aged 65 and older. Among the tested algorithms, LightGBM demonstrated the best performance, as it effectively captures the complex, non-linear relationships inherent in the perioperative data of older adults. To ensure the identified predictors were both accurate and comprehensive, we implemented an ensemble feature selection framework integrating four complementary methods: LASSO, RFE, Boruta, and RF-filtering. This approach overcomes the limitations of traditional univariate filtering, which often misses subtle but critical risk factors that only appear significant in a multi-variable context. By integrating visual SHAP analysis, our machine learning model becomes transparent and interpretable, allowing clinicians to see the key factors driving each patient’s risk. This makes the model a practical tool that helps doctors accurately identify high-risk individuals and make better decisions, ultimately reducing the occurrence of CSA-AKI in older adults.
Our findings show some inconsistencies with previous reports,25–28 suggesting that CSA-AKI risk is driven by a complex interplay of factors rather than single variables. In older adults, these risk factors mainly involve metabolic shifts, impaired oxygen delivery, systemic inflammation, and coagulation dysfunction. Lactate is a byproduct of anaerobic metabolism. In cardiac surgery, elevated lactate levels typically reflect systemic or regional tissue hypoperfusion.29 In older adults, renal tubular cells are highly sensitive to hypoxia. Persistent hyperlactatemia signals impaired renal microcirculation, leading to cellular metabolic dysfunction.30 Prolonged surgical duration implies extended exposure to anesthesia, surgical trauma, and cardiopulmonary bypass. Longer procedures trigger more severe systemic inflammatory response syndrome and oxidative stress, increasing the likelihood of hemodynamic instability in the kidneys.31 Red blood cells (RBCs) are the primary carriers for oxygen transport. A lower RBC count significantly reduces oxygen delivery to the renal medulla.32 Since the renal medulla already functions in a low-oxygen environment, a reduction in RBCs can surpass the hypoxia threshold, leading to tubular epithelial cell necrosis.33,34 Significant blood loss directly leads to a reduction in effective circulating blood volume, triggering the renin-angiotensin-aldosterone system. This causes intense renal vasoconstriction to maintain blood pressure, sacrificing renal cortical perfusion as a compensatory mechanism.35 While transfusion restores volume, excessive transfusion can lead to transfusion-related immunomodulation and the release of inflammatory mediators.36 In older adults with limited cardiac reserve, fluid overload causes renal venous congestion, increasing intra-renal pressure and subsequently reducing the glomerular filtration rate.37,38 The NLR reflects the balance between innate immunity and adaptive immunity.39 A high NLR represents a strong pro-inflammatory state. Proteases and reactive oxygen species released by neutrophils directly damage renal endothelial cells, mediating the immune-related mechanisms of CSA-AKI.40 APTT and PT reflect the intrinsic and extrinsic coagulation pathways. Prolonged values indicate consumption or dysfunction of clotting factors. At the renal level, abnormal coagulation can exacerbate kidney injury through microthrombi formation or severe hypotension caused by massive intraoperative hemorrhage.41,42
Our findings offer important clinical implications for preventing CSA-AKI through a comprehensive management plan. Specifically, we recommend a risk-stratified approach to guide patient care. While low-risk patients require only standard care and routine monitoring, moderate-risk individuals necessitate enhanced renal function assessment. High-risk patients, however, should undergo multidisciplinary evaluation to devise tailored care protocols that span the full surgical trajectory: from preoperative optimization and intraoperative nephroprotection to contingency planning for early postoperative renal replacement therapy. Furthermore, clinicians should assess the NLR, correct anemia, and optimize surgical planning as part of careful preoperative preparation. During surgery, it is vital to manage high lactate levels and significant blood loss, as these are strong predictors of AKI. We suggest implementing goal-directed fluid therapy and a restrictive fluid strategy to avoid fluid overload. Together with rigorous coagulation control, these measures form an optimal intraoperative protocol for this vulnerable older adults population. The clinical value of this research is supported by several key factors. First, we focused specifically on older adults. This group has a higher risk of CSA-AKI. Second, our model uses a refined panel of routine clinical variables. It does not add extra laboratory tests or financial burdens. Third, we used SHAP to explain our LightGBM model. This turned a complex model into a transparent tool. It helped us identify modifiable risk factors so the care team can take early action to prevent AKI.
This study has some limitations. First, as a retrospective study conducted in Chinese centers with a modest sample size, our findings may not be generalizable to other ethnicities or healthcare systems. Genetic factors, dietary habits, and perioperative management protocols vary across populations. Larger multicenter studies in diverse populations are therefore needed to confirm model stability and external validity. Second, our model relied on routine electronic medical record data, which lacked several potentially important variables. Comprehensive geriatric assessment was not systematically recorded in our database. Such assessments may significantly modify AKI risk in older adults. Measured creatinine clearance was unavailable due to the absence of body weight data and standardized 24-hour urine collections. We used eGFR instead, which may be influenced by age-related muscle loss. Nephrotoxin exposure was not systematically documented in perioperative records. These agents include aminoglycosides, Nonsteroidal Antiinflammatory Drugs (NSAIDs), and contrast agents. Their absence represents a source of unmeasured confounding. Surgical urgency was not reliably classified across the three centers. We partially mitigated this limitation by including surgical procedure type and comprehensive intraoperative physiological data. Baseline echocardiography findings and NYHA classification were inconsistently available. We included heart failure as a binary comorbidity variable to reduce information bias. Adding these variables in future research might improve the predictive accuracy of the model. We intend to initiate a prospective cohort study to confirm the predictive value of these risk factors for AKI. Finally, our definition of AKI did not include urine output. We only used serum creatinine levels to define AKI. While this may lead to a slight underestimation of AKI incidence according to KDIGO criteria, serum creatinine remains the most consistently recorded and reliable marker in retrospective studies. Previous studies have similarly prioritized creatinine due to the high noise and missingness associated with hourly urine output records.43–45 Future prospective studies with complete urine output monitoring are warranted to validate our model’s performance using the full KDIGO criteria.
Conclusion
In conclusion, we developed and externally validated a LightGBM-based machine learning model to predict CSA-AKI in older adults using routinely available preoperative and intraoperative variables. The model demonstrated superior predictive performance and interpretability, offering clinicians an objective tool for early risk identification. However, as a retrospective study in Chinese centers with a modest sample size, our findings require validation in more diverse populations. Future prospective studies incorporating more comprehensive clinical data are warranted to enhance generalizability and predictive accuracy.
Declaration of Generative AI and AI-Assisted Technologies in the Writing Process
During the preparation of this work the authors used ChatGPT in order to improve language. After using this tool, the authors reviewed and edited the content as needed and take full responsibility for the content of the publication.
Data Sharing Statement
The data used in this study were collected from the “Lejiu” and “Madisto” systems at all three centers by F.Y.H. and Q.J.J. Any discrepancies in the data were resolved with input and final decisions made by the senior author, J.F.H. The data that support the findings of this study are from the corresponding author upon reasonable request.
Author Contributions
All authors made a significant contribution to the work reported, whether that is in the conception, study design, execution, acquisition of data, analysis and interpretation, or in all these areas; took part in drafting, revising or critically reviewing the article; gave final approval of the version to be published; have agreed on the journal to which the article has been submitted; and agree to be accountable for all aspects of the work.
Funding
This research received no funding.
Disclosure
The authors declare that they have no conflicts of interest with this work.
References
1. Hobson CE, Yavas S, Segal MS, et al. Acute kidney injury is associated with increased long-term mortality after cardiothoracic surgery. Circulation. 2009;119:2444–14. doi:10.1161/CIRCULATIONAHA.108.800011
2. Chertow GM, Burdick E, Honour M, et al. Acute kidney injury, mortality, length of stay, and costs in hospitalized patients. J Am Soc Nephrol. 2005;16:3365–3370. doi:10.1681/ASN.2004090740
3. Zhang T, Widdop RE, Ricardo SD. Transition from acute kidney injury to chronic kidney disease: mechanisms, models, and biomarkers. Am J Physiol Renal Physiol. 2024;327:F788–F805. doi:10.1152/ajprenal.00184.2024
4. Evans M, Lewis RD, Morgan AR, et al. A narrative review of chronic kidney disease in clinical practice: current challenges and future perspectives. Adv Ther. 2022;39:33–43. doi:10.1007/s12325-021-01927-z
5. Li Y, Hou X-J, Liu T-S, et al. Risk factors for acute kidney injury following coronary artery bypass graft surgery in a Chinese population and development of a prediction model. J Geriatr Cardiol. 2021;18:711–719. doi:10.11909/j.issn.1671-5411.2021.09.011
6. Kellum JA, Romagnani P, Ashuntantang G, et al. Acute kidney injury. Nat Rev Dis Primers. 2021;7:52. doi:10.1038/s41572-021-00284-z
7. Chang-Panesso M. Acute kidney injury and aging. Pediatr Nephrol. 2021;36:2997–3006. doi:10.1007/s00467-020-04849-0
8. Sato Y, Takahashi M, Yanagita M. Pathophysiology of AKI to CKD progression. Semin Nephrol. 2020;40:206–215. doi:10.1016/j.semnephrol.2020.01.011
9. Wang Y, Bellomo R. Cardiac surgery-associated acute kidney injury: risk factors, pathophysiology and treatment. Nat Rev Nephrol. 2017;13:697–711. doi:10.1038/nrneph.2017.119
10. Husain-Syed F, Quattrone MG, Ferrari F, et al. Clinical and operative determinants of acute kidney injury after cardiac surgery. Cardiorenal Med. 2020;10:340–352. doi:10.1159/000507777
11. Jiang W, Teng J, Xu J, et al. Dynamic predictive scores for cardiac surgery-associated acute kidney injury. J Am Heart Assoc. 2016;5:e003754. doi:10.1161/JAHA.116.003754
12. Chen M, Zhao S, Chen P, et al. A novel predictive model for acute kidney injury following surgery of the aorta. Rev Cardiovasc Med. 2024;25:54. doi:10.31083/j.rcm2502054
13. Qiu H, Zhu Y, Shen G, et al. A predictive model for contrast-induced acute kidney injury after percutaneous coronary intervention in elderly patients with ST-Segment elevation myocardial infarction. Clin Interv Aging. 2023;18:453–465. doi:10.2147/CIA.S402408
14. Collins GS, Moons KGM, Dhiman P, et al. TRIPOD+AI statement: updated guidance for reporting clinical prediction models that use regression or machine learning methods. BMJ. 2024;385:e078378. doi:10.1136/bmj-2023-078378
15. Heinze G, Wallisch C, Dunkler D. Variable selection – a review and recommendations for the practicing statistician. Biom J. 2018;60:431–449. doi:10.1002/bimj.201700067
16. Rajkomar A, Dean J, Kohane I. Machine learning in medicine. N Engl J Med. 2019;380:1347–1358. doi:10.1056/NEJMra1814259
17. Thakar CV, Arrigain S, Worley S, et al. A clinical score to predict acute renal failure after cardiac surgery. J Am Soc Nephrol. 2005;16:162–168. doi:10.1681/ASN.2004040331
18. Stekhoven DJ, Bühlmann P. MissForest--non-parametric missing value imputation for mixed-type data. Bioinformatics. 2012;28:112–118. doi:10.1093/bioinformatics/btr597
19. Lameire NH, Levin A, Kellum JA, et al. Harmonizing acute and chronic kidney disease definition and classification: report of a Kidney Disease: improving Global Outcomes (KDIGO) consensus conference. Kidney Int. 2021;100:516–526. doi:10.1016/j.kint.2021.06.028
20. Tibshirani R. Regression shrinkage and selection via the lasso. J Royal Stat Soc Series B. 1996;58:267–288. doi:10.1111/j.2517-6161.1996.tb02080.x
21. Breiman L. Random forests. Machine Learning. 2001;45:5–32. doi:10.1023/A:1010933404324
22. Díaz-Uriarte R, Alvarez de Andrés S. Gene selection and classification of microarray data using random forest. BMC Bioinf. 2006;7:3. doi:10.1186/1471-2105-7-3
23. Kursa MB, Rudnicki WR. Feature selection with the boruta package. J Statist Soft. 2010;36:1–13. doi:10.18637/jss.v036.i11
24. Lundberg SM, Erion G, Chen H, et al. From local explanations to global understanding with explainable AI for trees. Nat Mach Intell. 2020;2:56–67. doi:10.1038/s42256-019-0138-9
25. Li Y, Xu J, Wang Y, et al. A novel machine learning algorithm, Bayesian networks model, to predict the high-risk patients with cardiac surgery-associated acute kidney injury. Clin Cardiol. 2020;43:752–761. doi:10.1002/clc.23377
26. Penny-Dimri JC, Bergmeir C, Reid CM, et al. Machine learning algorithms for predicting and risk profiling of cardiac surgery-associated acute kidney injury. Semin Thorac Cardiovasc Surg. 2021;33:735–745. doi:10.1053/j.semtcvs.2020.09.028
27. Tseng P-Y, Chen Y-T, Wang C-H, et al. Prediction of the development of acute kidney injury following cardiac surgery by machine learning. Crit Care. 2020;24:478. doi:10.1186/s13054-020-03179-9
28. Lee H-C, Yoon H-K, Nam K, et al. Derivation and validation of machine learning approaches to predict acute kidney injury after cardiac surgery. J Clin Med. 2018;7:322. doi:10.3390/jcm7100322
29. Chen DX, Zhang YY, Xiong XL, et al. Association between intraoperative lactate levels and acute kidney injury after on-pump cardiac surgery: a retrospective cohort study across two centers. BMC Surg. 2025;25:324. doi:10.1186/s12893-025-03082-6
30. Haas SA, Lange T, Saugel B, et al. Severe hyperlactatemia, lactate clearance and mortality in unselected critically ill patients. Intensive Care Med. 2016;42:202–210. doi:10.1007/s00134-015-4127-0
31. Wu B, Ma L, Shao Y, et al. Effect of cardiac surgery-associated acute kidney injury on long-term outcomes of Chinese patients: a Historical Cohort Study. Blood Purif. 2017;44:227–233. doi:10.1159/000478967
32. Darby PJ, Kim N, Hare GMT, et al. Anemia increases the risk of renal cortical and medullary hypoxia during cardiopulmonary bypass. Perfusion. 2013;28:504–511. doi:10.1177/0267659113490219
33. Chin K, Joo H, Jiang H, et al. Importance of assessing biomarkers and physiological parameters of anemia-induced tissue hypoxia in the perioperative period. Braz J Anesthesiol. 2023;73:186–197. doi:10.1016/j.bjane.2022.10.004
34. Zhu MZL, Martin A, Cochrane AD, et al. Urinary hypoxia: an intraoperative marker of risk of cardiac surgery-associated acute kidney injury. Nephrol Dial Transplant. 2018;33:2191–2201. doi:10.1093/ndt/gfy047
35. Gupta S, Mandal S, Banerjee K, et al. Complex Pathophysiology of Acute Kidney Injury (AKI) in aging: epigenetic regulation, matrix remodeling, and the healing effects of H2S. Biomolecules. 2024;14:1165. doi:10.3390/biom14091165
36. Youssef LA, Spitalnik SL. Transfusion-related immunomodulation: a reappraisal. Curr Opin Hematol. 2017;24:551–557. doi:10.1097/MOH.0000000000000376
37. Moore PK, Hsu RK, Liu KD. Management of acute kidney injury: core curriculum 2018. Am J Kidney Dis. 2018;72:136–148. doi:10.1053/j.ajkd.2017.11.021
38. Messina A, Calatroni M, Castellani G, et al. Understanding fluid dynamics and renal perfusion in acute kidney injury management. J Clin Monit Comput. 2025;39:73–83. doi:10.1007/s10877-024-01209-3
39. Islam MM, Satici MO, Eroglu SE. Unraveling the clinical significance and prognostic value of the neutrophil-to-lymphocyte ratio, platelet-to-lymphocyte ratio, systemic immune-inflammation index, systemic inflammation response index, and delta neutrophil index: an extensive literature review. Turk J Emerg Med. 2024;24:8–19. doi:10.4103/tjem.tjem_198_23
40. Su L, Zhang J, Gomez H, et al. Mitochondria ROS and mitophagy in acute kidney injury. Autophagy. 2023;19:401–414. doi:10.1080/15548627.2022.2084862
41. Tuuminen R, Jouppila A, Salvail D, et al. Dual antiplatelet and anticoagulant APAC prevents experimental ischemia-reperfusion-induced acute kidney injury. Clin Exp Nephrol. 2017;21:436–445. doi:10.1007/s10157-016-1308-2
42. Molema G, Zijlstra JG, Van Meurs M, et al. Renal microvascular endothelial cell responses in sepsis-induced acute kidney injury. Nat Rev Nephrol. 2022;18:95–112. doi:10.1038/s41581-021-00489-1
43. Luo X-Q, Kang Y-X, Duan S-B, et al. Machine learning-based prediction of acute kidney injury following pediatric cardiac surgery: model development and validation study. J Med Internet Res. 2023;25:e41142. doi:10.2196/41142
44. Li H, Hu H, Li J, et al. Machine learning-based model for the prediction of acute kidney injury following coronary artery bypass graft surgery in elderly Chinese patients. J Thorac Dis. 2025;17:2519–2527. doi:10.21037/jtd-2025-264
45. Rank N, Pfahringer B, Kempfert J, et al. Deep-learning-based real-time prediction of acute kidney injury outperforms human predictive performance. Npj Digit Med. 2020;3:139. doi:10.1038/s41746-020-00346-8
 © 2026 The Author(s). This work is published and licensed by Dove Medical Press Limited. The
full terms of this license are available at https://www.dovepress.com/terms
and incorporate the Creative Commons Attribution
- Non Commercial (unported, 4.0) License.
By accessing the work you hereby accept the Terms. Non-commercial uses of the work are permitted
without any further permission from Dove Medical Press Limited, provided the work is properly
attributed. For permission for commercial use of this work, please see paragraphs 4.2 and 5 of our Terms.
© 2026 The Author(s). This work is published and licensed by Dove Medical Press Limited. The
full terms of this license are available at https://www.dovepress.com/terms
and incorporate the Creative Commons Attribution
- Non Commercial (unported, 4.0) License.
By accessing the work you hereby accept the Terms. Non-commercial uses of the work are permitted
without any further permission from Dove Medical Press Limited, provided the work is properly
attributed. For permission for commercial use of this work, please see paragraphs 4.2 and 5 of our Terms.